
Abstract
Air-jet spun yarn is specific to its core and wrapper surface layer. The core comprises a roughly parallel bundle of fibers, while the cover is a ribbon of fibers twisted around the core (wrapper fibers). Regarding yarn structure, the percentage of wrapper fibers to core fibers significantly influences the yarn tenacity of air-jet spun yarns. This work aims to determine the percentage of wrapper fibers from a total number of fibers in an air-jet spun yarn computed tomography (CT) cross-section. It first obtains, through image arithmetic, information about the degree of fibers’ inclination and their position within the cross-section. The dependence of these two parameters defines a radius (a limiting radius) that imaginatively divides the yarn cross-section into a core section and a ribbon section. Finally, from a certain number of pairs of yarn cross-section images, it evaluates the percentage of wrapper fibers in the air-jet spun yarn surface ribbon. The correctness of the described approach is validated by assessing the ring-spun yarn using the same procedure as the air-jet spun yarn. This paper presents the whole procedure of processing the pairs of cross-section images, finding the optimal pairs of images for the implementation of image arithmetic, the segmentation of the monochromatic image, the measurement of the geometric parameters of the objects on the binary image, and the processing of the data by a specially prepared code in the MatLab environment. The methodology determines the average percentage of wrapper fibers of 100% Tencel 23 tex air-jet yarn to be 36.3%.
Keywords
Introduction
The properties of staple-spun yarn are determined by factors encompassing the types of fibers used, their properties, and the yarn structure. The structure of staple-spun yarn influences not only the mechanical performance of the yarn but also its suitability for various textile applications.
The yarn structure is defined by the geometric arrangement of fibers, which can vary significantly depending on the spinning method employed. Today, ring and rotor spinning machines are widely used. The newest spinning method - air-jet spinning also found its place in the market due to the high spinning speed compared to ring and rotor machines and the possibility of producing fine yarn. Each of these spinning methods imparts distinct characteristics to the resulting yarn. Understanding these differences is crucial for optimizing yarn performance in various textile applications. Ring-spun yarns are characterized by their tight and compact structure, which results from the traditional spinning process where a drafting device attenuates the input product (a roving) into a thin fiber bundle. This bundle is twisted together using a traveler rotating on the ring around a spindle. Due to the twisting process, all or a portion of the fibers assume the requisite helical configuration within these yarns. The twisting occurs from the exterior to the interior. 1 This method allows for high fiber alignment, enhancing tensile strength.2,3 In contrast, rotor-spun yarns are produced using a different mechanism where the input product (a sliver) is opened into individual fibers fed into a rotor. Fibers are collected into a fine fibrous bundle and twisted into the rotating open end of the yarn. During the rotor spinning process, the fibers twist from the outwards inside. The core fibers are disposed of in a helical form, albeit with a lesser degree of parallelism. In contrast, the sheath fibers are arranged more randomly and exhibit a reduced twist level. Some fibers are also wrapped around the spun yarn.1,3 This method produces a less compact yarn and a lower packing density than ring-spun yarns. 4 Rotor-spun yarns typically exhibit lower tensile strength due to the less effective fiber orientation during the spinning process, which, on the other hand, causes lower hairiness and better abrasion resistance compared to ring-spun.5,6 An air-jet spinning machine utilizes a drafting arrangement to attenuate input product (a sliver) into a fine fibrous bundle fed into the spinning nozzle. Vortex air in the nozzle separates and deflects the trailing end of surface fibers from the fine strand and twists them around the yarn. Vortex spun yarn (also known as air-jet spun yarn) comprises two distinct layers. The core bundle, without twist, comprises fibers arranged in a parallel orientation relative to the yarn axis. The wrapping layer, however, exhibits a twisted configuration around the core. The fibers within this layer are formed in a manner that results in the convergence of the leading ends toward the center of the yarn, while the trailing ends, in conjunction with other fibers, are twisted around the core due to the swirling motion of air. 7 It results in a unique structure (a fasciated yarn) generally bulkier than ring and rotor-spun yarns.8,9 The air-jet spinning machine can produce a yarn with more uniform fiber distribution compared to rotor yarns, and it brings lower mass unevenness, less hairiness, higher tensile strength, and lower elongation compared to open-end rotor spun yarns. 10 It can also improve moisture management. 11 Air-jet spun yarns are typically less strong than ring-spun yarns but can offer advantages in terms of comfort and breathability, making them suitable for activewear and other applications where these properties are prioritized.9,11
Yarn structure, such as packing density, diameter, and fiber distribution, can be analyzed using yarn cross-section. Today, several methods can be used to imagine and visualize yarn cross-sections. Three of them are microtome, micro-computed tomography, and epoxy grinding–polishing methods. 12 According to Abdelkader et al., 12 the micro-CT is the fastest and non-destructive method compared to other methods, which allows 3D reconstruction of the scanned sample. According to Vysanska, 13 the standard soft cross-section methodology used to prepare fabric samples could cause some deformation of the studied structure; to eliminate this problem, virtual cross-section using computed tomography equipment can be used to reconstruct fabric cross-sections.
Due to its increasing prevalence in the textile industry, studying the structure of air-jet spun yarn is essential. Several studies have analyzed the fiber packing density and fiber migration index of Vortex – respective Rieter air-jet spun yarns,14–16 as well as fiber spatial trajectory. 17
About the yarn structure, the twist level and percentage of wrapper fibers to core fibers exert a significant influence on the properties of air-jet spun yarns, namely yarn tenacity.15,18–25 Shang et al. 21 demonstrated that the tenacity of viscose vortex spun yarns is positively correlated with the number of wrapper fibers and the wrapping angle. This increase in tenacity can be attributed to the increased ability of a greater number of wrapper fibers to tightly secure the internal parallel fiber bundle, thereby improving the overall structural integrity of the yarn. Tyagi 26 also presented that fine air-jet spun core yarns with a higher proportion of wrapper fibers exhibit improved tensile properties than those with fewer wrapper fibers. Specifically, more wrapper fibers contribute to more wraps per centimeter and a greater helix angle, improving the yarn’s ability to withstand tensile forces.
Various approaches have been documented to determine the proportion of wrapper fibers to core fibers (or the percentage of wrapper fibers) in air-jet spun yarns.
In a study conducted by Soe et al., 8 the researchers found that wrapper fibers of Vortex spun yarns of count 20 tex, composed of cotton fibers, constituted 32% of the total fiber content, and 11% of core fibers were transformed into wrapper fibers. During the experiment, they used a manual twisting device to untwist the yarn until the twists in the wrapped fibers reached zero. They proceeded to isolate thin layers of the untwisted fibers, capturing a digitized longitudinal image to facilitate counting the untwisted wrapper fibers. However, this method can present particular challenges; the distribution of wrapper fibers within the yarn structure cannot be uniform, particularly around the core. Additionally, leading fiber ends may be firmly embedded within the yarn core, complicating the process of accurate separation and counting. Consequently, certain fibers may be counted multiple times using this approach.
Tyagi et al. 27 employed tracer-fiber techniques to investigate the structure of Vortex polyester-viscose yarns of count 20 tex and 15 tex. They identified three categories of fibers within this structure: core, wrapper, and wild fibers. Furthermore, based on the proposal of Rajamanickam et al., 28 they classified surface yarn structure according to the following characteristics: tight wrappings, long wrappings, irregular wrapping, and unwrapped parts. The authors observed that the yarns examined contained 40%–50% wrapper and wild fibers. The limitations of this technique include the fact that the traced fibers represent only a minor fraction of the total wrapper fibers. Furthermore, the longitudinal images captured only the yarn’s outer surface, making it impossible to ascertain the quantity of wrapping fibers beneath those visible at the edges. However, one notable benefit of this method is its relative ease of execution.
Eldeeb et al. 29 examined viscose and lyocell air-jet yarns produced on a Rieter air-jet spinning machine. They utilized microscopic images of longitudinal views of yarn. They assessed the proportion of wrapping fibers by comparing the volume of the wrapping fiber ribbon in relation to the overall yarn volume. Their findings indicated that these yarns contained 30% of wrapper fibers. However, it is essential to note that this method, utilizing only microscopic images of the longitudinal yarn section to measure the diameter of the yarn core and total yarn diameter, including wrapper fibers, is relatively subjective when calculating volume.
The following method was presented by Erdumlu et al. 30 They manually untwist the carded cotton vortex spun yarns to separate the wrapper fibers from the concise section of the yarn and weigh them to calculate the ratio of wrapper fibers to core fibers. They reported that this ratio varies between 0.43 and 0.9, depending on the yarn count. However, the methodology lacks a detailed description, particularly regarding the length of the yarn sections that need to be untwisted. It should be noted that the method also has notable drawbacks. These include the significant precision and labor involved in separating the core and wrapper fibers and the necessity for high accuracy in weighing the fibers.
Shang et al. 21 employed the longitudinal views of yarn captured with a scanning electron microscope to quantify the wrapping angle, appearance diameter of the yarn, and helix pitch of the wrapper fiber layer. Additionally, they visually observed the number of wrapper fibers present in the 100% viscose Vortex yarns spun with various spinning air pressure. However, it is noteworthy that the authors did not directly count the wrapper fibers.
Leitner and Schwippl 31 analyze Rieter air-jet spun yarns made of lyocell fibers and assert that the proportion of wrapper fibers can vary between 15% and 30% of the total number of fibers, depending on the yarn count. However, they did not provide a detailed description of the methodology employed in their study.
The most recent methodology was introduced by Mertová and Moučková. 16 They made cross-sections perpendicular to the yarn axis and, based on the size and deformation of the fiber cross-sections within these sections, identified the fibers belonging to both the yarn core and the wrapper fiber ribbon. They posited that the fibers in the core bundle are aligned parallel to the axis of the air-jet spun yarn, while the wrapper fibers are arranged in a ribbon formation and exhibit a helical shape due to the twist. Consequently, these wrapper fibers form an angle with the yarn axis and display a deformed cross-section, unlike the fibers in the core bundle, which maintain a non-deformed cross-section. The authors employed a frequency method (direct calculation) and reported that the ratio of wrapper fibers to the total fiber content in the yarn cross-section ranges from 0.21 to 0.26. This method is efficient in terms of time; however, a notable drawback is a subjective determination of the boundary between the yarn core and the wrapper fibers, mainly when dealing with fibers with a non-circular cross-section. Therefore, this method is best suited for yarns composed of fibers with a circular cross-section.
Generally, the percentage of wrapper fibers in yarns is critical in determining the resulting textiles’ mechanical, physical, and comfort properties. By manipulating the amount of wrapper fibers in air jet-spun yarn, manufacturers can tailor yarn characteristics to meet specific performance criteria, balancing strength, air permeability, comfort, and durability. This versatility can make air-jet spun yarns a valuable option in the textile industry, allowing for the production of high-performance fabrics suitable for a wide range of applications. The knowledge of the percentage of wrapper fibers is also necessary for modeling yarn structure. Researchers typically employ microscopic analysis and image processing techniques to quantify the percentage of wrapper fibers. Microscopy allows for the visualization of the yarn structure, revealing the distribution and arrangement of both core and wrapper fibers. High-resolution longitudinal images of yarn or images of yarn cross-sections can be captured using scanning electron microscopy (SEM) or optical microscopy. Correctly identifying wrapper and core fibers is crucial for determining wrapper fibers from air-jet spun yarn cross-sections. The tracer fibers can be used for better identification. Still, they represent only a small fraction of the total wrapper fibers, and the longitudinal images captured only provide insight into the outer surface of the yarn. This limitation makes it impossible to ascertain the quantity of wrapper fibers that may be hidden beneath the visible fibers, leading to an incomplete understanding of the yarn’s structure. Also, the identification of core and wrapper fibers from the yarn cross-section can be impossible due to the deformation of the fibers during the preparation of the yarn sample.
Therefore, for modeling and prediction of air-jet spun yarn properties, it is crucial to apply a suitable methodology for determining the percentage of wrapper fibers and to be able to identify core fibers and wrapper fibers. In this work, the newly proposed method seeks a solution to this problem by evaluating CT cross-sections. It evaluates the fiber inclination in two optimally spaced cross-sections using image arithmetic. The approach defines a limiting radius based on the progression of the object parameter function along the image arithmetic and their interactions within the yarn cross-section. The limiting radius separates a portion of the air-jet spun yarn core and the wrapper fibers. Finally, the method evaluates the percentage of wrapper fibers in the air-jet spun yarn surface ribbon from a certain number of pairs of yarn cross-section images. The correctness of the described approach is validated by assessing the ring-spun yarn using the same procedure as the air-jet spun yarn.
As the review of previous methodologies and especially the tested air-jet spun yarns shows, only cotton-type fibers are used for their production, namely cotton and cellulose fibers such as Lyocell, Viscose, and Tencel. Therefore, the presented methodology could contribute to deepening the knowledge of the behavior of cellulose fibers in air-jet spun yarns.
Proposed methodology
An air-jet spun yarn comprises two distinct parts (core fibers and wrapper fibers ribbon), probably connected by fibers migrating or passing from one part of the yarn to the other (see Introduction). The fibers in the core of the air-jet yarn are theoretically parallel to the axis of the yarn. In contrast, the fibers on the larger radii (wrapper fibers) are twisted around the core, that is, at a certain angle to the axis of the yarn. The cross-sectional area of a fiber parallel to the yarn axis will undoubtedly be smaller than that of a fiber inclined to the yarn axis. Figure 1 schematically shows an element of a skewed (twisted) fiber at an angle ϑi from a yarn cross-section, showing the difference between the cross-sectional area size of the skewed and un-sloped fiber (s vs s* ui ).

Fiber element from yarn cross-section, modified from Neckar and Das. 32
The proposed methodology aims to obtain information on the degree of fiber inclination in the yarn by comparing two optimally distant yarn cross-sections. It works with two images of yarn cross-sections defined far apart (value dl in Figure 1). So, they most likely have the same fibers and cross-sections. At the same time, their displacement in the case of inclined fibers is readable (Figure 1 upper cross-section of fiber s* ui vs lower cross-section of fiber s* li ).
Image arithmetic tool
A tool for comparing two optimally spaced images of yarn cross-sections was the complement to the intersection of two monochromatic images of CT cross-sections, also known as the symmetric difference. 33 It is a tool of image arithmetic, where it is the sum of the difference of images A and B and B and A. Image arithmetic is the implementation of standard arithmetic operations, such as addition, subtraction, multiplication, and division on images. 34 First, image A (Figure 2(a)) was specified as the reference (the actual image is copied into a disk file, where it remains as the reference image until it is replaced explicitly with another image), and image B (Figure 2(b)) is left as the actual image. 34

CT air-jet spun yarn cross-sections at a distance of 25 μm: (a) image A and (b) image B.
The reference image was then subtracted from the actual image, that is, B minus A. The result of the subtraction was stored (see Figure 3(a)). Then, the opposite subtraction was performed similarly, that is, image A minus image B (see Figure 3(b)). Finally, the two results were summed (see Figure 3(c)). The whole symmetric difference process can be written in two ways, either (B − A) + (A − B) or (B/A) + (A/B). The work with the images was performed directly on monochrome images in the NIS Elements image analysis environment. 35

Example of A and B image processing by image arithmetic for air-jet spun yarn cross-sections distant 25 μm: (a) B/A, (b) A/B, and (c) (B/A) + (A/B).
Determination of the optimal distance between two CT cross-sections
We now turn to the problem of the optimal distance between two CT cross-sections (Figure 1 – parameter dl). The previous procedure of working with two images was implemented on images of yarn cross-sections at different distances. Suppose the cross-sections are too close to each other, and the fiber elements are too short. In that case, it is impossible to correctly identify the objects in the resulting image after image arithmetic operations and, therefore, not to process them further. Figure 4(a) shows the final image after image arithmetic operations when the distance between two cross-sections is 0.5 μm. No fiber fragments are visible. On the other hand, if the distance of the cross-sections is too large (Figure 4(b) – the distance of the cross-sections is 50 μm), some fragments may be lost after the implementation of the mathematical operations, the cross-sectional areas of the fibers occur in one cross-section, but in a cross-section that is too far away, the situation is already completely different.

Sample images after implementing image arithmetic at different cross-section distances: (a) 0.5 μm and (b) 50 μm.
The staple fibers have a finite length, and the fibers in the yarn migrate – they do not always stay in the same position within the radius (radial migration), nor do they always have the same inclination concerning the yarn axis (twist migration).36,37 In the case of a larger distance between the yarn cross-sections, the cross-sections of the fibers from both yarn cross-sections may not be correctly matched. Given the previous arguments, a cross-sectional distance of 25 μm was experimentally chosen as optimal (see the result in Figure 3(c)). Two questions arise here. It will be necessary to vary the cross-sectional distance for yarns of different fineness and made of different materials. Fine yarns have a lower number of fibers in the cross-section than coarser yarns, but this does not require a change in the cross-sectional distance. The materials used to date for the production of air-jet yarns are of the cotton type, namely cotton and various types of cellulose fibers. These have different cross-sectional shapes. The cross-sectional shape of the fibers in the yarn should theoretically not affect the results (see examples in Figure 5(c) and (d)), as the methodology works with the area and axis length of the object obtained through image arithmetic (see below). However, this is only an assumption that will be verified.

Schematic representation of variants of fragments of differently inclined fibers after image arithmetic (B/A) + (A/B): (a) initial position of fiber circular cross-sections, (b) fiber circular cross-sections after image arithmetic, (c) cotton-like cross-sections after image arithmetic, and (d) viscose-like cross-sections after image arithmetic.
As explained earlier, based on its production technology, the air-jet spun yarn can be characterized by a parallel fiber core and a surface ribbon of wrapper fibers. To assess the optimum cross-section spacing, the model representation of the results of the object shapes and fragments after performing image arithmetic – symmetrical difference – served well. This is shown schematically in Figure 5. Practically, it results from the symmetrical difference of s* ui and s* li from Figure 1.
If the fibers are parallel to the yarn axis, then the result of the image arithmetic should be a fragment-free image, see Figure 4(a). Even a slight inclination of the fiber concerning the yarn axis will cause two “crescents” to appear in the resulting image (first and second cases in Figure 5). Suppose the inclination of the fiber to the yarn axis is even greater. In that case, the final image after image arithmetic will have two cross-sections of the same fiber, namely the cross-section from the first image (upper s* ui cross-sectional area, Figure 1) and the cross-section from the second image (lower s* li cross-sectional area, Figure 1; third case in Figure 5). The well-legible variations of fiber fragments after image arithmetic on images of cross-sections spaced 25 μm were one of the reasons for choosing this cross-sectional distance as optimal (see Figure 3(c)).
The resulting image after image arithmetic was further thresholded using the Otsu method in the NIS Elements image analysis. 38 Fragments of fibers or their entire cross-sections were thus defined as objects in the binary image. The parameter “width” is characterized as the “area” of the object relative to its “length” (the length of the object axis). This complex object attribute “width” was chosen as a suitable description of the degree of inclination of the fiber element. Therefore, we do not explicitly define the angle of inclination of the fiber element to the yarn axis. The inclination of the fiber element is determined by the result of the symmetrical difference of two cross-sections of the same fiber in two optimally spaced yarn cross-sections (Figure 5(b)–(d)).
In addition to the width, the coordinates of the objects’ centers of gravity were also measured. The matrix of these two parameters is the input to a specially created code in the MatLab programing language.
Image analysis data processing
The code works as follows:
The center of mass of the whole binary image is calculated as the average value of the centers of mass of the individual binary objects.
The coordinates of the object centers are translated so that the center of mass of the entire binary image is the new origin of the coordinate system. Figure 6 shows the translation control of the binary image acquired from Figure 3(c).
Transformation of centers of mass of objects from Cartesian coordinates to polar coordinates.
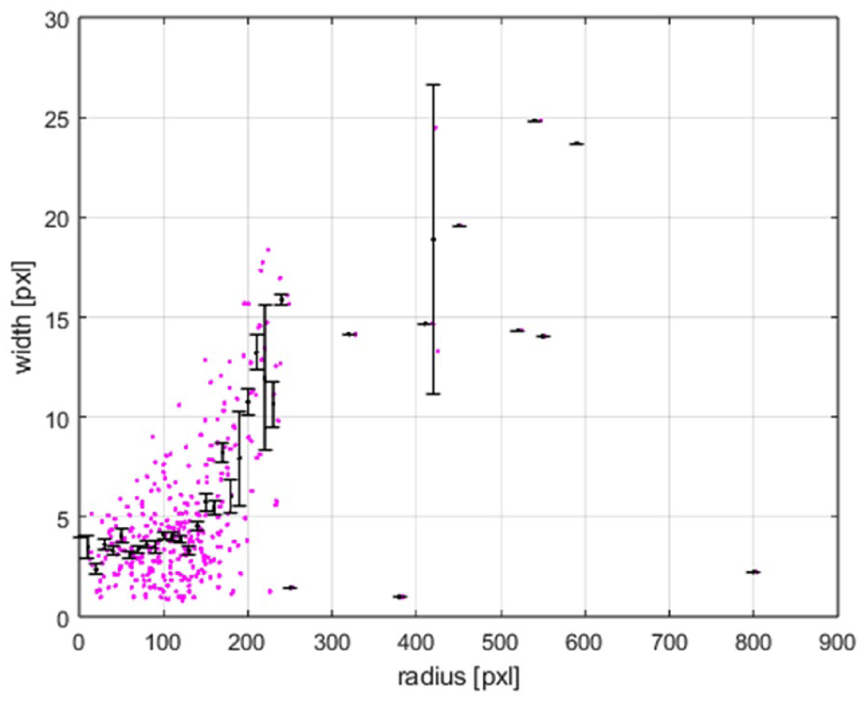
Plotting objects’ width dependence on the radius where the objects are located, Figure 7.
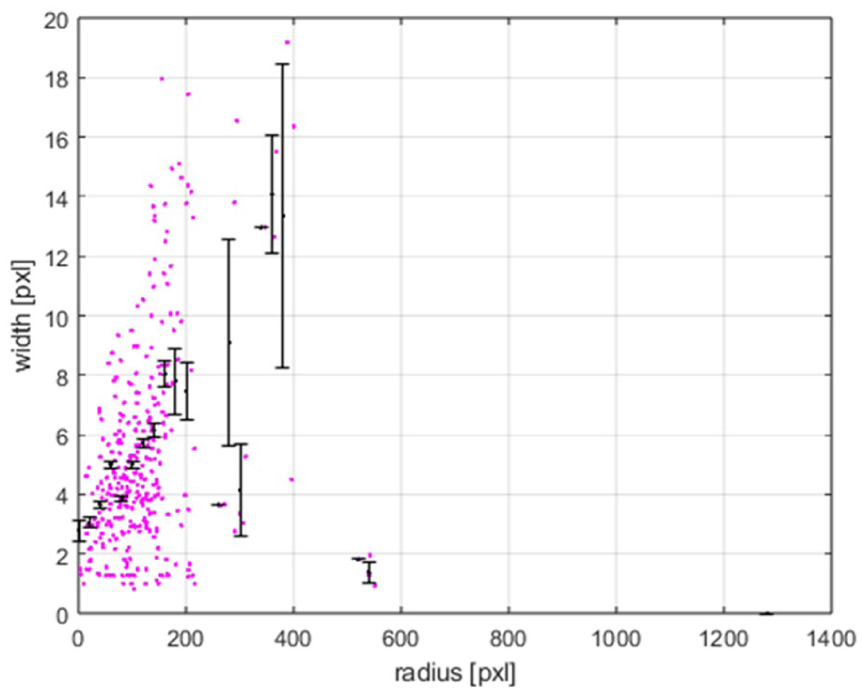
Calculate average width values at specific radii (Figure 7, black points with confidence intervals). The step between each radius was chosen to be 20 pixels, which at a calibration of 0.5 μm/pixel is 10 μm. The step value appears optimal regarding noise in the width values caused by fiber migration. If the step size is too small, for example, 5 μm (see Figure 8), then migrating fibers will cause distortions in the progression of the average width values, especially in the central region of the yarn.
Finding the difference between the average width values at adjacent radii, Figure 10. This is practically the rate of change within a radius of 20 pixels (10 μm). The goal is to find the radius at which the change from a constant function to an increasing function occurs mathematically. The fibers in the central region of the air-jet yarn will not always be perfectly parallel. There is a slight migration of the fibers, and even the fibers themselves are distorted to some extent. Therefore, even a given width dependence on radius in this region will not be completely constant; see Figure 7, the area in front of the red vertical line. It was necessary, therefore, to go back to the image after image arithmetic to estimate this limiting radius (Figure 9), where the core of the air-jet yarn is approximately located. This estimate will be the initial condition for determining the final limiting radius.
Calculate the average value from the differences to the limiting radius estimate (Figure 10, red horizontal line). If the value of the differential exceeds the average value of the differential, then a limiting radius is defined on the value of the previous radius. The limit radius must also satisfy the condition that it must not be smaller than the limit radius estimate.
The percentage of wrapper fibers is then calculated as the ratio of the number of objects located within and at the limiting radius to the total number of objects in the image after image arithmetic. The described procedure for obtaining the percentage of wrapper fibers in the air-jet yarn ribbon is repeated on a certain, larger number of images obtained by image arithmetic.
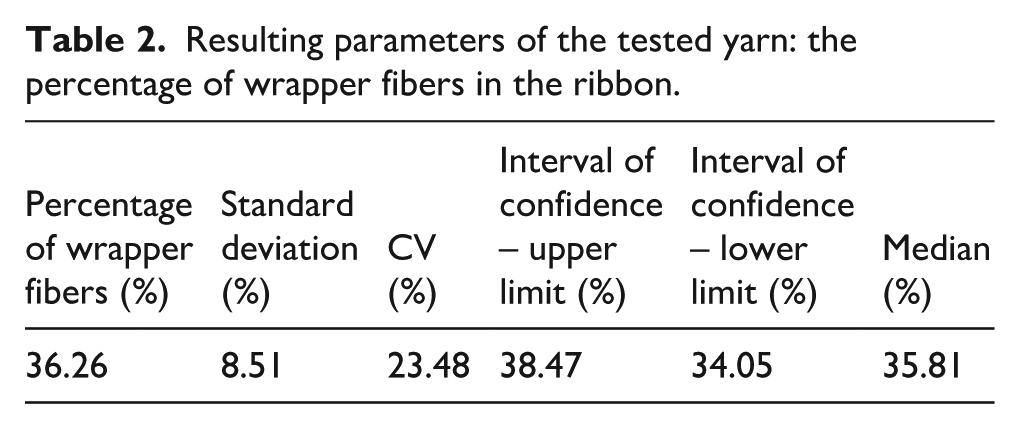
The outlying data of the percentage of wrapper fibers are excluded, the basic statistic for the percentage of wrapper fibers is calculated, and the distribution of the percentage of wrapper fibers is displayed graphically. The resulting distribution of the percentage of wrapper fibers in the ribbon for the Tencel yarn tested is shown in Figure 11. Table 2 summarizes the basic statistics for the same yarn.

Checking the translation of object centers of mass – 1 pair of cross-sections.

Air-jet spun yarn (one pair of cross-sections): dependence of object width on the object position in yarn (magenta points), average width values at specific radii (black points with confidence intervals), limit radius (red vertical line) – radius step: 20 pixels.
Air-jet spun yarn (one pair of cross-sections): dependence of object width on the object position in yarn (magenta points), average width values at specific radii (black points) – radius step: 10 pixels.

Example of an initial subjective estimate of the limit radius.

Progress of the differences of the object width between each radius (blue points), average difference (red horizontal line).

Distribution of the percentage of wrapper fibers – 57 pairs of cross-sections.
The limit radius (Figure 7 – vertical red line) defines the air-jet spun yarn’s core part and ribbon. Table 1 summarizes the basic statistics for the limiting radius calculated from 57 pairs of cross-sections of the tested air-jet yarn randomly selected from a 3.3 mm yarn length.
Resulting parameters of the tested yarn – limiting radius.

Tested material and used equipment
The air-jet spun yarn of count 23 tex, composed of 100% Tencel fibers (Figure 12(a)), was imaged and then reconstructed using computed tomography (CT), Rigaku Nano3DX (target material: Cu, accelerating voltage: 40 kV, current: 30 µA, resolution: 0.54 µm/voxel). The accuracy of the proposed methodology was confirmed by evaluating 100% Tencel carded ring-spun yarn of count 23 tex (Figure 12(b)) using the identical protocol used for evaluating air-jet spun yarn. Figure 2(a) and (b) show a 3.3 mm long section of yarn. The hairiness of staple spun yarn at such short sections varies greatly; thus, the presented yarn section cannot be taken as a reference for comparing air-jet spun yarns and ring-spun yarn hairiness. In practice, the hairiness is repeatedly measured on a minimum of 50 m of yarn.

CT image – reconstructed spun yarn: (a) air-jet spun yarn and (b) ring spun yarn.
The scanning parameters on the Rigaku Nano3DX CT device for the individual yarns tested were identical for both types of yarn. The field of view was 0.89 × 0.90 × 3.26 mm, with several fields of view always merged on top of each other. The rotation size was 0.225° (800 projections over 180°). Native activation software for nano3DX and reconstruction software from Rigaku were used to acquire the CT scan and its subsequent reconstruction. For the scanning itself, the yarn sample was clamped inside a Kapton tube and fixed at the ends with a hot glue gun. The Kapton tube was then slid onto a steel rod, which was fixed in a vice.
The fineness of the Tencel fiber was 0.13 tex, and the nominal fiber length was 38 mm. The sliver of count 4600 tex was subjected to three passages of doubling and drawing. The air-jet spun yarns were produced using a Rieter air-jet spinning machine under the following spinning conditions: spinning speed: 400 m.min−1, spinning air pressure: 6 bar, spinning nozzle housing: Z-1 and a spinning tip type of U 1.2 mm/A0.8. Carded ring spun yarn with a twist of 766 tpm was spun on a conventional ring-spinning machine at a spindle speed of 9500 min−1.
An approximately 3.3 mm long yarn segment was reconstructed from 6133 cross-sectional CT scans. Thus, the distance between each section was approximately 0.5 μm, corresponding to the calibration.
The optimal distance between two CT cross-sections was then determined and compared. The determination procedure was described in the previous chapter.
The character of the air-jet yarn, that is, the central parallel fibers and the twisted peripheral ribbon, should theoretically show up as a non-decreasing function (constant function followed by an increasing function) in the progression of the average widths as a function of radius, Figure 7. In the case of ring-spun yarns, it should be an increasing function, Figure 13, there is no central bundle of parallel fibers, the yarn is mainly made up of twisted fibers. 1 In particular, Figure 13 shows the results from evaluating one pair of cross-section images with ring-spun yarn with the same parameters as the tested air-jet yarn.
Ring-spun yarn (one pair of cross-sections): dependence of object width on the object position in yarn (magenta points), average width values at specific radii (black points) – radius step: 20 pixels.
Discussion
The proposed methodology aims to compare the images of the air-jet spun yarn cross-sections optimally spaced apart. The tool of image arithmetic – symmetrical difference – is used for comparison, which results in a practical complement to the intersection of two sets, in our case, two fiber cross-sections in given yarn cross-section images. The value of the optimal distance is certainly up for discussion. Here, it was set to 25 μm (see Figure 3(c)) because the subsequent processing into a graph of the dependence of the object width versus its position in the cross-section correctly captures the nature of the internal structure of both the air-jet yarn (Figure 7) and the ring-spun yarn (Figure 13). Another issue is the correct choice of the “width” parameter of the objects obtained after image arithmetic - symmetrical difference. The width is the ratio of the area of the object and the length of its main axis. If we used only the “area” parameter, the information about the object’s stretch would be lost. In the case of “length,” we would lose the notion of the area of the object. Again, the graphs in Figures 7 and 13 demonstrate the correctness of the choice of the given parameter “width.” As expected, the dependencies show the nature of the air-jet yarn – a monotonic function (constant function followed by an increasing function) and the ring-spun yarn – an increasing function. The search for the limiting radius that separates the core section and the wrapper fibers of air-jet yarn is another subject for discussion. Before determining the limiting radius, the differences in the width parameter on the adjacent radii are first calculated, while the estimation of the limiting radius is determined directly on the image after image arithmetic in the image analysis environment (Figure 9). For the central bundle of approximately parallel fibers, it must be true that the difference of widths in this region of the cross-section will be minimal, while the difference of object widths in the surface ribbon of fibers at the radii in this region will tend to increase. The limiting radius is determined based on two conditions: the values of the differences in the widths of the objects up to the limiting radius must be smaller than the value of the average difference calculated from the values of the differences up to the estimate of the limiting radius, and at the same time the value of the limiting radius must not be smaller than the value of the estimate of the limiting radius. The limiting radius thus determined is shown by the red vertical line in Figure 7, quite clearly separating the approximately constant progression of average width values from the increasing function of a given parameter as a function of radius.
It is necessary to discuss the representativeness of the results from the 3.3 mm yarn segment and their variability over the whole yarn length. The 3.3 mm yarn length can accommodate at least one helix of wrapper fibers (Figure 12(a)). The representativeness of the results from such a short yarn segment can most likely not be spoken of, already due to a certain unevenness of the yarn, or the finite length of the staple fibers in the yarn. From a statistical point of view, a larger number of measurements should lead to more accurate results and reduce their variability. It would therefore be appropriate to repeat the measurements on randomly selected sections, preferably from the entire length of the tested yarn.
The literature recommends 40–50 cross-sections from random places in the yarn of 100 m length to describe the structural characteristics of soft real cross-sections. 12 This skein represents yarn with a fineness that is closest to the average fineness value calculated from 10 measurements according to the Technical European Standard. 39
It cannot be said that the proposed method is better than existing methods, but it shows further possibilities for determining the percentage of fibers in a ribbon. The method is non-destructive, so unlike the soft cross-section method, there is no deformation of the yarn cross-section or pulling of fibers from the yarn. The images are easy to read and easy to process compared to the soft cross-section method, where it is often necessary to focus the cross-section at different depths of field for good readability of all fibers in the cross-section. Even so, the contours of the fibers may not always be easy to read, which makes automatic image processing difficult. The image of a real soft yarn cross-section obtained by light microscopy does not meet the conditions for subsequent image arithmetic as in the proposed methodology. For a real cross-section image, the individual fibers must first be segmented, which is not always easy. The biggest problem, however, is the requirement for successive optimally spaced sections, which is very difficult to achieve in the case of real cross-sections. Thanks to CT, we can obtain precisely spaced sections from any yarn section for subsequent processing using the proposed methodology. Compared to the tracer fiber method, the proposed method can describe the behavior of all fibers in the monitored section of yarn. The possible approach of SEM images and subsequent measurement of the angles of inclination of wrapper fibers does not provide information about the percentage of wrapper fibers. SEM only captures the specimen’s surface structure and cannot penetrate its structure, unlike CT.
The methodology can be implemented in a laboratory with a CT scanner and image analysis. However, connecting industry with a specialized laboratory is not a problem in today’s digital age.
Conclusion
The Introduction provides a comprehensive account of several procedures for determining the percentage of wrapper fibers in an air-jet yarn surface ribbon. The methodologies use various approaches, including assessment of the external structure, air-jet yarn untwisting, longitudinal air-jet yarn sections, tracer fiber technique, and real soft cross-sections with a given yarn.
The novel proposed method is also based on cross-sections but virtual CTs, which allow evaluation of the actual internal form of the object. The methodology uses the possibility of selecting cross-sections with a defined distance from each other. The CT technique also ensures that the position of the cross-sections is identical along the entire length of the scanned yarn, thus determining the correct assignment of the fiber cross-sections from two optimally consecutive yarn cross-sections (Figures 2–4). The main principle of the proposed procedure for determining the percentage of wrapper fibers in air-jet yarn is to separate a portion of the core and the wrapper fibers of the yarn. The methodology uses an image analysis tool – image arithmetic (symmetrical difference) performed on two optimally spaced images of virtual cross-sections. Through the parameter “width” of the objects, information about the degree of inclination of the fibers throughout the yarn cross-section is obtained, and the limiting radius is determined based on the change in the course of this function. Its value separates the central part and the wrapper part of the air-jet yarn. In addition to the air-jet yarn CT cross-sections, the ring yarn cross-sections were also evaluated. The final progression of the inclination of the fibers to the yarn axis as a function of their position clearly demonstrates the correctness of using image arithmetic tools; there is no central parallel bundle of fibers, and the fibers are already inclined close to the yarn axis (Figure 13).
The resulting value of the percentage of wrapper fibers in the studied 100% Tencel air-jet spun yarn found by the presented methodology is 36.3% (Table 2). Unfortunately, the degree of agreement with other approaches cannot be stated because the scatter of their results is too large.
Resulting parameters of the tested yarn: the percentage of wrapper fibers in the ribbon.
In the future, it will be necessary to determine the optimal number of pairs of cross-sections for representative results of the percentage of wrapper fibers in air-jet spun yarn. Further, the methodology for air-jet spun yarns made of fibers other than circular cross-sections is planned to be tested and used to evaluate the percentage of wrapper fibers in the ribbon of air-jet yarns produced of different spinning variables. The downside of the methodology is that access to CT equipment is not always easy. However, if the possibility of using CT exists, then the methodology seems to be universally applicable to all yarn types in terms of technology and probably also material.
Footnotes
Ethical considerations
Not applicable.
Author contributions
Eva Mouckova carried out the scientific research, and Monika Vysanska realized the development of the methodology. The first draft of the manuscript was written by Monika Vysanska, all authors commented on previous versions of the manuscript. All authors read and approved the final manuscript.
Funding
The authors received no financial support for the research, authorship, and/or publication of this article.
Declaration of conflicting interests
The authors declared no potential conflicts of interest with respect to the research, authorship, and/or publication of this article.
Data availability statement
The data that support the findings of this study are available from the corresponding author upon reasonable request.