
Abstract
This investigation aimed to optimize both the structural and acoustic properties of bamboo biocomposite as a sustainable sound absorber through a combination of experimental and modeling approaches. Bamboo composite panels were fabricated with varying structural parameters, including density, thickness, binder concentration, and fiber ratio. Following the optimization of the composite, absorption coefficient calculations were conducted using an impedance tube, along with mathematical models such as Johnson-Champoux-Allard (JCA) and Delany-Bazley (DB). Porosity and airflow resistivity (AFR) parameters were directly determined, while the parameters of tortuosity, viscous, and thermal characteristic length were inversely determined using the differential evolution algorithm in MATLAB. The Field Emission Scanning Electron Microscope (FESEM) was also used for the morphological analysis of the samples. The outcomes revealed a significant increase in Sound Absorption Coefficient (SAC) at various frequencies with the augmentation of density and thickness. For the optimal composite (density: 250 kg/m3, thickness: 40 mm, binder concentration: 20%, and fiber ratio F:C = 65:35), the average SAC above 630 Hz was 0.75. Furthermore, the impedance tube results exhibited noteworthy concordance with the predictions of the JCA model. Conclusively, the findings of this research underscore the potential of natural bamboo fiber-based composites as promising sound absorbers for effective sound control in indoor environments.
Introduction
In recent decades, technological advancements, industrialization, and urbanization have contributed to increased welfare and convenience. However, this progress has also led to a significant challenge: the generation of noise at hazardous levels of sound pressure.1,2 In 2020, approximately 7.9 million individuals across the United States were highly annoyed by roadway noise, as estimated. 3 Exposure to elevated noise levels not only results in hearing loss and auditory disorders but also triggers additional effects, including sleep disturbances, cardiovascular impacts, and psycho-physiological effects. 4 Hence, the significance of controlling noise exposure cannot be overstated. One approach to mitigating noise in indoor settings involves employing fiber materials to absorb sound energy. Essentially, these sound absorbers diminish the overall pressure level by absorbing reverberations within the environment. 5 Acoustic absorbers utilized for reverberation control in indoor environments contribute to enhanced acoustic comfort, facilitating factors like speech intelligibility within the space.
Fiber materials hold significant importance in the construction industry, serving as both thermal and noise insulators.6,7 These fibers are categorized into natural and synthetic varieties. Traditionally, synthetic fibers like mineral fibers, including rock wool and glass fibers, dominated the market, offering notable effectiveness in sound absorption alongside other attributes such as thermal and mechanical resilience. Despite their high efficiency, synthetic fibers pose numerous challenges. They cannot be disposed of in landfills due to environmental concerns, lack of recyclability, emitting toxic fumes when incinerated at the end of their life cycle, and posing health risks such as respiratory, skin, and ocular issues.4,8
Hence, researchers have shifted their focus toward less detrimental alternatives like natural fibers. Typically sourced from plants or animals, natural fibers are biodegradable, cost-effective, and pose minimal health risks. These fibers can be utilized for sound absorption in two main ways: either in their raw form or as fillers within a polymer matrix.8,9
To date, numerous studies have explored the utilization of various natural fibers for sound absorbers, with some of these investigations summarized in Table 1.
A summary of studies conducted on the acoustic properties of natural fibers.

As depicted in Table 1, natural fibers exhibit distinctive acoustic characteristics, positioning them as viable alternatives to synthetic fibers, particularly for acoustic panels utilized in indoor settings.
Among all plant fibers, bamboo, known for its rapid growth and low density, offers numerous advantages over other plant fibers. With its high strength, natural resistance to pests, and ability to sequester carbon dioxide, bamboo is gaining attention as a sustainable alternative for various applications. Its unique properties make it particularly suitable for use in bio-composite products, including sound absorbers.
The objective of this research was to enhance the structural and acoustic characteristics of bamboo fiber panels. Acoustic properties were assessed through experimental analysis using impedance tube methodology, alongside mathematical modeling employing JCA and DB models. Optimization of composite parameters was conducted utilizing experimental design software, with consideration given to variables such as sample thickness, fine/coarse fiber ratio (F:C), adhesive percentage, and density. Initially, the acoustic properties of the target samples were evaluated via impedance tube testing. Subsequently, optimal acoustic conditions were determined through experimental design software, with the composite intended for applications in automotive, construction, and noise control both indoors and outdoors, as part of numerical and experimental investigations.
Materials and methods
Material
Bamboo stems, ranging from 30 to 50 mm in diameter, were sourced from Fuman City in northern Iran. Sodium hydroxide (NaOH; 95% purity) and Polyvinyl Alcohol (PVA) binder (Extra Pure Grade, Neutron brand, Iran) were acquired from the Tamadkala store. PVA, known for its biodegradability and high solubility in water, has been widely utilized in numerous studies as a binder for natural fibers.19,20 Preparation of the PVA glue involved weighing PVA powder according to the desired concentration (in mass/volume percentage), followed by mixing it with a specific volume of distilled water using a mechanical stirrer set at 500 revolutions per minute. The mixture was then heated to 80°C and maintained for 4 h.
Fiber extraction
To extract fine bamboo fibers, the bamboo stems underwent a process where the nodal and very thin exoderm layers were initially removed, leaving the cylindrical, hollow stem for fiber extraction. The stems were then cut into strips measuring 0.5–1 mm in thickness and approximately 10 mm in width. These bamboo strips were immersed in a 5% w/v sodium hydroxide solution in a plastic container for 48 h to extract the fibers via an alkaline process. Afterward, the alkaline bamboo strips underwent multiple rinses with water, and the fibers were separated using a sharp knife through a process involving combing and scratching. Following another rinse with water, the extracted fibers were left to air-dry. Finally, the obtained fibers were cut into sizes ranging from 10 to 20 mm. For the preparation of coarse bamboo fibers, dried bamboo stems were initially shredded into chips using a drum chipper and further cut into smaller pieces using a ring flaker. These smaller pieces were then submerged in a 4% w/v sodium hydroxide solution for 6 h to enhance surface properties and increase roughness. Subsequently, they underwent thorough washing with water.
Response surface methodology
Response Surface Methodology (RSM) based on Central Composite Design (CCD) is a mathematical and statistical technique for modeling and optimizing experiments to examine the effects of various variables on experimental responses. 21 RSM has been utilized in various studies for modeling and optimizing different processes, demonstrating its cost-effective and suitable nature for the optimization and modeling of various processes.21,22 In this investigation, RSM-CCD, featuring four parameters, five levels, and four central points, were employed to ascertain the optimal levels of structural parameters influencing the acoustic properties of the samples. RSM models behavior across the operational range, constructing a mathematical model to predict the relationship between parameters and responses for optimizing the response of influential factors. CCD conforms to a polynomial model with an optimal number of experiments. Despite being an empirical model, it doesn’t necessitate precise knowledge of the reaction mechanism during modeling. 23 CCD employs the following equation to determine the optimal number of experiments:

Where, n represents the total number of experimental conditions, k and Cp denote the number of independent parameters and replications at the central point, respectively. Thus, considering K = 4 and Cp = 6, a total of 30 experimental design conditions were formulated to explore the effects of four independent factors on the Sound Absorption Coefficient (SAA). 19 The experimental design points were strategically chosen to allow rotation, ensuring constant variance of the prediction model at all points away from the design center. Replications at the center are pivotal as they offer an independent estimate of the experimental error. 21 Subsequently, based on prior studies, the range of variations for each independent parameter was determined and coded at 5 levels (±1 for factorial points, 0 for central points, and α ± 1 for axial points). The relationship between coded values and actual values of independent variables is depicted in Table 2, while Table 3 outlines the studied independent parameters within the coded range and levels. For regression analysis, plotting response surfaces under optimal conditions, and statistical significance evaluation, the Design Expert v.11 software (Stat-Ease Inc., USA) was utilized. Normal plot analysis and residual analysis from the analysis of variance (ANOVA) were employed for statistical significance assessment.
Relationship between coded and actual values of variable.

Factors and their levels for CCD.

Sample preparation
The stages of sample fabrication and the levels of independent variables, including binder concentration, density, thickness, and the fiber ratio, are presented in Table 4. Following the CCD method employed in this research design, 30 samples in various conditions of the variables were prepared, comprising 6 states at central points, 8 states at axial points, and 16 states at factorial points. Table 4 also presents the SAA values alongside the independent variable levels for each experimental condition.
Design matrix and the responses for central composite design.

Sample 21 was excluded due to composite instability, while Sample 7 was omitted because its high concentration made it difficult to handle and led to excessive pore closure. This decision was made to ensure model integrity and reliable results.
After determining the variable levels at each stage, the sample preparation involved weighing specified masses of bamboo fibers and granules. Subsequently, considering the total mass of the filler with a constant ratio (the ratio between the filler mass and the volume of consumed binder), PVA binder was combined. The samples were then molded in steel molds with diameters of 30 and 100 mm (in accordance with the diameters of the impedance tube) to form the desired shapes, and then they were closed in hand clamps for 24 h to prevent swelling of the samples and dimensional changes. The samples were left to dry in open air for a week, and weight variations were monitored until reaching a constant weight to ensure complete drying. Figure 1 illustrates the stages of the bamboo composite preparation process.

Bamboo composite fabricating steps.
Measurement of sound absorption coefficient
The determination of the sound absorption coefficient under normal incidence conditions followed ISO 10534-2 standards, employing an impedance tube setup. 24 Figure 2 depicts the experimental arrangement, comprising two microphones, a loudspeaker, and a frequency analysis system. Broadband random sound waves, emitted by the loudspeaker, traveled through the tube toward the securely held sample in a sample holder at the opposite end. Two fixed microphones positioned on the tube wall captured the reflected signals, which were then analyzed by a frequency analyzer to ascertain the normal incidence absorption coefficient. Data processing utilized BSWA VA-Lab4 Basic software. Before measurement, the microphones underwent calibration at a sound pressure level of 114 dB and a frequency of 1 kHz using the BSWA calibrator. Sound absorption coefficients were assessed across different frequency ranges using an impedance tube system with both large (100 mm) and small (30 mm) diameter tubes, covering low (63–1600 Hz) and high (1600–6300 Hz) frequencies. 19 During measurements, samples of various thicknesses and bulk densities were positioned in holders within the smaller and larger tubes. The sample’s position or the cavity behind it was adjusted using a rigid plunger. To ensure data reliability, each sample underwent a minimum of three separate sound absorption coefficient measurements, with the sample repositioned before each measurement to minimize misalignment errors. All experiments were conducted under controlled atmospheric conditions: temperature (20 ± 2)°C, relative humidity (45 ± 10)%, and a pressure of 1.01325 × 10⁵ Pa. These controlled conditions ensured consistency and precision throughout the sound absorption coefficient measurements.
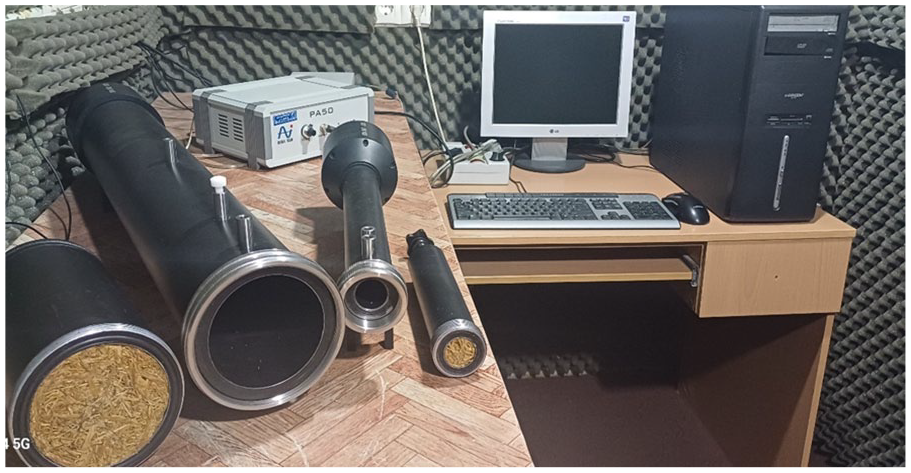
Experimental setup of impedance tube for acoustical measurement.
Results of sound absorption for the samples were presented using the SAA index under ASTM C423, 25 determined using the following formula:

Where
Measurement of physical properties
Thickness
Following ASTM D1037 standard specifications, cylindrical specimens of varying thicknesses were fabricated under uniform temperature and pressure conditions. 26 The thickness of each sample was determined by conducting three measurements at different points using a digital thickness gauge. The recorded thickness values for each sample are provided in Table 4.
Bulk density
The bulk density of the specimens was calculated by dividing their mass by their respective surface area. The resulting bulk density values are presented in Table 4.
Non-acoustical parameters measurement
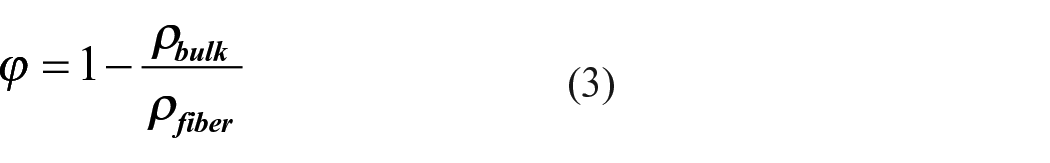
Porosity determination
Porosity (
Here,
Airflow resistivity measurement
The determination of AFR (

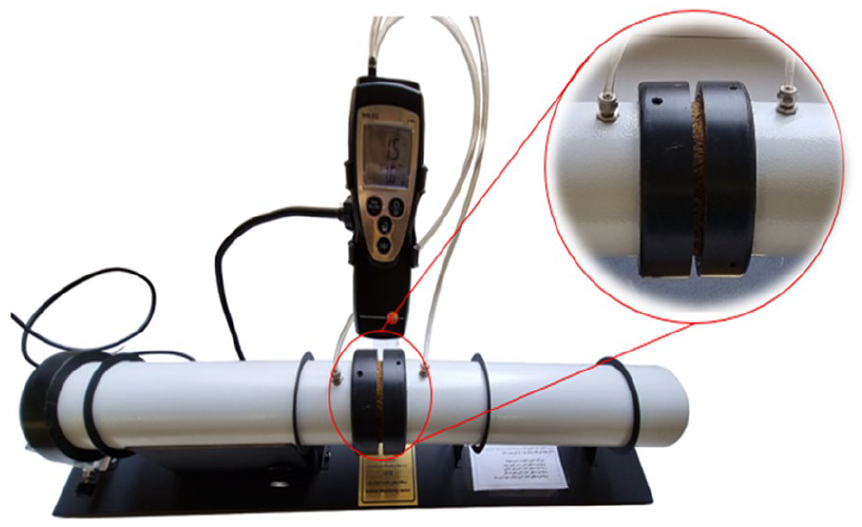
Experimental setup for air flow resistivity measurement.
Tortuosity (
) characteristic lengths
Tortuosity (
The notion of viscous characteristic lengths (
In this investigation, the parameters (
Morphological analysis
The specimens underwent morphological analysis using a field emission scanning electron microscopy (FESEM) instrument, specifically the Tescan Mira3, operating at 15.0 kV. In Figure 4, FESEM images of the bamboo fiber samples are depicted. Researchers developed MATLAB codes to assess the morphological characteristics, focusing on fiber diameter distribution (FDD) and in-plane fiber orientation (FOD) distribution. For the FDD assessment, 20 fibers were randomly selected from the samples, and their respective diameters were measured, providing insights into the distribution of fiber diameters within the samples.

FESEM image of bamboo fiber at the different magnifications.
Prediction of sound absorption using mathematical models
To predict the sound absorption of the samples, we utilized the empirical model proposed by DB along with the phenomenological model developed by JCA.
Delany and Bazley (DB) model
The DB model, initially designed for fibrous porous materials like glass wool with high porosity, is expressed as follows 28 :


where
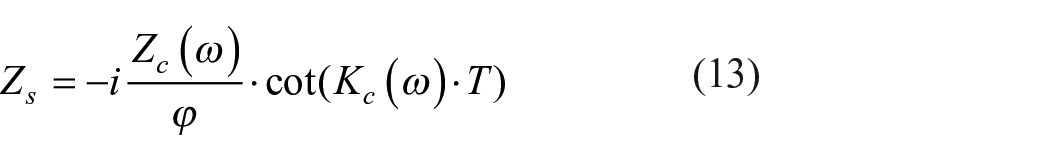
The surface impedance (

Using

It is noteworthy that the only essential parameter for SAC prediction in the DB model is the airflow resistivity.
Johnson-Champoux-Allard (JCA) model
While the DB model is tailored for specific fibrous sound absorbers, frequency ranges, and flow resistivity, the JCA model offers a more generalized approach to the propagation of acoustic waves in porous media across a broader frequency spectrum. Developed by Allard and Champoux, the JCA model builds upon the foundational research of Johnson et al.
29
This five-parameter model uses effective density


where


In the provided equations, the variables
Results and discussions
Response surface modeling
Statistical analysis and model fitting
The parameters examined to optimize the SAA through RSM included binder concentration, composite thickness and density, and fiber ratio (F:C). Statistical analysis of the results from 30 tests was conducted using Design Expert software to assess the significance of these parameters. Prediction of SAA was achieved using the quadratic model described in equation (14).

In equation (14), the variable Y represents the predicted SAA as the response. The constants 0.2646 and 1.17 serve as the offset terms and the Lambda coefficient, respectively, to normalize the results. The parameters A, B, C, and D denote the binder concentration, composite density and thickness, and fiber ratio (F:C), respectively.
Equation (14) illustrates the impact of various parameters on the SAA value, with some exerting a positive influence while others have a negative effect. Notably, among these parameters, the density and thickness of the composite exhibit the most significant impact on the SAA value. Figure 5(a) depicts the statistical model data compared to the experimental data. The positioning of the points relative to the diagonal line affirms the correlation between predicted and experimental data. The ANOVA statistical method relies on two assumptions: normal distribution of data and homogeneity of variance. Figure 5(b) presents the plot of normal probability against internally studentized residuals. The findings indicate that the residuals adhere to a normal distribution, with the majority of points nearly aligned along a straight line, thereby confirming the assumption of normal data distribution.

(a) Normal probability versus internally studentized residuals, (b) predicted versus actual data for SAA, (c) internally studentized residuals versus predicted, and (d) perturbation plot for SAA.
Figure 5(c) depicts the plot of internally studentized residuals against the predicted values, demonstrating that the interaction points are randomly scattered. Hence, the second assumption is also deemed valid. The results of the ANOVA test are summarized in Table 5. An F-value approximating 1 suggests no significant effect of the factor on the response, whereas higher F-values indicate increasing factor importance. A p-value of <0.05 indicates the model expression’s significance at the 95% confidence level. In the ANOVA table, the p-value of the model indicates significance with an R2 value of 0.95. Additionally, the p-value for lack of fit was not significant, affirming the model’s suitability.
ANOVA test for response surface models applied.

Model output and perturbation diagram
Figure 5(d) presents the perturbation diagram, facilitating a comparison of the effects of all design factors at a specific point within the design space. In this diagram, all design factors are positioned at the midpoint (indicated by a zero code). The steepness or curvature of a factor’s line indicates its sensitivity to changes, while a relatively flat line suggests insensitivity to alterations in that factor. As per the diagram, factors B, C, and A (representing thickness, density, and binder concentration, respectively) exhibit graphs with high and positive slopes, signifying their significant contribution to the sound absorption coefficient. Conversely, factor D displays a small slope, indicating its minimal effect on the sound absorption coefficient within the investigated range.
Optimized sample
One of the objectives of experimental design is to identify a set of optimal conditions that yield a desirable response. To optimize the structural parameters using Design Expert software, the independent variables—binder concentration, fiber ratio, thickness, and composite density—were examined within a specified range after validating the model. The dependent variable (response) was then set to maximum mode, and the optimal mode with the highest desirability was selected. In this study, a predicted SAA of 0.603 was achieved with a desirability of 1. To validate the model, a composite sample with optimal parameters was prepared, and its sound absorption coefficient was measured, as outlined in Table 6. The results demonstrated a strong agreement between the experimental SAA and the predicted values. Figure 6 shows the optimal values of the factors & responses in ramp plots generated by Design Expert®. This diagram was obtained after optimizing the model, reflecting the expected values of the various factors and responses of the model, as well as the desirability of the model. Desirability is a numerical value here, and the closer its value is to 1, the more reliable the model simulation result is. In this study As mentioned before, the desirability of the model is 1, indicating that the sound absorption model for predicting the acoustic behavior of composites is desirable.
Optimized composite panel conditions with predicted and experimental response values.


Ramp plots showing optimal values of factors & responses with desirability value 1.
Effects of structural parameters on SAA
The findings indicate a positive correlation between SAA and composite density, where an increase from 100 to 300 kg/m3 results in heightened SAA. This augmentation is attributed to the elevated number of fibers per unit area accompanying the density increase. Consequently, the heightened surface friction amplifies the energy dissipation of sound waves, thereby augmenting SAA.30,31 Conversely, lower densities tend to decrease AFR and tortuosity, potentially leading to a decline in the sound absorption coefficient. Furthermore, density increments can shift the peak of the sound absorption coefficient from the high-frequency range to the low-frequency range.
The findings revealed a rise in SAA with the augmentation of composite thickness from 10 to 50 mm. This increase can be attributed to the absorption phenomenon occurring within porous materials. With an increase in substrate thickness, a longer process of viscous dissipation and thermal conduction between air and absorbent materials ensues, leading to heightened SAA. Additionally, augmenting the porous bed’s thickness enhances absorption and shifts the absorption peak toward the low-frequency region. However, effective absorption is achieved when the absorber’s thickness is approximately one-tenth of the incident sound wavelength. The same results have been obtained in similar studies.32,33
This investigation also delved into the concentration of PVA binder, revealing that augmenting the binder concentration enhances both sound absorption and the mechanical resilience of the absorber. However, at a concentration of 5% w/v, the composite binder exhibited inadequate mechanical strength, while a concentration of 25% proved challenging to work with, resulting in pore blockage. Consequently, concentrations ranging from 15% to 20% demonstrated optimal strength. Notably, elevating the concentration to 20% within the same volume of binder bolstered sound absorption in the samples. This enhancement can be attributed to pore size reduction, subsequently amplifying twisting and flow resistivity. 19
Comparison of experimental and modeling results
Figure 7 shows the comparison between experimental data and modeling results. As illustrated, the JCA model exhibits superior accuracy when compared to the DB model. Furthermore, the JCA model not only successfully estimates the sound absorption behavior trend of the material but also provides more precise estimations for the absorption peak of the sample, as well as the values of NRC and SAA. The JCA model exhibited error rates

Comparison between experimental and modeling results.
Physical properties of optimum sample.

The limitation of modeling up to a frequency of 2500 Hz is due to the observed discrepancy between the two models and impedance tube results at frequencies beyond 2500 Hz. Additionally, the choice to focus on this frequency range is rationalized by the recognition that these sound absorbers are better suited for indoor settings, such as homes and offices, where the critical frequencies typically fall within the range of 500–1500 Hz, encompassing speech frequencies. In other investigations, the JCA model’s exceptional accuracy has been acknowledged.1,30,36,37
The comparison of the SAC values of the prepared samples with those found in the existing literature is illustrated in Figure 8. All graphs pertain to absorbers with a thickness of 40 mm (while the glass fiber absorbers had a thickness of 30 mm). The sound absorption rate for the composite under investigation at frequencies below 630 Hz (with an average absorption of 0.28) is comparable to that of other natural and synthetic materials. However, in this frequency range, mineral wool and hemp exhibited slightly better absorption. In contrast, at frequencies between 630 and 1000 Hz, the current composite demonstrated superior absorption (average absorption of 0.86) compared to other materials. Furthermore, Figure 8 indicates that bamboo fibers show a decrease in sound absorption within the range of 1000–2500 Hz. This reduction can be attributed to the rigid nature of bamboo fibers in comparison to other natural fibers. As can be seen, bamboo bio composite as an innovative and sustainable building material offers competitive performance in terms of acoustic properties compared to its natural fiber counterparts.

Conclusion
The findings of this study indicate that bamboo composite holds promise as an environmentally friendly and cost-effective material for noise control in indoor environments. The research employed RSM-CCD to optimize the sound absorption of bamboo composite by varying four structural parameters: binder concentration (5%–25% w/v), thickness (10–50 mm), density (100–300 kg/m3) of the composite, and F:C ratio (20:80–80:20). A second-order model expressing SAA as a function of the aforementioned variables was developed using the least square method via Design Expert software. Statistical analysis, specifically Analysis of Variance (ANOVA), was conducted to assess the individual effects of the variables and their combined interactions on the SAA levels. The study yielded several key findings, including:
With an increase in binder concentration, F:C ratio, and thickness and density of the composite, there was a concurrent elevation in the sound absorption coefficient within the low-frequency range, leading to an enhancement in the SAA.
The increase in SAA can be attributed to the reduction in average pore size and an increase in AFR and tortuosity.
The optimal configuration for the composite was determined to be 40 mm thick, with a density of 250 kg/m3, a binder concentration of 20% W/V, and an F:C ratio of 65:35, resulting in the highest SAA.
Modeling results indicated that the JCA model outperforms the DB model in accurately estimating the acoustic behavior of the optimal sample.
Bamboo composite demonstrates suitability as a sound absorber for indoor environments.
Due to cost limitations in the current research, the mechanical resistance, thermal stability, and water repellency of bamboo biocomposites were not investigated. Given the significance of these factors—particularly for the commercialization and practical application of these fibers in diverse environments—it is suggested that future studies address these issues. This will help ensure that composites based on natural fibers can become a reliable and sustainable alternative to synthetic materials. To enhance sound absorption at low frequencies, it is suggested that future studies investigate the combination of absorbers with micro-perforated plates (MPPs). This combination could particularly improve the esthetic aspects of MPPs while also serving as a decorative final layer. Additionally, utilizing back cavities and metamaterial absorbers within these cavities may contribute to improved absorption performance at low frequencies and also serve as a suitable support for the installation of these composites.
Footnotes
Acknowledgements
We would like to express our gratitude to Tarbiat Modares University for providing the necessary laboratory facilities and financial support.
Author Contributions/CRediT
Hassan Irvani: Conceptualization, Methodology, Software, Analysis and validation of data, Writing, Hassan Asilian Mahabadi: Conceptualization, Methodology, Writing, review, and editing, Ali Khavanin: Conceptualization, Methodology, Writing, review, and editing, Ali Safari Variani: Conceptualization, Methodology, Writing, review, and editing. Mohammad Javad SheikhMozafari: Writing, Software Analysis, and validation of data.
Funding
The author(s) disclosed receipt of the following financial support for the research, authorship, and/or publication of this article: This research is derived from the doctoral thesis of the first author, supported by Grant 35090610 at Tarbiat Modarres University.
Conflicting interests
The author(s) declared no potential conflicts of interest with respect to the research, authorship, and/or publication of this article.
Data availability
Data is available upon request.