
Abstract
Low-frequency noise pollution in substations has a significant impact on the physical and mental health of workers. Reduction low-frequency noise pollution is an urgent problem to solve for researchers. In this paper, the different structures of Al2O3-polyurethane composites and micro-perforated plate were constructed, and the effects of cavity depth, perforated plate, and foam position on sound absorption properties were comprehensively investigated. The results showed that the position of perforated plate and the arrangement of resonance structure were the two most important factors affecting sound absorption performance. When the sound wave passed through the plexiglass plate–cavity–composites foam–perforated plate in turn, the peak position of sound absorption coefficient was located in the ultra-low frequency range. Meantime, the simulation study showed that the friction between the air column and the cavity wall in the perforated plate can consume sound energy to achieve sound absorption.
Keywords
Introduction
In substations, low-frequency noise pollution is serious, affecting people’s physical and mental health.1–4 Thus, reduction low-frequency noise is particularly important. Single structure, such as porous foam or resonant structure, has relatively low-frequency sound absorption performance. In order to solve this problem, the sound absorption performance can be further improved by compounding other materials or optimizing the resonant structure design.
At present, the sound absorption performance can be improved mainly through the following methods. Jiang et al. 5 combined barium titanate/nitrile rubber (BT/NBR) and PU foam to prepare a sound-absorbing material with an alternating multilayer structure, and studied the effects of cell size and alternating unit number on the sound-absorbing properties of the material. Yu et al. 6 prepared PU/316L stainless steel hollow ball and silicone rubber/316 L stainless steel hollow ball composites by casting. It was found that when hollow metal spheres were added, the sound transmission loss of polyurethane composites and silicone rubber composites increased. Zhao et al. 7 studied the loss mechanism of two different pores and designed a double porous material composed of two types of pores. Khanouki et al. 8 studied the influence of SiO2 nano-particle size on the acoustic damping of PU foam. In addition to the composite modification of materials, the resonant structure can also be designed to optimize the sound absorption performance. Fan et al. 9 had designed a new sound absorption structure with aluminum fiber material as the internal structure, micro-plate as the external structure, and polyester filled in the middle, which had a good sound absorption performance for low-frequency and full-frequency noise. Jin et al. 10 proposed a new composite acoustic structure composed of periodic multi-resonators and holes, in which periodic multi-resonators and periodic holes were embedded in sound absorption layer and sound insulation layer, respectively. Gai et al. 11 studied the sound absorption capacity of micro perforated plate (MPP). Wang et al. 12 designed a composite structure filled with particle aerogel in Helmholtz resonators (HRS). The above research results5–12 had improved the sound absorption performance, but it was still needed to further research in the ultra-low frequency range (<200 Hz).
In our previous work, 13 Al2O3-PU composite was prepared and its sound absorption performance was improved. Meantime, based on microscopic single-hole model, the loss factor was calculated through investigation the sound energy storage and sound energy dissipation process. However, the sound absorption coefficient of Al2O3-PU composite was relatively low in the low-frequency range. In order to further improve its sound absorption coefficient, the resonant structure of Al2O3-PU composite materials and micro-perforated plates was constructed in this paper. The sound absorption characteristics of the resonant structure were studied through experimental and theoretical.
Experiment
Raw materials
In the research, the epoxy resin was 6002 bisphenol A liquid epoxy resin, and the epoxy curing was 572 from Shanghai Resin Factory Co., Ltd.
Sample preparation
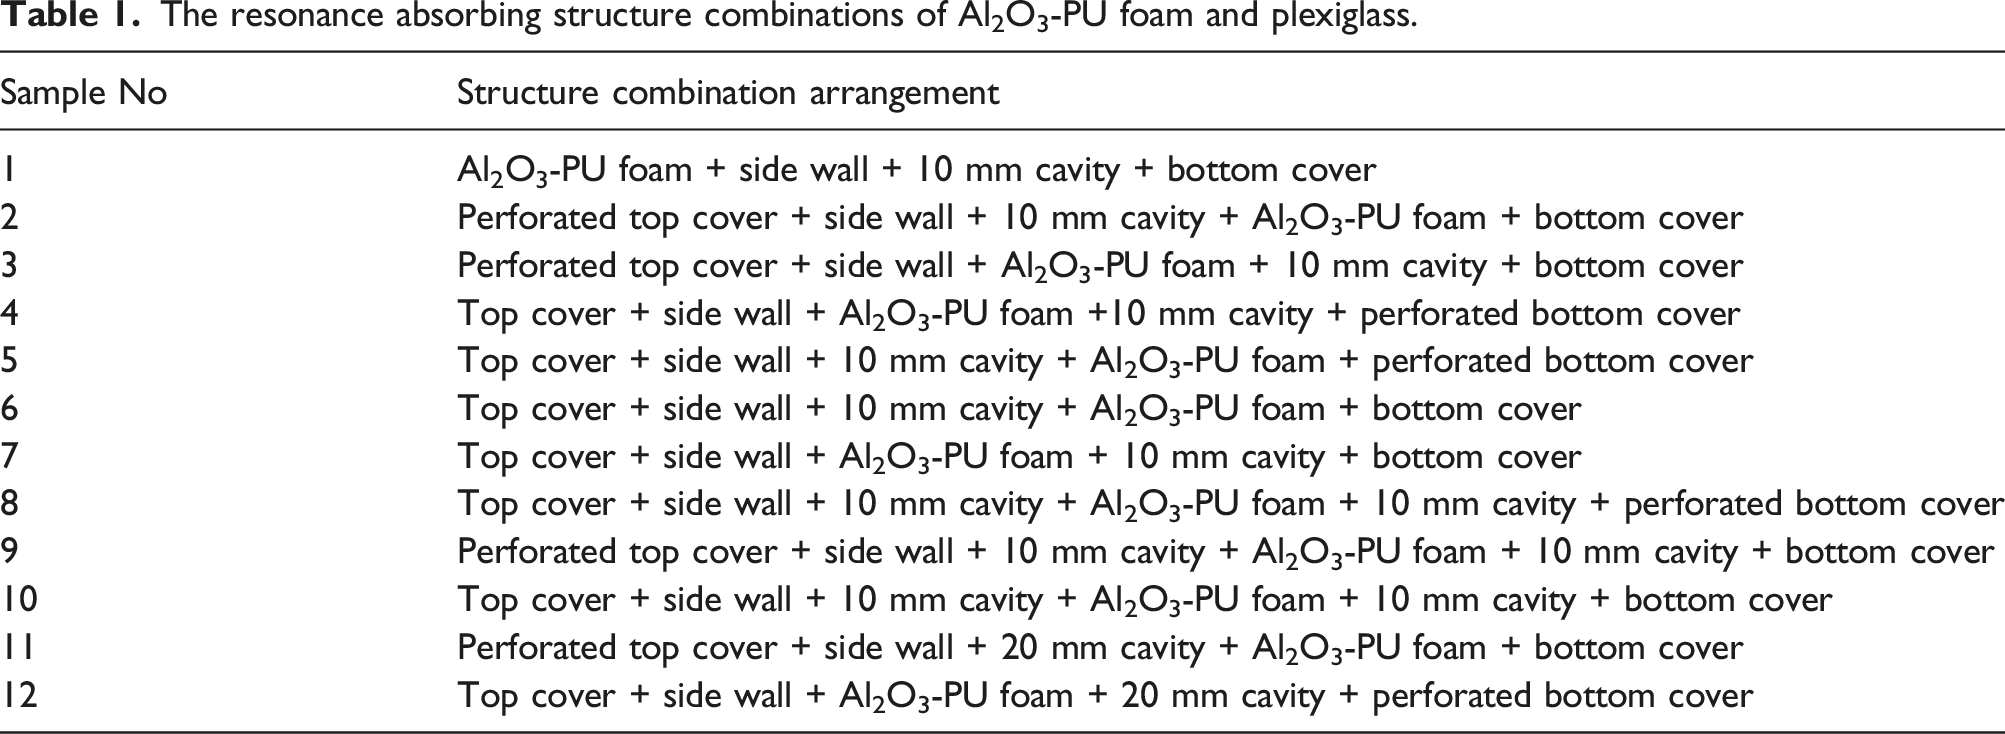
The resonance absorbing structure combinations of Al2O3-PU foam and plexiglass.
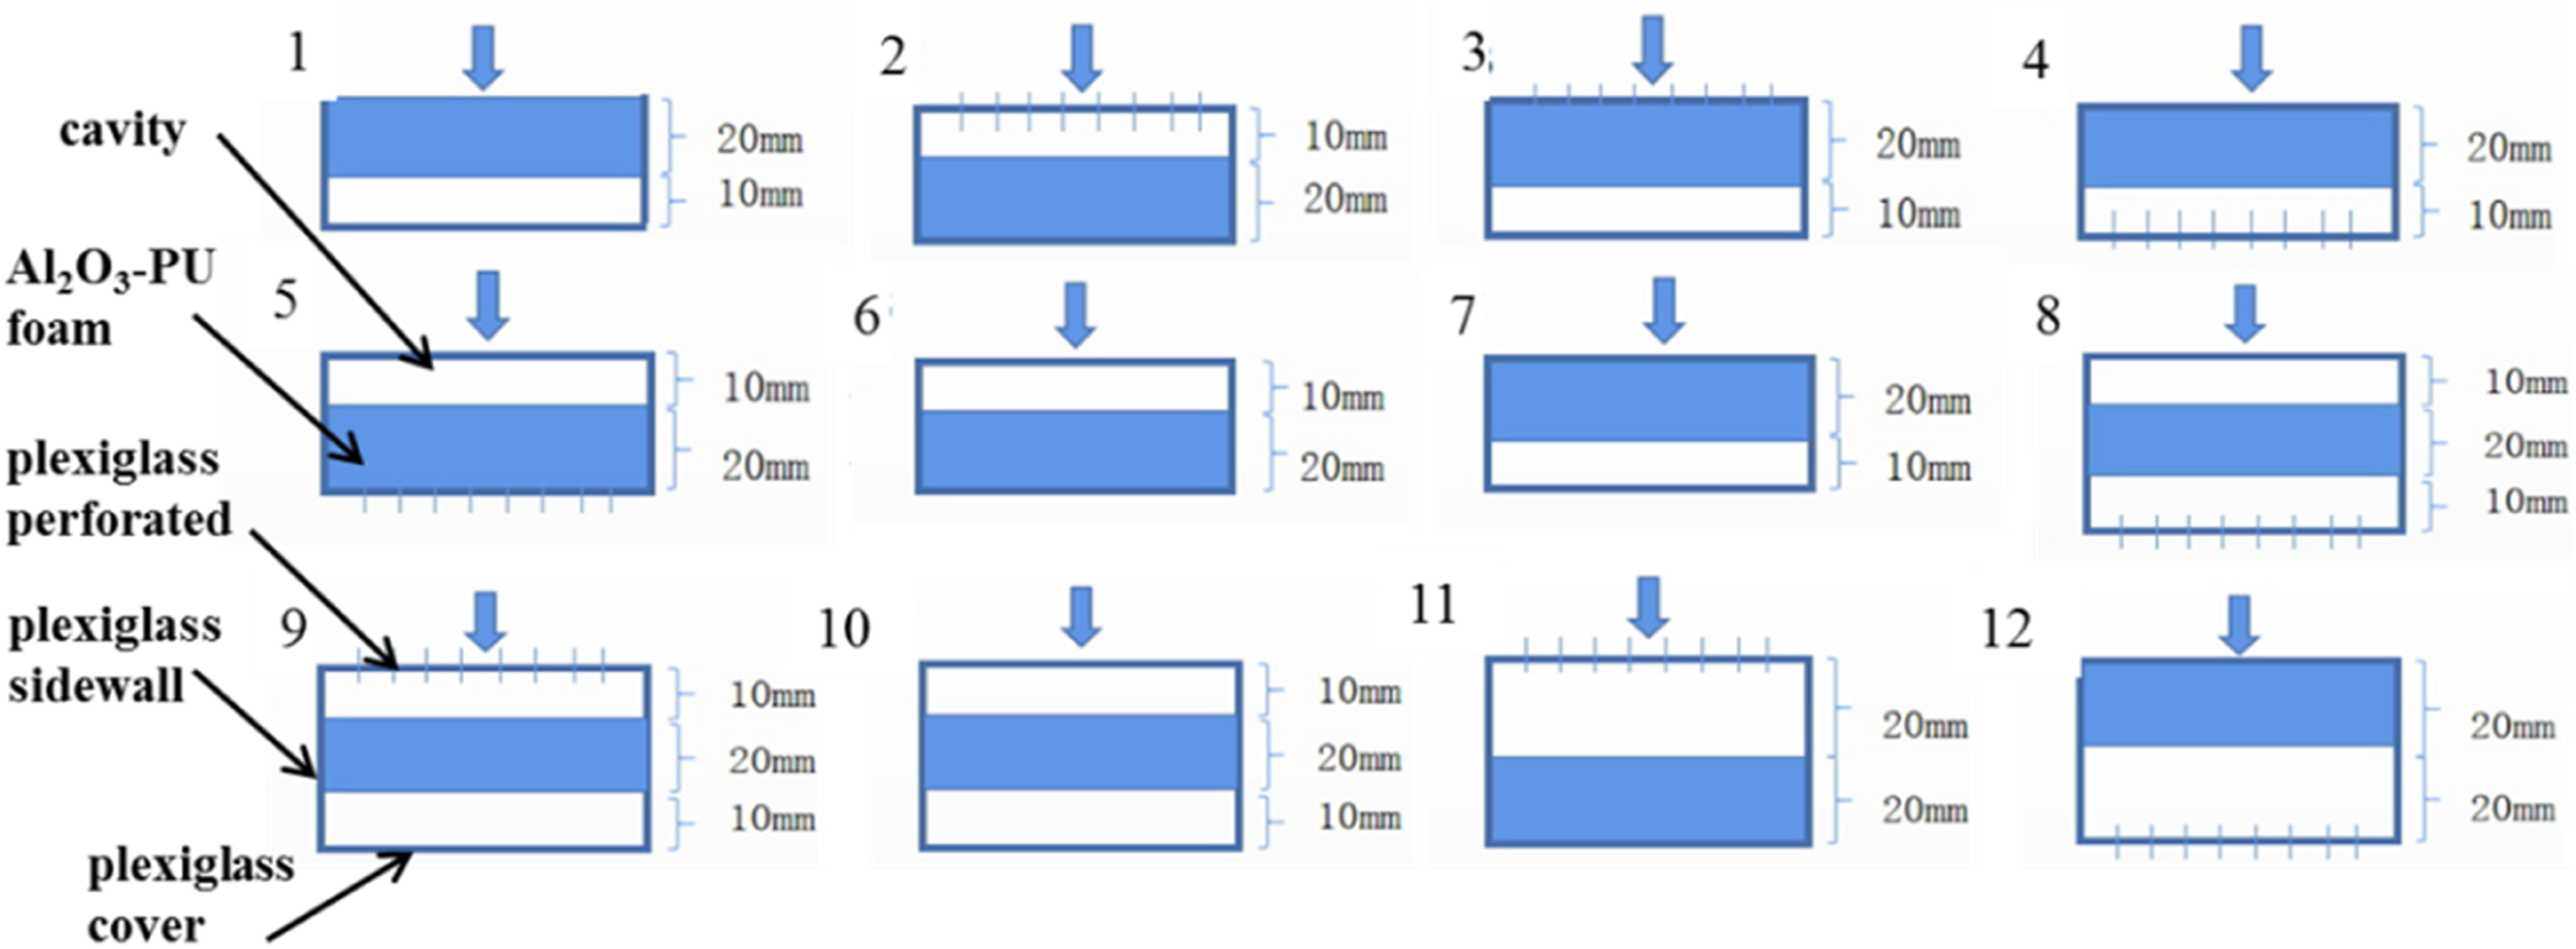
Schematic diagram of absorption structure of all samples.
Test instruments
Sound absorption coefficient was explored by B&K 4206 impedance tube. The tested frequency range was 50 Hz–1250 Hz. In addition, the test and analysis software was commercial software and came from the manufacturer of the impedance tube. The American MacPritice AutoPore Iv 9510 mercury porosimeter was used to measure and analyze the porosity of foam.
Modeling method
In the paper, ANSYS Workbench used to establish the finite element model of the impedance tube. The model size was the same as that of the experimental sample to compare the theoretical simulation value with the practical value. The Johnson–Champoux–Allard (JCA) model was used. The finite element model was shown in Figure 2. An impedance tube model with a length of 500 mm and a diameter of 100 mm was established. The left side was the sound source entry side, and the unit plane sound pressure and unit volume velocity boundary conditions were applied to the sound source end. The tube wall and the end of the impedance tube were rigid walls. The air part of the pipe was endowed with air characteristics, and the sound-absorbing material part was endowed with Al2O3-PU porous foam properties. The parameters of Al2O3-PU foam were as follows: porosity 0.704, flow resistance 70,000 N·s·m−4, tortuosity factor 1.34, viscosity characteristic length, 1.99 × 10⁻⁵ m, thermal characteristic length 4.64·10−5 m.13,14 A perfect matching layer was applied to the left air region. And each small hole of the regular plexiglass circular plate was filled with an air column. Through the standing wave ratio method, the sound absorption coefficients were calculated by extracting the maximum and minimum values of sound pressure at different frequencies. The finite element model: (a) sample 3, (b) sample 4.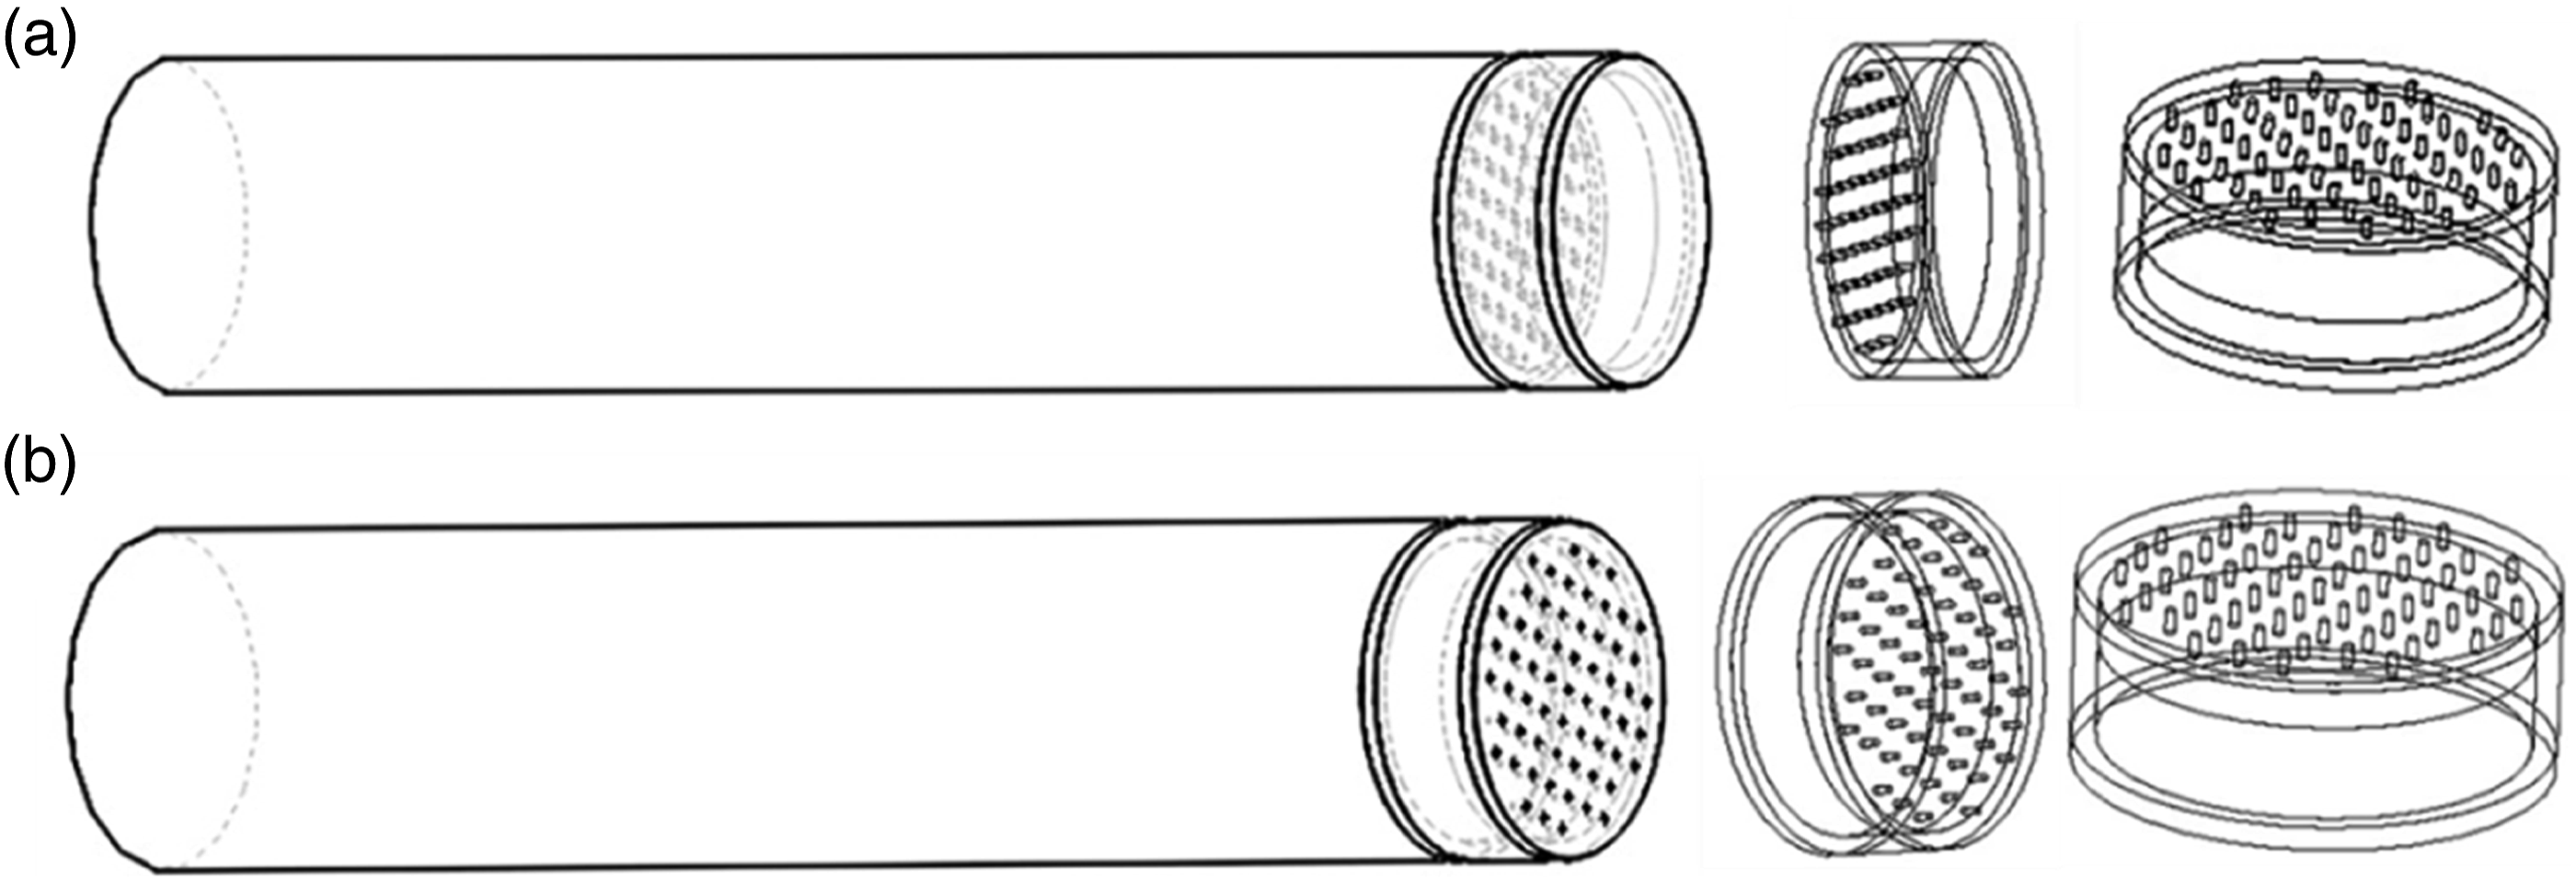
Theory of sound absorption
In this article, the JCA modal was selected as the theoretical model of porous materials. In the model, it contained five basic acoustic parameters: flow resistance, porosity, tortuosity factor, viscous characteristic length, and thermal characteristic length of porous materials. The dynamic density 
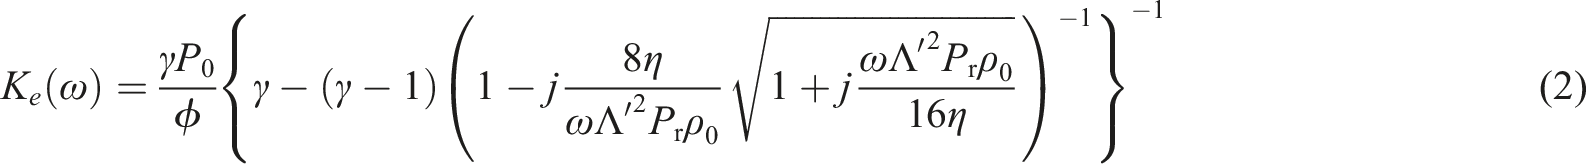
The viscosity characteristic length 
Based on the equivalent fluid theory, the characteristic acoustic impedance 
The formula of surface acoustic impedance of porous materials with the rigid walls, as the title is shown in
Thus, the calculation formula of the average sound absorption coefficient 
Results and discussion
All samples in Table 1 and Figure 1 were tested for low-frequency sound absorption performance, as shown in Figure 3. In sample 1, a 10 mm cavity was directly added behind the Al2O3-PU foam material. Compared with the author’s previous paper, the sound absorption coefficient ( Sound absorption coefficient curves of different structures.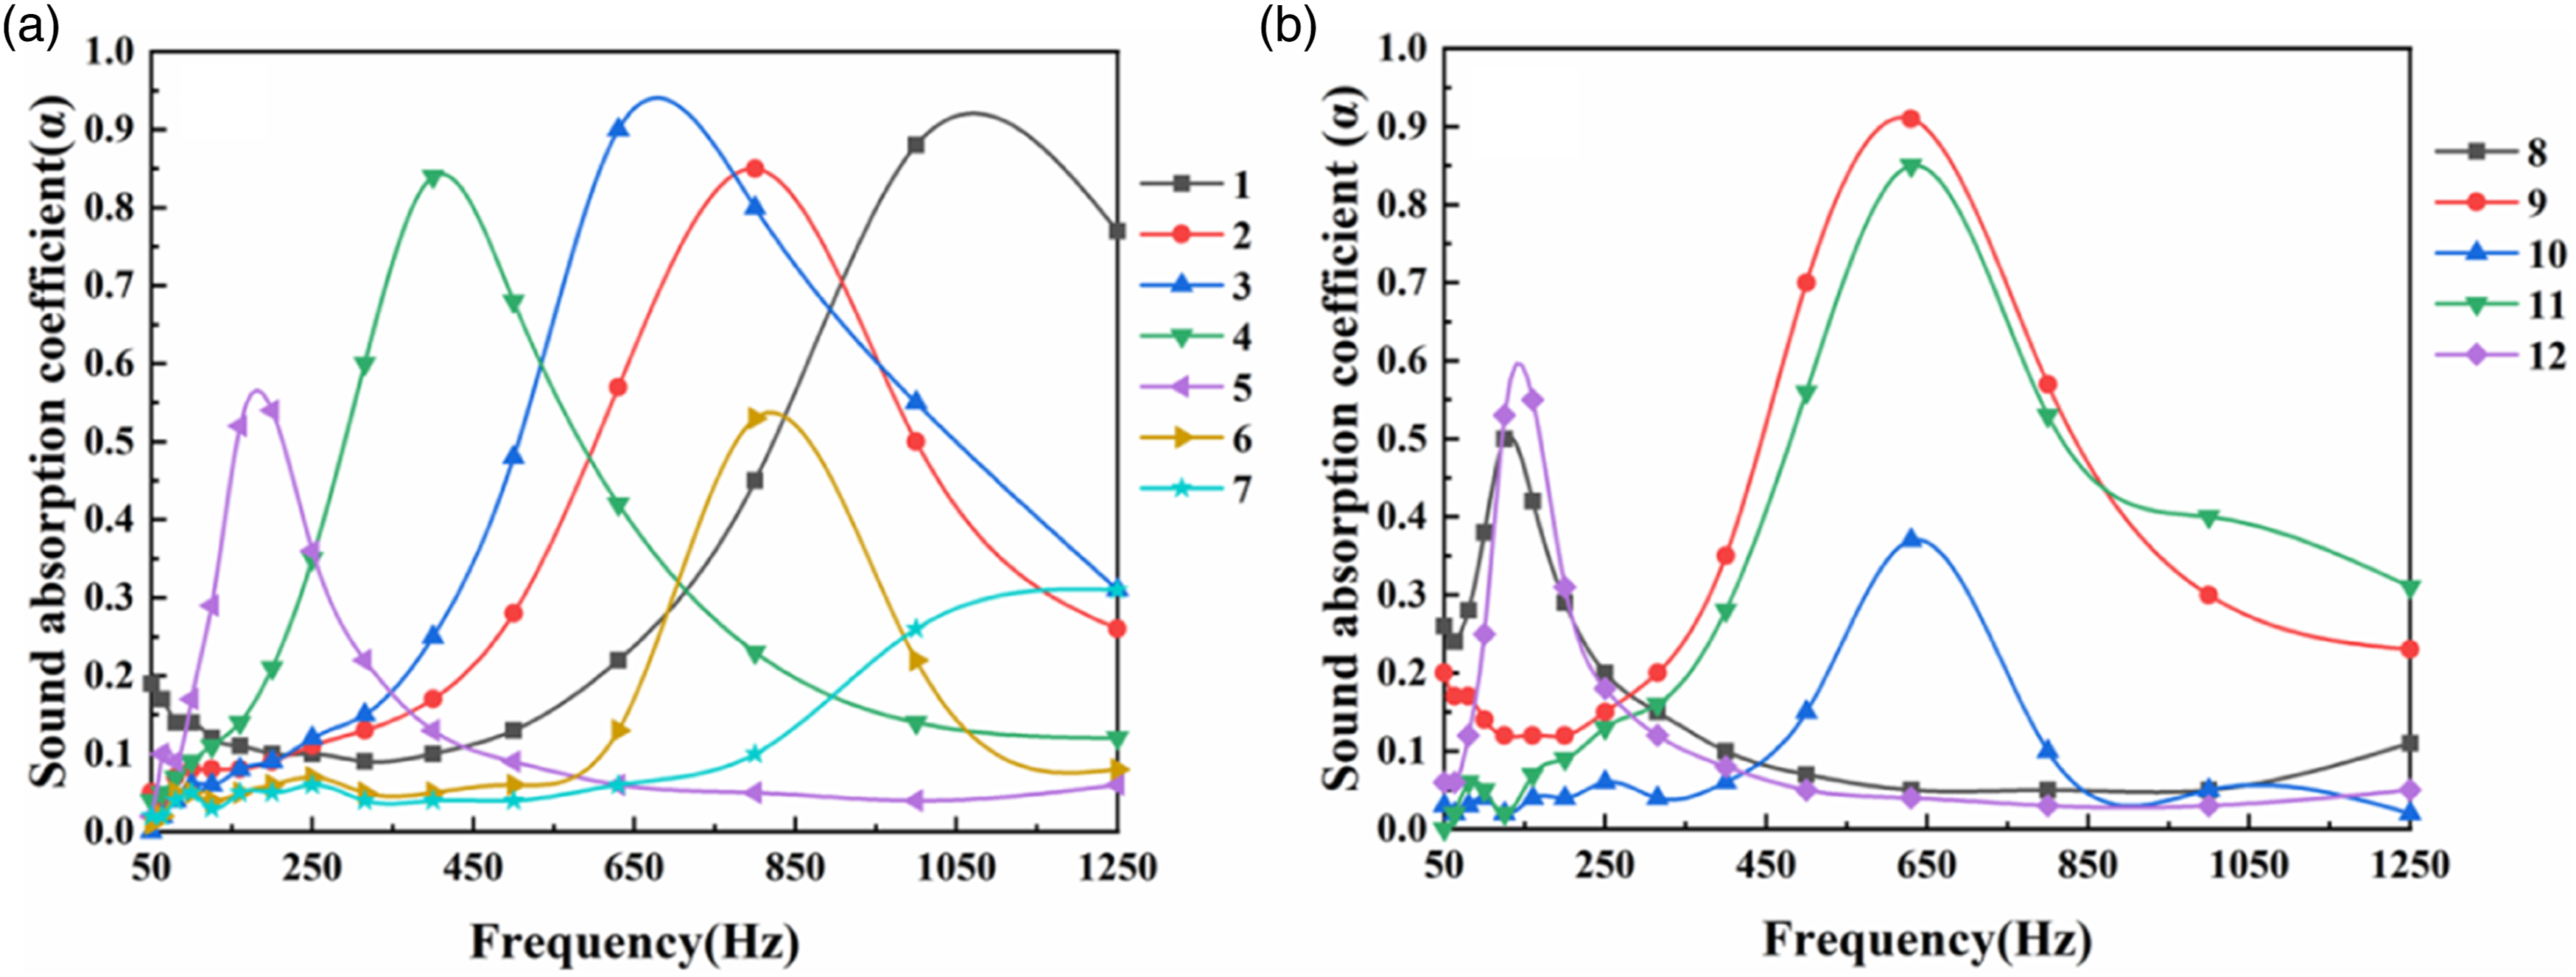
From Figure 3(b), when the cavity depth increased from 10 mm to 20 mm, the overall sound absorption curves were the same. For sample 10, the peak position of sound absorption coefficient was located at 626 Hz, but the peak value of sample 10 was relatively low at only 0.37. According to the structural analysis, it can be seen that sample 10 was a combination with samples 6 and 7, and the sound absorption result was similar to that of the 10 mm cavity without a perforated plate, which further indicated that the structure without a perforated plate didn’t significantly improve the sound absorption performance. For samples No. 9 and No. 11, the peak positions of sound absorption coefficient were basically the same at 626 Hz. Meantime, the difference with the peak value was not significant for 0.91 and 0.85, respectively. Thus, the increased cavity thickness can make the sound absorption curve moved a little towards low frequency, but can’t further improve the peak sound absorption coefficient. For samples 8 and 12, the peak position of sound absorption coefficients were located at about 144 Hz and 149 Hz, and the peak values were 0.5 and 0.6, respectively. The above results indicated that it was beneficial to improving the ultra-low frequency sound absorption performance when the sound waves entered vertically from the side without holes. Meantime, the direct contact arrangement between Al2O3-PU foam and plexiglass had a better low-frequency sound absorption performance. Thus, the perforated plate and entry position of the sound source were the two most important factors affecting the sound absorption performance.
In order to further clarify the sound absorption effect of a perforated plate, the sound pressure of perforated plates was investigated. Figure 4 was the sound pressure diagram of perforated plat. The sound pressure diagrams at five frequency points of 250, 500, 750, 1000, and 1250 Hz were obtained for analysis. It can be seen that with the increase of frequency, the sound pressure of the air column in the hole of the perforated cover had experienced a process of first decreasing and then increasing. Meantime, the sound pressure of the contact part between the air column and plexiglass was slightly greater than that of the air column. The air column in the perforated plate vibrated. In the process of vibration, the friction between the air column and the hole wall consumed sound energy to achieve the effect of sound absorption. Sound pressure diagram of perforated plate surface (Unit: Pa).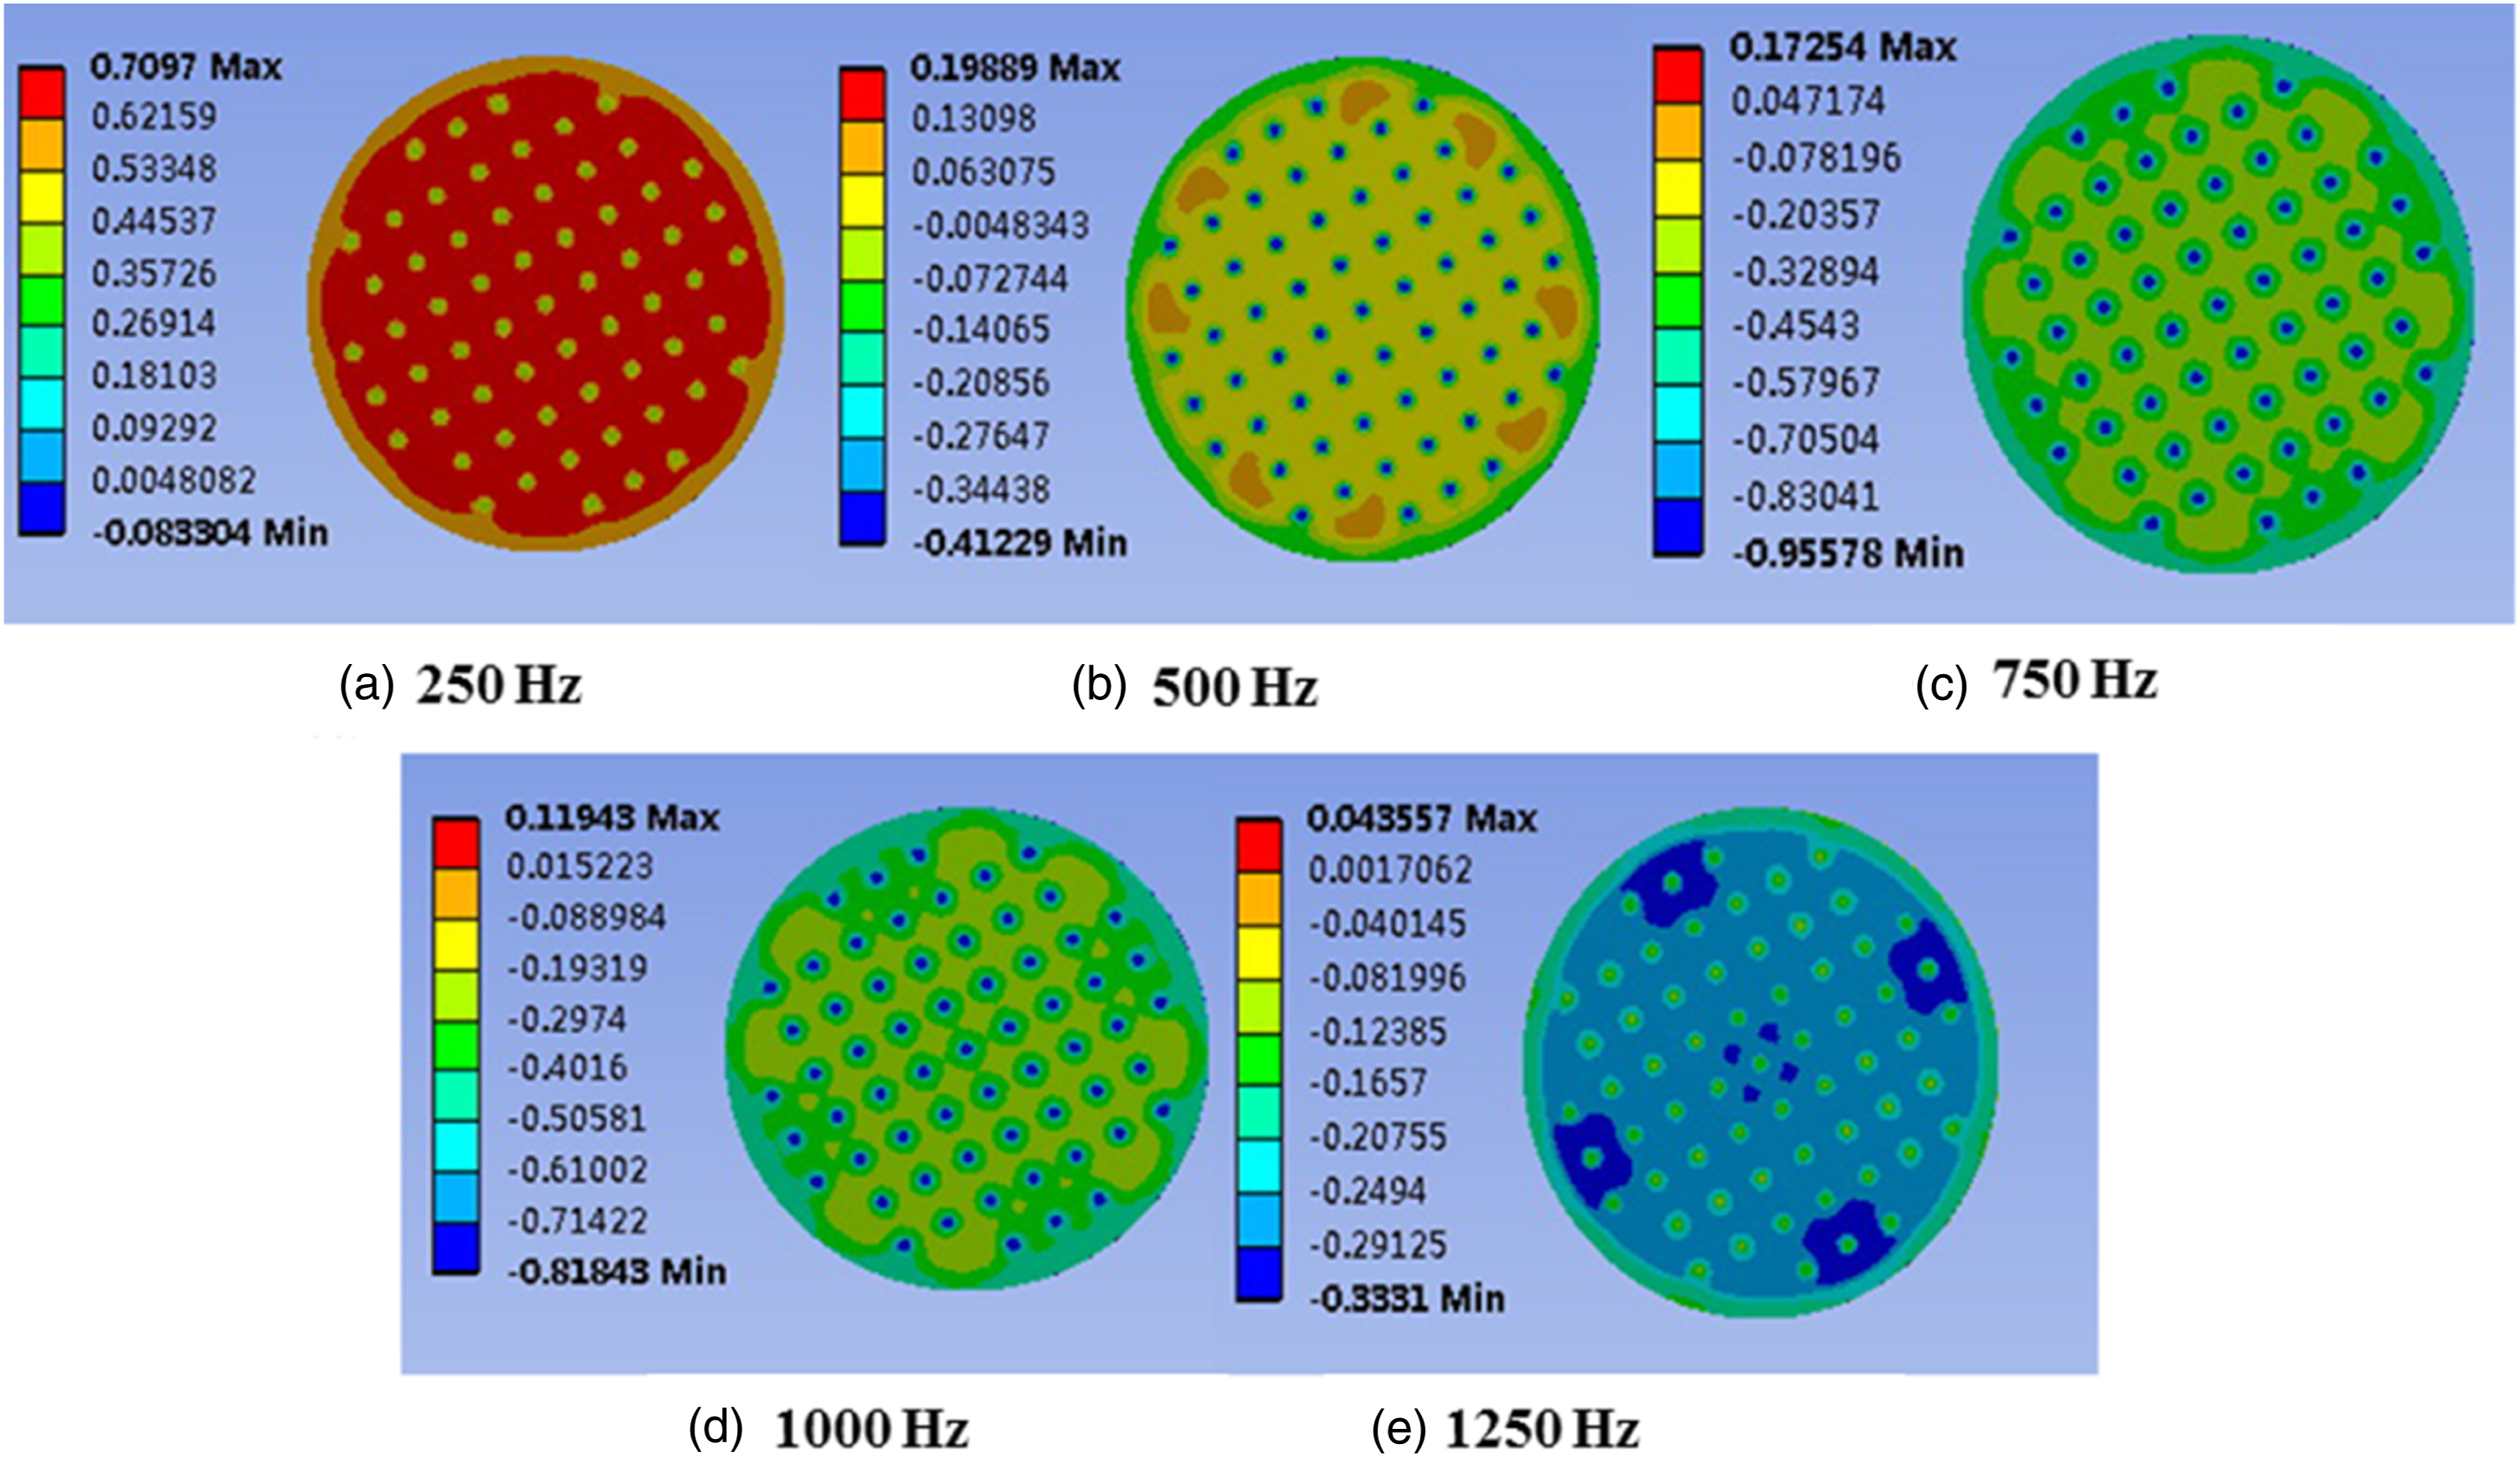
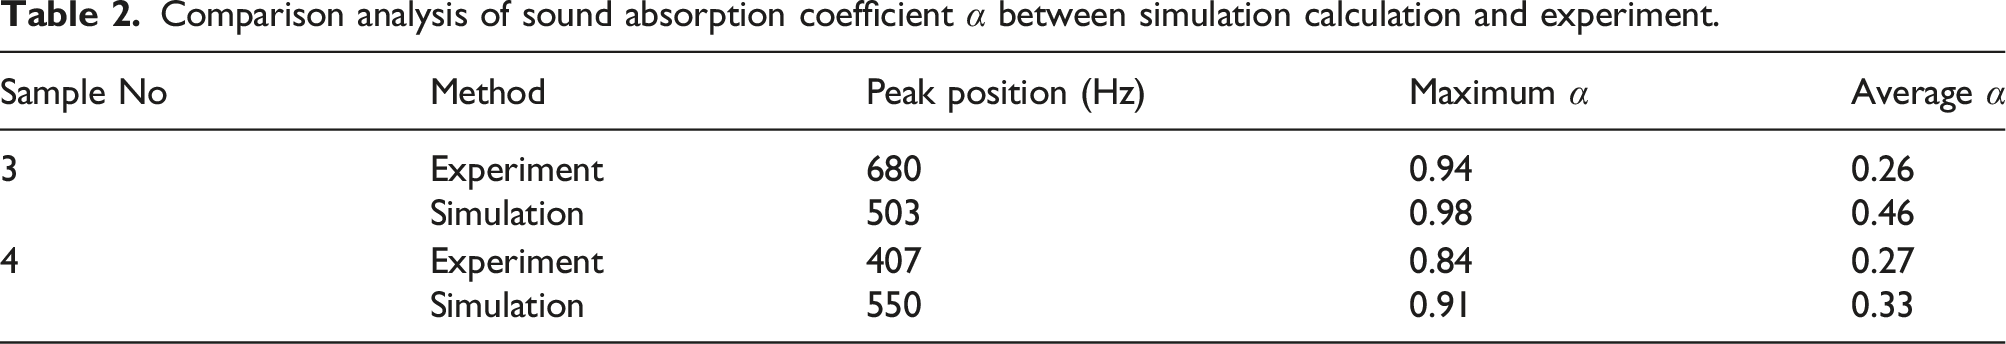
In the paper, it took sample 3 and sample 4 with a 10 mm cavity as an example to simulate the sound absorption performance, as shown in Figure 5. It can be seen that in the whole frequency range, the variation trend of the calculated value and the sound absorption coefficient measured by the impedance tube experiment was the same. It showed a trend of rising to the highest point first and then declining, which also conformed to the general law of resonance sound absorption structure. Its sound absorption characteristic was the sound absorption characteristic of the highest point, that is, the sound absorption coefficient reached the maximum at a certain frequency point, and once it leaved the frequency point, the sound absorption coefficient decreased. Comparison diagram of sound absorption coefficient between simulation calculation and experiment (a) sample 3, (b) sample 4.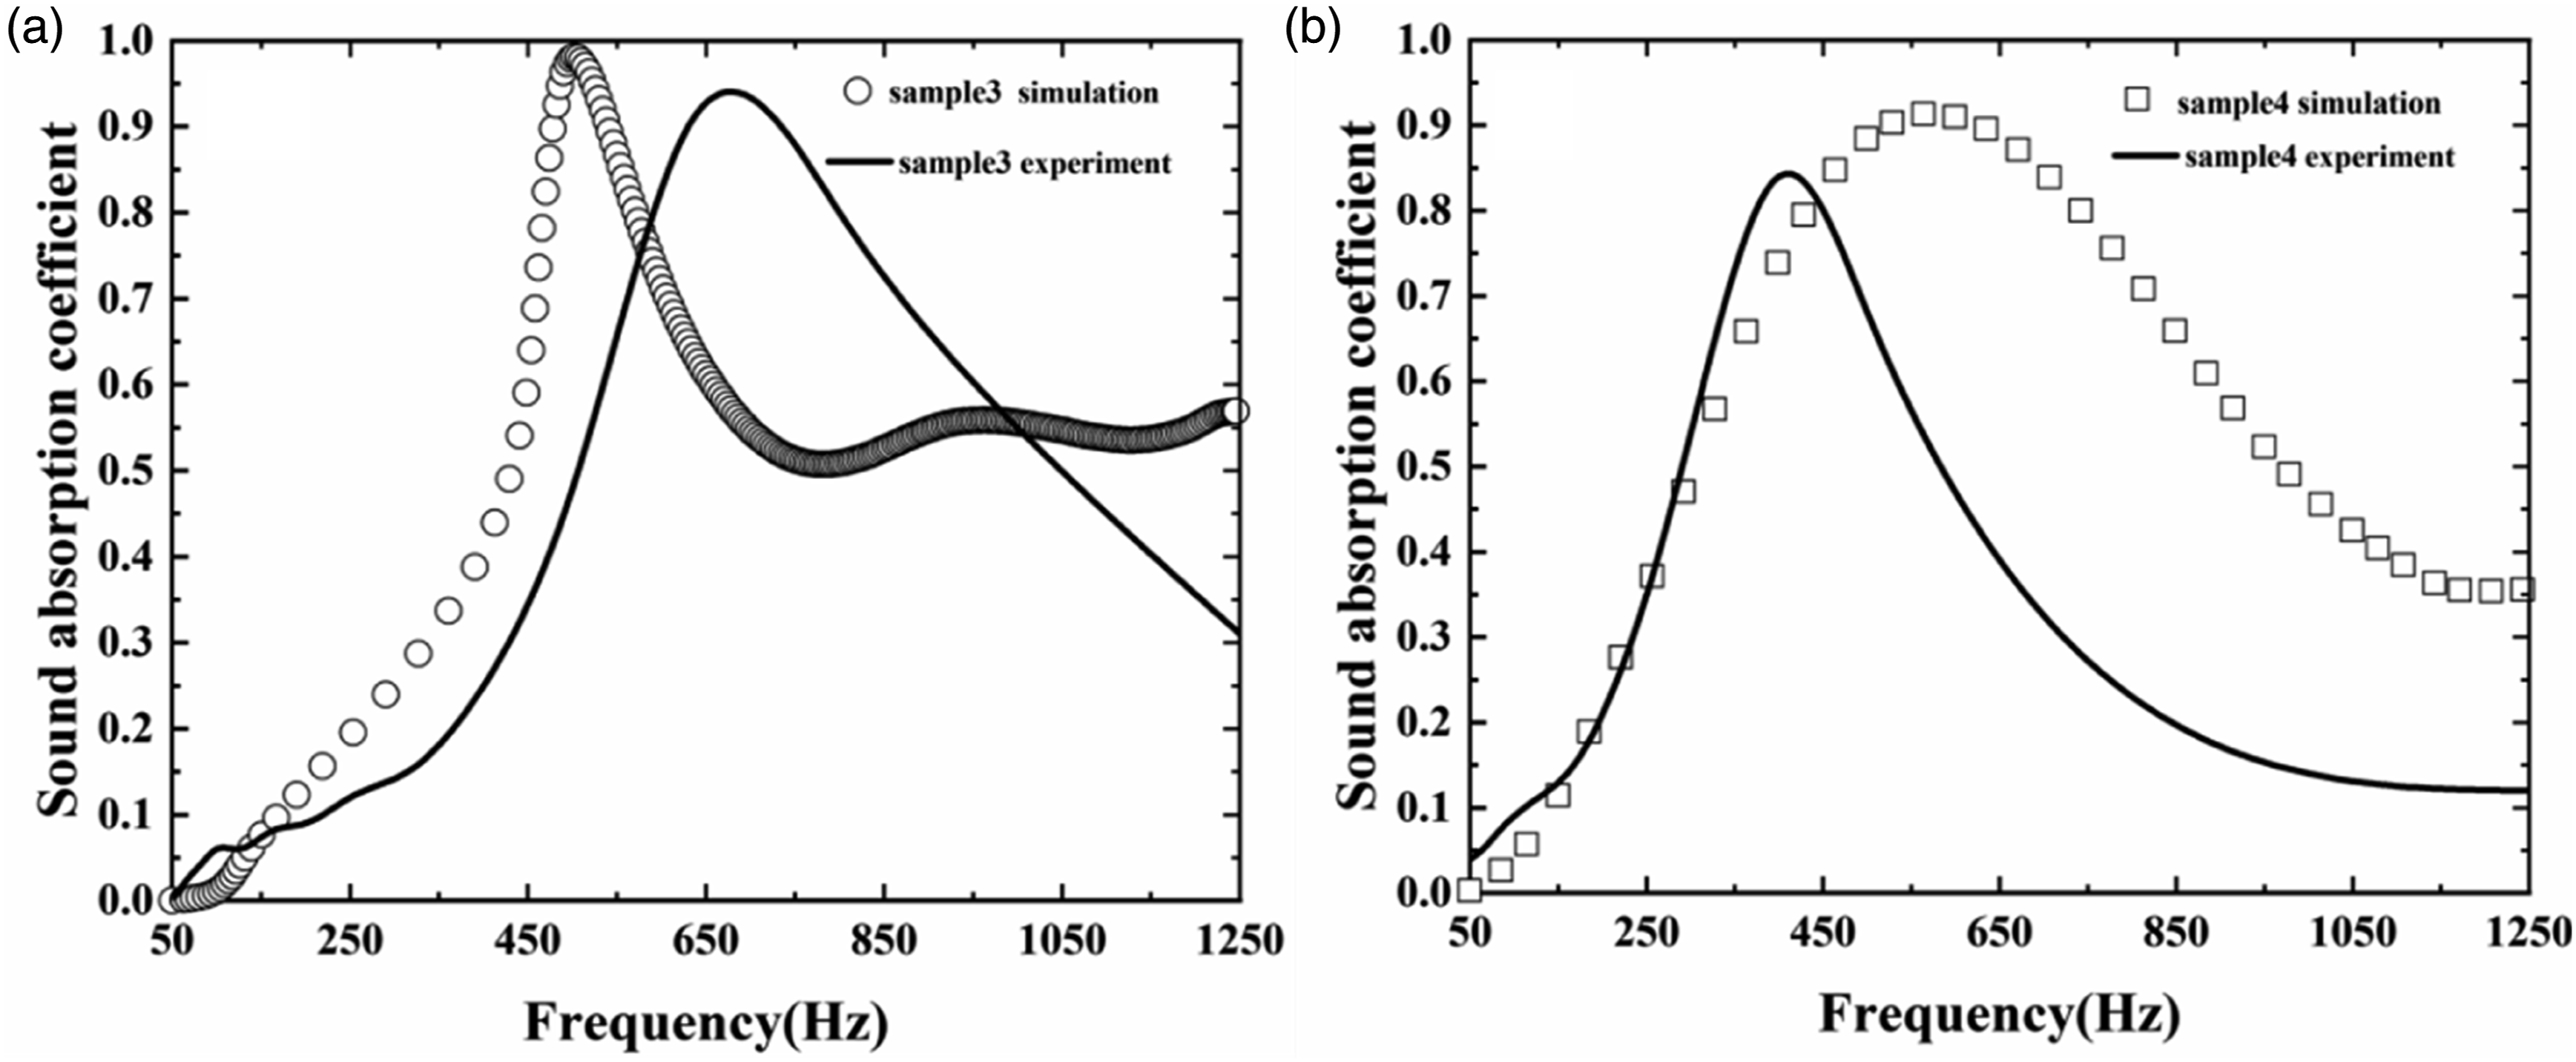
Comparison analysis of sound absorption coefficient
Conclusion
In this paper, the composite resonance structures of Al2O3-PU composite and micro-perforated plate were constructed. By changing the depth of the cavity, the arrangement of perforated plate and foam, the incidence direction of sound waves, the sound absorption performance of different resonance structures were comprehensively investigated. When there was no micro-perforated plate in the resonant structure (sample 6 and 10), the maximum values of the sound absorption coefficient were 0.55 and 0.37 on the low side. It indicated that the micro-perforated plate directly affected the sound absorption coefficient. In the resonant structure with perforated plates and Al2O3-PU foam, when sound waves entered from perforated plates (sample 2, 3, 9, and 11), the peak positions of sound absorption coefficient were 626 Hz–800 Hz; when sound waves entered from non-perforated plates (sample 4, 5, 8, and 12), the peak positions of sound absorption coefficient were 408, 180, 144, and 149 Hz, respectively. Thus, the sound waves entering from non-perforated plates were more likely to resonate at lower frequencies. In addition, increasing the cavity depth can also shift the peak position of the sound absorption coefficient to the left. Finally, the simulation study showed that the friction between the air column and the hole wall in perforated plate can consume sound energy to achieve sound absorption. There was still a certain gap between the simulation results and the experimental results, which needed to be further discussed in the follow-up research.
Footnotes
Declaration of Conflicting Interests
The author(s) declared no potential conflicts of interest with respect to the research, authorship, and/or publication of this article.
Funding
The author(s) disclosed receipt of the following financial support for the research, authorship, and/or publication of this article: This work was supported by the financial supports from the Open Fund of State Key Laboratory of Power Grid Environmental Protection (GYW51202201409).
Data availability
All data in the study can be obtained from the first author and corresponding author (YUAN Binxia and CAO Lan).