
Abstract
GPS-guided parachutes are used by the military to deliver supplies to personnel in the field. During descent, the suspension lines can vibrate as a result of vortex shedding and oscillating aerodynamic forces. In addition to challenging the targeting accuracy, these vibrations can generate sound that can compromise silent entry operations. The availability of a fundamental understanding of the relationship between braid architecture and associated vibrations would provide insight on how changes in the design of suspension lines could mitigate these vibrations. In the current research, the torsional and transverse stiffnesses of a braided parachute suspension line are characterized as a function of the state of tension. The torsional behavior is investigated using static and dynamic torsion tests, and the transverse behavior is studied using a pluck test. The torsional and transverse stiffnesses are found to increase with increasing tension on the suspension line. The effective transverse stiffness is found to correlate to that which can be derived from the vibrating string under tension equation. These stiffness properties can be used as inputs for fluid-structure-interaction (FSI) models to develop a calibrated FSI simulation to investigate the role that the mechanical behavior of the suspension line plays in its flow-induced vibrational response.
Introduction
Parachutes are used by the military to deliver supplies and large equipment to personnel in the field. The gliding decelerator systems are typically comprised of a canopy (ripstop fabric), suspension lines (polyester braided cords), a payload, and an autonomous GPS-guidance system to steer the package to a defined target. 1 During descent, the suspension lines can exhibit flow-induced vibrations, specifically vortex-induced vibrations (VIV) and gallop as a consequence of vortex shedding and oscillating aerodynamic forces. These vibrations can generate an audible sound that can be heard for several kilometers and thereby compromise the silent entry. The vibrating lines also increase the drag on the parachute thereby degrading the overall flight performance and adversely affecting the ability for the payload to land on the predefined target. A good understanding of the mechanical behaviors of these braided cords could be used to guide their design and thereby mitigate these compromising and parasitic vibrations. The service-condition mechanical behaviors of ropes have been well studied for marine and civil applications. There have been some studies on their use in parachute systems; however, there are not many, and the few studies for parachute suspension lines that have been conducted have not investigated how the tensile behavior of the line effects its vibrational properties.
Siefers et al.2 –5 and Bergeron et al.6,7 characterized the drag on parachute systems focusing on the contribution of the suspension lines. They reported that the suspension lines have been thought to contribute up to 30% of the drag on a parachute system. This 30% value was based on the assumption that the suspension lines are right circular cylinders which is a geometry that is vulnerable to flow-induced vibration and drag increases with transverse vibration amplitude. 8 To study the flow-induced vibration behavior of suspension lines, they placed 1000-lb and 600-lb Dacron braided suspension lines and representative models of the suspension line in wind and water tunnels at various combinations of tensions and angles of attack to identify the parameters driving the flow-induced vibration. The studies found that the oscillations of the line along with the shedding data did not support “lock-in” as the cause of the large amplitude oscillations. “Lock-in” occurs when a structure’s natural frequency is the same as the fluid vortex-shedding frequency. The shedding frequency of the vortices was much higher than the natural frequency of the suspension line therefore it could not be “lock-in.” It was found that gallop/stall flutter was the cause of these large amplitude oscillations. When a structure is moving perpendicular to the direction of the flow, it will experience fluid dynamic forces in the transverse direction. When these forces on the structure overwhelm the structural damping, a condition of negative damping is developed, and gallop subsequently occurs. 2 This research showed that changes in the angle of incidence of the cross-section resulted in an asymmetric boundary layer and shear layer of vortices which could potentially induce the gallop response of the suspension line. These studies also showed that the suspension lines had at least two modes of vibration – a translational mode about the transverse axis and a torsional mode. The work of Siefers et al. provided insight into the aerodynamics aspect of the vibrations of the suspension line; however, their work did not investigate the relationship between the mechanical behaviors of the line and the associated vibrations.
A number of studies have investigated the tensile mechanical behaviors of braided cords ranging from the dynamic tensile response of mooring cables and cords to the high tensile impact properties of ropes used for rock climbing and parachute deployment.9 –14 Bain et al. 15 investigated the influence of the maximum load and the cyclic loading path to develop a bedding-in procedure to reach a final geometry, that is, where the tows of the rope become nested into a stable configuration for mooring ropes. The cyclical loading settled the fibers into their final geometry, and it was found to be important that a braided rope underwent this process before use so that its axial stiffness is consistent thereby ensuring no random drops in loads or slips while in service. Davies et al. 16 looked at a similar concept but were comparing braided ropes made up of two different types of fiber for deep-sea applications. It was discovered that an aramid fiber rope is less sensitive to the bedding-in process as its residual strain is low whereas the high modulus polyethylene (HMPE) fiber rope presented a higher stiffness than the aramid fiber rope after going through the bedding-in process. The bedding-in process for ropes is not just limited to marine/mooring usage, it can be applied to braided ropes in any application to ensure the rope has its ideal mechanical behavior for its given use. Ding et al. 17 investigated the effects of preloading on the tensile properties of braided polyarylate fiber ropes. Due to the exceptional creep resistance of polyarylate fibers, braided polyarylate fiber ropes are ideal for spacecraft deployable structures with long-term static loads. Ding et al. found that the chord modulus of the ropes reached a maximum level at the preload level of 40% break load, and the tensile strength can be increased by 15% at the preload level of 50% break load. Casey and Banfield 18 conducted laboratory testing to explore the experimental and fundamental dynamic axial stiffness behavior of polyester ropes for deepwater mooring systems, and they found that a large number of cycles were needed for the rope to reach its peak axial stiffness. Chiang 19 completed a parametric design study based on finite element models and a design of experiments to characterize simple-stranded wire cables subjected to axial loading. Chiang considered the axial stiffness as a function of six factors, that is, the radius of the core wire, the radius of helical wires, the helical angle, the boundary condition, the strand length, and the contact condition between the core wire and helical wires. This work showed that cable design choices can directly impact the tensile mechanical behavior of the cables.
There have been many studies on the torsional behavior under tension for twisted ropes/lines, and most of these have been for mooring/marine applications.20 –27 Chaplin et al. 21 looked at how six-strand-wire mooring ropes developed torque under tension and how this torque affected the different components of the rope. They found that if mooring lines are made up of components that have different tension/torsion characteristics, then a significant amount of axial twist will be induced. Davies et al. 25 explored how sea-operation-induced twist in braided ropes affected the rope integrity and safety coefficients. They observed that there was a decrease in the residual strength of the rope with an increase in twist. In contrast to twisted ropes/lines, braided ropes are torque-balanced, that is, when a tensile force is applied to them rotation will not be induced. 25
Ropes subjected to axial tension may also develop internal bending forces. For varying load over time situations, this bend loading can lead to fatigue of the rope. A number of studies have investigated such fatigue, especially in the mining applications.27 –31 Ropes and cables used for suspension and cable-stayed bridges can experience a phenomenon known as free bending and subsequent fatigue failure. Free bending occurs when ropes and cable-like structures under axial tension experience induced bending as a result of an external source such as aerodynamic forces. 32 This condition causes fatigue on the cable/rope over time.32 –37
These previous studies on ropes and cables investigated the torsional and bending behavior for marine, mining, and structural applications with a main focus on how these behaviors effect the service life of these ropes, that is, breaking strength and fatigue life. However, to the knowledge of the authors, no study has looked at the bending and torsional behavior of braided parachute suspension lines and how that behavior affects the vibrational behavior of the lines.
In the current research, the characterization of the torsional and transverse mechanical behaviors of a braided parachute suspension line is presented. The effective torsional and transverse stiffnesses of the line as a function of the state of the tensile load were found to increase with increasing tensile load in the cord. These experimental results can assist in the development of calibrated numerical models to understand how these behaviors (torsional and bending) are impacted by the braid architecture, and these models can be used to guide the design and manufacture of parachute suspension lines to mitigate the undesired vibrations.
Methods
Material system
The cord selected for this study is a 24-tow Dacron 1000-lb (spec breaking strength) suspension line (PIA-C-2754 Type II) (Figure 1(a) and (b)). The tows are braided in an “over two under two” fashion creating a tubular braided structure. Subsequent to braiding, the tube is flattened between rollers to eliminate excess liquid in the lines associated with any pretreatment and this causes the development of a “rounded rectangle” shape, that is, rectangle with rounded corners (Figure 1(c)). The line is then wound onto a spool (Figure 2) which further facilitates this rounded rectangular shape. The specifications of the 24-tow Dacron 1000-lb braided cord are presented in Table 1. 38

Suspension line: (a) front view (b) side view, and (c) cross-section (rounded rectangle) of the suspension line.

Suspension line manufacturing: (a) braiding of the 24 tows and (b) subsequent flattening between two rollers before being wound onto a spool.
Specifications of Dacron suspension line. 38 .
Tensile characterization
The effective elastic modulus of the Dacron suspension line was characterized using the PIA-TEST METHOD-6016D. 39 The suspension line was loaded into the tensile testing machine (Instron 1127 with a 222-kN (50,000-lbs) load cell) and secured with split capstan grips (Figure 3) to mitigate slippage. The gage length was measured to be 0.25 m (10 in) and the test was run at a rate of 0.0025 m/s (6 in/min). Each test specimen was loaded to 75% of the breaking load (4448.2 N or 1000 lbs) of the line and then unloaded to 1% of its breaking load, that is, 3336 N (750 lbs) and 44.5 N (10 lbs), respectively. This loading cycle was repeated five times for each sample. Five samples were tested in this manner to examine reproducibility and repeatability. The load versus displacement data were recorded and then converted to stress-strain. The cross-sectional area of the line was estimated to be a rectangle and the base (5.6 mm) was multiplied by the height (1.9 mm) to obtain an area of 10.64 mm2.

Tensile test of Dacron 1000 lb parachute suspension line set-up.
Torsional stiffness characterization
The torsional mechanical behavior of the line as a function of the state of axial tension was investigated under dynamic and static loading conditions. The dynamic test provided the data to find the torsional stiffness k(T) as well as the torsional damping coefficient c(T). The static test data can only be used to calculate k(T). The benefit of using both approaches to find k(T) is to give confidence to the characterization of this property of the cord.
Dynamic torsion testing
The dynamic torsion test configuration is shown in Figure 4. The suspension line was clamped to a ceiling rafter, and a stack of circular weights was placed on a tray (2.21 lbs, 9.83 N) on the other end of the line. The weights served two objectives. The first was to develop a prescribed tension in the line, and the second objective was to act as a lump mass in a spring-mass-damper system. Because of the relatively small linear density of the line, a measurable torsional vibration response could not be induced on the line without the stack of circular disks, that is, a lumped-mass disk. The intent of this configuration was to mimic a long slender rod with a circular mass at the end. To mitigate the potential for the line + mass system to swing like a pendulum, a support structure which was a combination of t-slot extruded aluminum and black Styrofoam construction board was built and placed near the bottom of the suspension line. To track the torsional displacement as a function of time, a white Styrofoam wheel with a red indicator was attached normal to the axis of the line. A camera was placed over the indicator to capture its movement as a function of time.

Dynamic torsion test setup.
To start the test, the camera was set to record, and an initial angular displacement was applied by hand to the weights at the bottom and released. The resulting motion was recorded for approximately 200–300 s depending on the frequency for the given tension case. The frequency of the rotating weights varied as a function of tension and was very low, that is, 0.02–0.05 Hz. The duration was chosen to ensure enough cycles (a minimum of 5) were captured to calculate the frequency and the associated damping coefficient. Amplitudes of oscillation started at around 2 radians at the beginning of each test and decreased to around 0.5 radians at the end of each test. It was determined that having at least 5 cycles and a reduction in amplitude of about 75% was sufficient to evaluate the frequency and damping of each response. The test was run for the combination of cord lengths and tensions as summarized in Table 2. Four trials were run for each combination of cord length and tension. At the conclusion of the test, the video was postprocessed using the program DLTdv8 (a MATLAB addon). 40 The software identified the x−y positions of the pixel of the tracker as a function of time, and these position-time data were exported to Microsoft Excel. The pixel locations were converted in Excel to angular displacements versus time. These data were then used to calculate the torsional damped natural frequency, fd(T), by taking the reciprocal of the response period. To find the undamped torsional natural frequency, the torsional logarithmic decrement, δ(T), needed to be found. This calculation for δ(T) is,

where n is the number of cycles, xo(T) is the height of the first peak of the torsional response, and xn(T) is the height of the nth peak of the torsional response. 41 After the value of the torsional logarithmic decrement is obtained, the damping ratio of the torsional response, ζ(T), can be calculated using,
Combinations of cord lengths and tensions.*

The weight of the plate for holding the weights was 9.83 N (2.21 lbs.)
The torsional natural frequency, fn(T), can then be calculated using,

The torsional natural frequency and the polar mass moment of inertia (Jm)(kg-m2) of the weights lead to the torsional stiffness,

To obtain the torsional damping coefficient, c(T), the torsional critical damping cc(T) (kg/s) is found using,

Once the torsional critical damping is obtained, the torsional damping coefficient can be found,

where c(T) is the torsional damping coefficient (kg/s).
Static torsion testing
The static torsion test configuration is shown in Figure 5. The line was horizontal where one end was clamped to a fixture made of t-slot extruded aluminum and the other end rested on a pulley with weights hanging off it. A foam wheel was located in the center to apply the torque. Black poster board with a ruler was placed next to the wheel for assistance with image capture (Figure 5(c)).

Static torsion test setup: (a) side view of full setup, (b) overall view if the setup, and (c) close-up view of the wheel and ruler.
These static tests were performed for the combinations of two cord lengths, three tensions and four torques. The same combinations of tensions and torques were used for each cord length, and these combinations are summarized in Table 3. A fishing line was wrapped around the wheel to induce rotation; weights were attached to the fishing line to develop the prescribed torque. The weights that were used for the torque are 10, 20, 30, and 40 g (0.022, 0.044, 0.066, and 0.088 lb.). The radius of the wheel was 0.0254 m (1 in.).
Combinations of torques and tensions.

The test was run by applying a prescribed axial tension to the line from placing weights on the pulley end of the line and then applying a torque at the center of the line. A picture of the foam wheel was taken for the reference configuration, that is, nonzero axial tension and no applied torque. A 10-g weight was then placed on the fishing line to apply the torque, and another picture was taken. Another 10-g weight was then added to equal 20-g on the wheel, and another picture was taken. This process was repeated until pictures were taken of the 30- and 40-g cases as well. After all the pictures were obtained, the pictures with each of the four torques were compared to the no-torque picture to measure the angle change in degrees using ImageJ. 42 For each loading configuration, three trials were run. The torsional stiffness, k(T), was calculated using the torque, T, and the angle, q, obtained from ImageJ.

Transverse stiffness characterization
The transverse stiffness of the suspension line as a function of the state of the tension was investigated in two ways: (1) experimentally using a pluck test and (2) numerically using the tensioned string equation.
Pluck test
The change in the flexural mechanical behavior of the line as a function of the state of axial tension was investigated using a pluck test to solve for the transverse stiffness, k(Tr), and transverse damping coefficient, c(Tr). Similar to the static torsion test configuration, the line was horizontal where one end was clamped to a fixture made of t-slot extruded aluminum and the other end rested on a pulley with weights hanging off it (Figure 6). A high-speed video camera (MotionXtra HG-100k) was used to capture the translational vibration of the line as a function of time. The frame rate for this testing was 2500 frames/s. The first step in the test process was to take a still image of the line for the purpose of getting a scale for the image dimensions, that is, how many pixels in a unit length. The line was then plucked in the center where the tracker point was located, and the record button on the camera was pressed to capture the response. Three trials were run for each combination of cord length and tension (Table 4).

Pluck test setup: (a) overall view of the test configuration and (b) close-up view of measuring the transverse displacement.
Combinations of cord lengths and tensions for the pluck testing.*

The weight of the plate for holding the weights was 9.83 N (2.21 lbs.)
The static images and videos from the camera were postprocessed to calculate the natural frequency and the damping coefficient. The images were analyzed in ImageJ to count pixels/inch. This pixel density was used to convert pixels to lengths in the videos. The videos were again analyzed using DLTdv8 40 to locate the pluck tracking point as a function of time in pixels. The data were exported to Excel where the pixels were converted to meters, and the displacement versus time was obtained. The response was then put through a similar MATLAB code that was used to analyze the dynamic torsion data. The transverse damped natural frequency was obtained by taking the inverse of the period of the response. Equation (1) was then used to solve for the transverse logarithmic decrement, δ(Tr) using xo(Tr) and xn(Tr) which is the height of the first peak and the height of the nth peak of the transverse response respectively. The transverse damping ratio, ζ(Tr), was then calculated using equation (2) using the transverse logarithmic decrement, δ(Tr). At this point, the transverse natural frequency (fn(Tr)) could be calculated using equation (3) with the damped transverse natural frequency (fd(Tr)) and the transverse damping ratio (ζ(Tr)).
Tensioned string equation
For comparison purposes, the natural frequency of the suspension line as a function of the state of tension was calculated using the equation for a tensioned string, 43

where L is the length of the string, Tn is the tension on the string, and
Calculation of the transverse stiffness
The natural frequency from the pluck tests or from equation (8) can then be used to solve for a transverse stiffness using,
where k(Tr) is the transverse stiffness and m is the mass of the line. 41 The transverse critical damping can be found using,

and equation (6) is used to solve for the transverse damping coefficient (c(Tr)) using the transverse critical damping coefficient (cc(Tr)) and the transverse damping ratio (ζ(Tr)).
Results
The results of the characterization testing and modeling are presented in the following subsections.
Tensile testing
The stress-strain results of five tensile tests are shown in Figure 7. It can be seen for all five samples in this graph that the modulus during the loading portion of the cycle was lower than the following four cycles where the loading and unloading responses were very repeatable. The average modulus of the subsequent four loading cycles was 1420.2 MPa. When the line initially goes under tension, the tows of the braid are loose and can move fairly freely before they are pulled to a tension where they nest together (i.e. bed in) and the braid angle locks. The effective axial stiffness of the line increases with each subsequent cycle before becoming constant when the tows become locked into place. This loose-to-then-locking behavior is important to consider with parachute suspension lines because it indicates the need to pretension the lines before use to avoid any slips or drops in load while in service.

Stress versus strain Dacron 1000 lb braided parachute suspension line.
Torsional stiffness
The torsional mechanical behavior of the line as a function of the state of axial tension was investigated under dynamic and static loading conditions.
Dynamic torsion testing
Figure 8 is an example response from one of the trials of the dynamic torsion tests. All calculations for the torsional stiffness in the methods section (“Methods”) are based on the set of torsional test data. Figure 9 shows the torsional stiffness versus tension of a 1.89-m (74.5-in) line. As the tension increases, the torsional stiffness of the line increases.

Dynamic torsion response: angular displacement versus time for tension load of 54.31 N (12.21 lbs).

Torsional stiffness versus tension for 1.89-m Dacron suspension line.
The same dynamic torsion tests were performed on two different lengths at three different tensions to investigate how the length of the line related to the effective torsional stiffness. Figure 10 shows the torsional stiffness versus tension of the two different lengths of line. It can be seen in this figure that the shorter line has a higher effective torsional stiffness than the longer line for all values of tension.

Torsional stiffness versus tension of a suspension line at 1.58 and 1.89 m.
Figure 11 shows the torsional stiffness multiplied by the length versus tension. When this multiplication is done, the two lengths of line have essentially the same value for a given tension. This result can be explained with the assistance of equation (11) 44 where L is the length, G is the shear modulus, J is the polar moment of inertia, θ is the angular displacement and T is torque. While equation (11) is specific to a solid circular rod in torsion, it can be used to assist in the interpretation of the data points in Figure 11.
Equation (11) can be rearranged to,
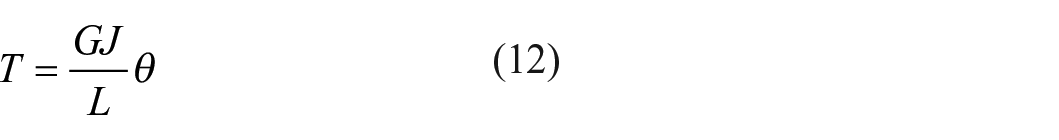
Equation (12) implies the torsional stiffness k(T) can be found using,

as illustrated in Figure 11 and therefore,

where for the case of the suspension line, GJ can be interpreted as the torsional constant for the cross section of the suspension line.
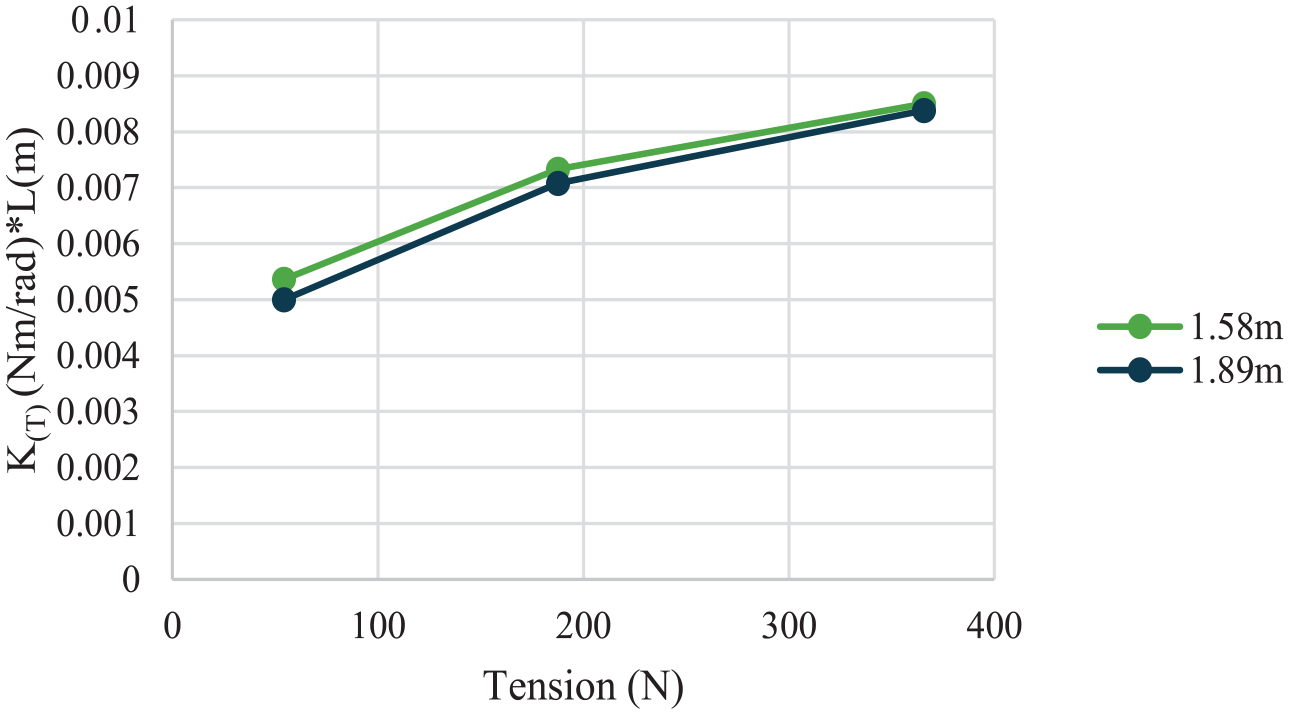
Torsional stiffness × length versus tension.
Figure 11 indicates that as the tension in the line increases, the effective value of GJ increases; however, GJ is essentially the same for the two different lengths of line at the same tension. This equality implies that k(T) can be predicted for any length of line for the range of tensions that were evaluated in the current research.
The torsional damping coefficient as a function of tension for the two lengths is shown in Figure 12. As the line tension increased, the damping coefficient increased, and the damping was independent of line length.

Torsional damping coefficient versus tension.
Static torsion testing
Figure 13 shows the results of the testing for static torsional stiffness versus tension. As with the dynamic torsion tests, the static torsion tests show that the torsional stiffness increases with increasing axial tension and decreases with increasing length. The latter observation is explained by equations (11) and (13) for the simple circular bar in torsion.

Torsional stiffness versus tension (static torsion tests).
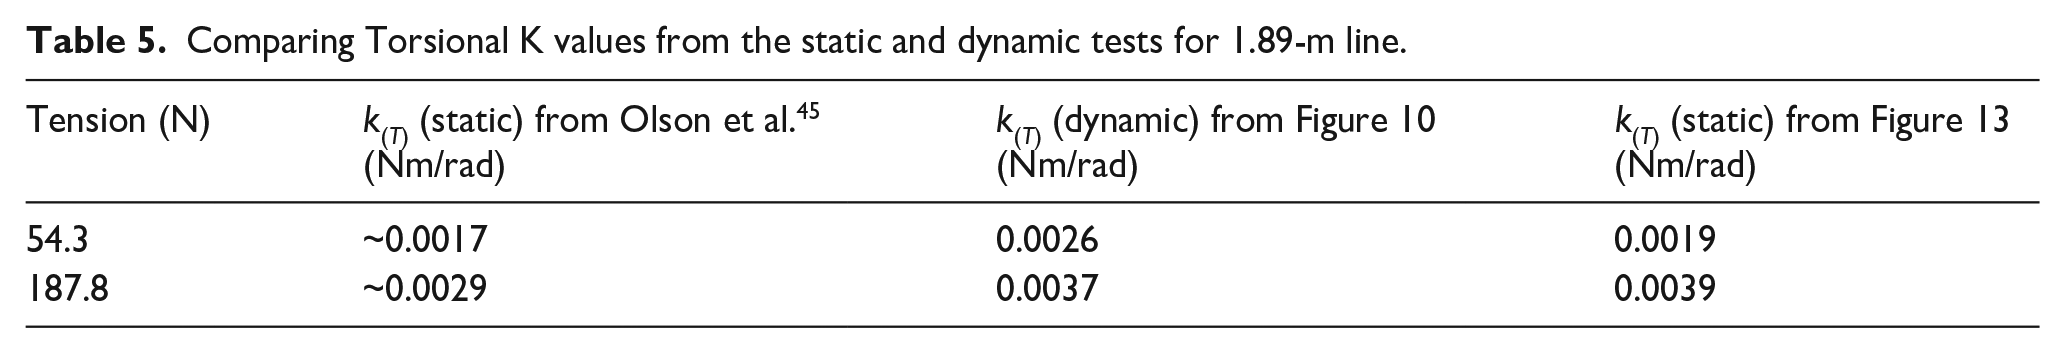
In a previous study by Olson et al., 45 a similar type of static test was performed on a 9.14-m (30-ft) suspension line. The torque was applied at the center of the length of the line, and the angular displacement measurements were taken every 0.61 m (2 ft) between where the moment was applied and the clamped end. The results from Olson et al. correspond well with the results in Figure 13 and with the results in Figure 10 when comparing the torsional stiffnesses from each test at a length of 1.89 m (Table 5). Because the results in Figure 13 are not for a 1.89-m suspension line, the torsional stiffness values for 0.94 m at 54.3 and 187.8 N were taken and multiplied by 0.94/1.89 m. An initial torsional stiffness is still determined using equation (13), but this value is then multiplied by the length ratio to find the torsional stiffness corresponding to the longer length at the same tension. The values obtained from Olson et al. 45 were estimated from the figures of the torsional stiffness versus location along the length in the paper by Olson et al. Table 5 shows that all tests whether static or dynamic produce essentially the same torsional stiffness value for the same length and tension. The correlation of the static and dynamic test results imply that the line does not exhibit viscoelastic behavior in the torsional direction for the applied rate in the dynamic test.
Comparing Torsional K values from the static and dynamic tests for 1.89-m line.
Transverse stiffness
The transverse mechanical behavior of the line as a function of the state of axial tension was investigated using a dynamic pluck test as well as numerically using the equation of a vibrating string. Figure 14 shows the frequency obtained from the pluck tests and as calculated using the equation for a vibrating string in tension (equation (9)) for the combinations of length and tension listed in Table 4. The experimental and numerical results correspond very well for each combination of length and tension. The percent difference decreases with increasing line length, and this decrease in difference could be a result of the boundary conditions in the experiment. Error bars of one standard deviation are included for the pluck test data lines, but the spread in the results is essential negligible for all points, and thus the error bars are not visible except for the last point on the line for the Pluck Test 1.58 m. The overall excellent correlation between the experimental and numerical results implies that the equation for the vibrating string works well for the suspension line considered in this study. Thus, the numerical result was selected to be used for the calculation of the effective stiffness in translation.

Transverse frequency versus tension of plucked line at four different lengths compared with the frequency that was calculated using the equation for a tensioned string.
Figure 15 shows the transverse stiffness versus tension of suspension lines. The data show that the stiffness increases as the tension increases and decreases as the length of the line increases. If the stiffnesses for each length is multiplied by its respective length, the values become the same for a given tension. The result of this multiplication is shown in Figure 16 and is analogous to what was observed for the torsion test data. By setting equation (8) equal to equation (9) and solving for k(Tr), the result is,

or alternatively


Transverse stiffness versus tension for four different lengths of suspension line.
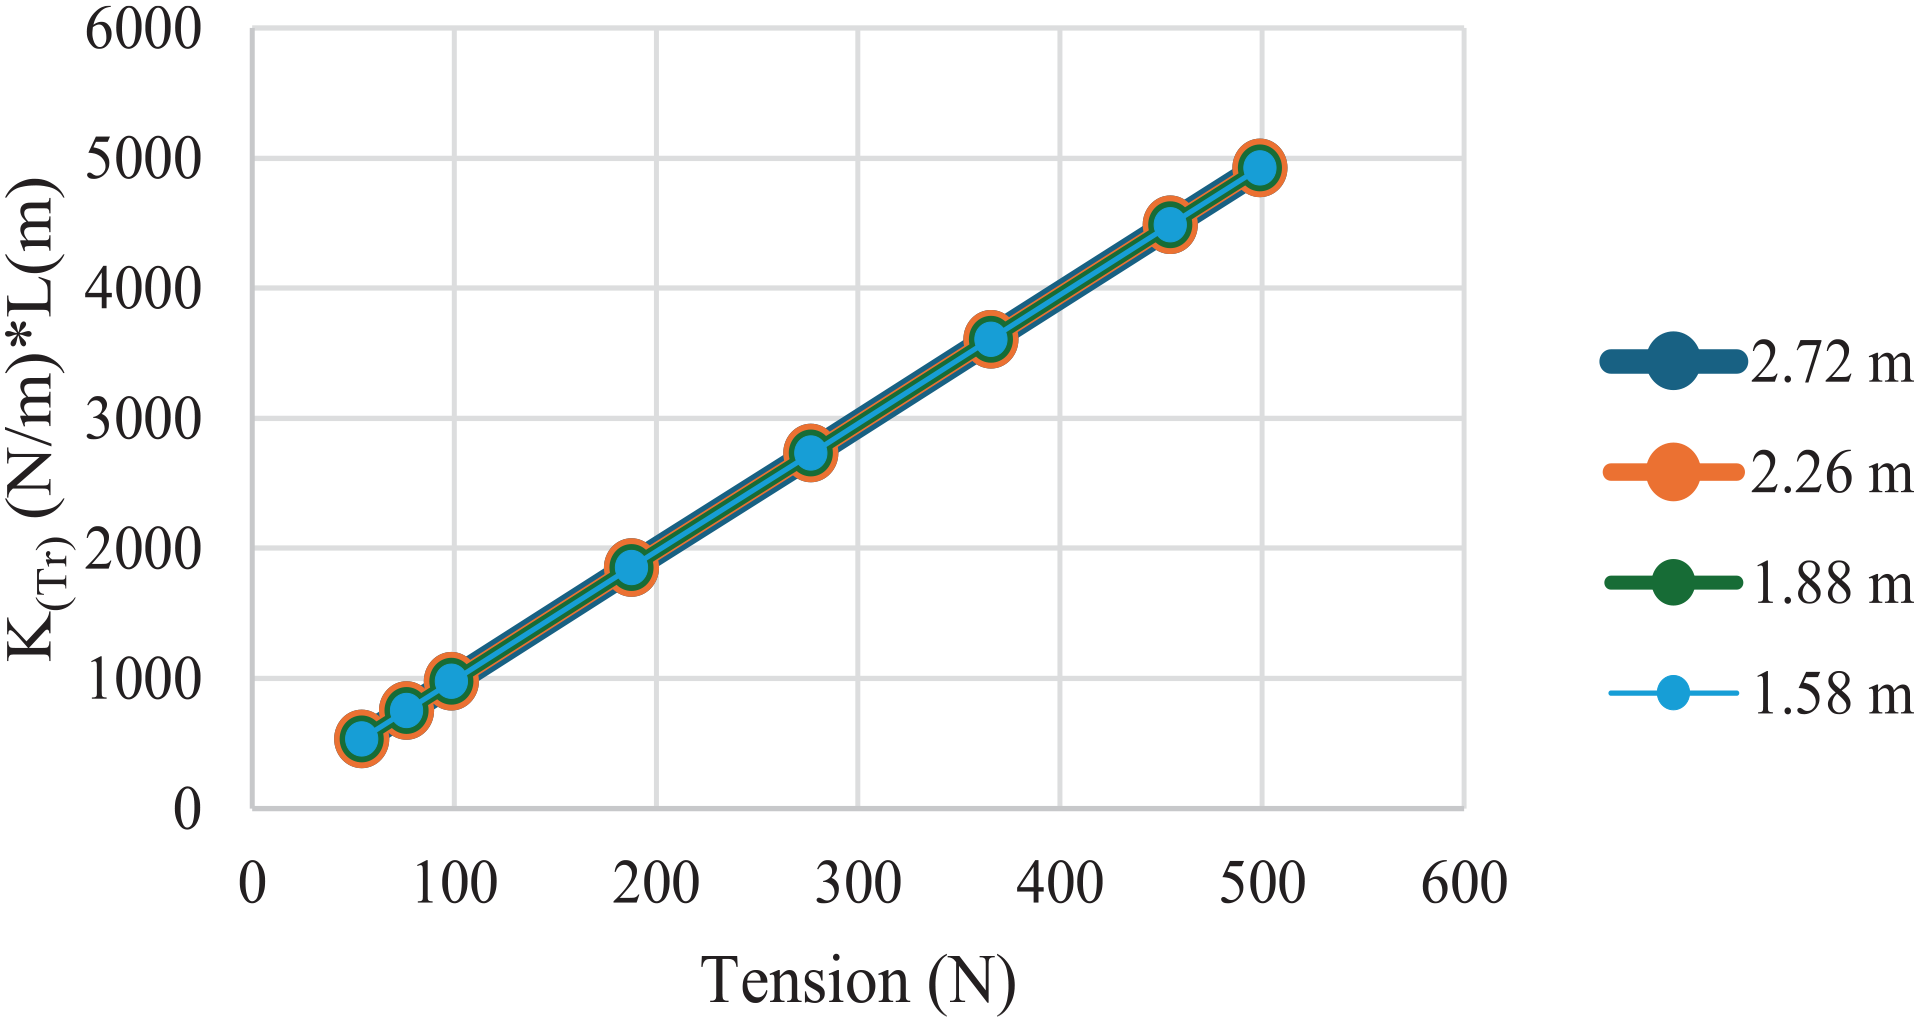
Transverse stiffness × length versus tension for four different lengths of suspension line.
Figure 17 shows the damping coefficient versus tension of a suspension line at four different lengths. For the shorter lengths of the suspension line, the damping coefficient increases with tension; however, as the line gets longer and longer, the damping coefficient becomes constant with tension and length.

Damping coefficient versus tension for four different lengths of suspension line.
Discussion
The torsional and transverse stiffnesses of the suspension line were found to increase with increasing tensile load in the line. This trend makes sense based on what was observed in the tension tests. As the tension in the line increases, the mobility of the tows decreases. This decreased mobility thereby increases the resistance of the line to twist.
The classical torque-rotation equation for a solid circular rod (equation (11)) in torsion was used to assist in the interpretation of the torsion test data. For the braided cord, it is challenging to differentiate between the effective shear modulus, G, and polar moment of inertia J. Thus, the effective GJ (torsional constant) as a function of axial tension was used. It was found that GJ adequately described how the torsional stiffness increased with increasing tension.
The transverse stiffness as found from pluck testing of the suspension line under tension was found to correlate well with the transverse stiffness derived from the vibrating string equation. This good correlation implies that the transverse vibration response is independent of the architecture of the braided cord and that the transverse stiffness as a function of tension can be found using the vibrating string equation. In this equation, the one design parameter is the linear mass density.
These stiffness properties can be used as inputs for fluid-structure-interaction (FSI) models to develop a calibrated FSI simulation of this 24-tow parachute suspension line during descent. The availability of a calibrated model could subsequently be used to perform parametric studies to investigate how changes in braid design and manufacture as reflected in the changes in the effective stiffnesses of the line and in the surface topology can effect changes in the flow-induced vibration response.
The effects of the surface topology of the suspension line on the flow field have been studied by Kalan et al.46,47 They discovered that the textured surface topology led to an earlier boundary layer separation compared to a smooth geometry, thereby inducing a destabilizing effect on the galloping of the suspension line. Furthermore, an observed unsteadiness in the wake was attributed to variations in the initial wake width caused by the bumps on the textured surface topology. Kalan et al. suggested that this alteration in wake width could be linked to the behavior of boundary layer separation and reattachment. With the additional knowledge of the mechanical behavior of the suspension line as to how the effective torsional and transverse stiffnesses of the line vary as a function of the axial tension, the full FSI problem can now be evaluated. This knowledge enables designing lines with fundamental frequencies at respective tensions that do not result in the harmful vibrations that the suspension lines are currently experiencing when interacting with air flow.
Conclusions
The torsional and transverse (lateral translation) stiffnesses of a suspension line as a function of the state of the tensile load were characterized using an experimental program. Both stiffnesses were found to increase with increasing axial load in the suspension line. The torsional stiffnesses derived from the dynamic torsion and the static testing correlated well. The transverse stiffness calculated from pluck testing of the suspension line under tension was found to correlate well with the transverse stiffness derived from the vibrating string equation. The torsional and transverse stiffnesses can be used in FSI models of the suspension line to explore how changes in the braid design can effect changes in the flow-induced vibrations of the line and give guidance on how to mitigate the undesirable vibrations.
Footnotes
Acknowledgements
The authors thank Patrick Drane, Gary Howe, Glen Bousquet, and Barrett Obrien of the University of Massachusetts Lowell for their assistance and advice on the experimental testing of the line.
Declaration of conflicting interests
The author(s) declared no potential conflicts of interest with respect to the research, authorship, and/or publication of this article.
Funding
The author(s) disclosed receipt of the following financial support for the research, authorship, and/or publication of this article: This work was supported by the U.S. Army Combat Capabilities Development Command, Soldier Center [Cooperative Agreement: W911QY-15-2-0002].
Ethical Considerations
This article does not contain any studies with human or animal participants.