
Abstract
Braided rope configuration and properties are the main key factors to consider on choosing it for various industrial applications. Rope's structure is characterized by high axial tensile strength combined with flexibility. The mechanical properties of ropes are greatly influenced by braiding process settings which have crucial effects on their functional performance. In this study, 27 types of braided polyester ropes were produced and divided into three groups according to their structural parameters and braiding settings, which include take-up and tension rates, yarn count, braid pattern, number of spindles and carriers' settings. The effects of changing these parameters on braid angle, repeat length, linear density, and mechanical properties such as tensile stress, strain and tensile modulus were investigated. Statistical analysis was conducted to evaluate the results using multiple regression analysis, F-test, surface and contour plots to illustrate the relation and the interaction between variables that have significant effects on the ropes' properties and to assess their performance. The results indicated that increasing the take-up rate leads to increase the ropes' braid angle. Whereas, increasing the tension leads to obtain ropes of low linear density with high stress and modulus. Ropes of lower strain were attained by increasing the take-up and decreasing the tension rates. Furthermore, the rope sample produced with pattern 2/2 using the high take-up and medium tension rate achieved the highest mechanical properties of high stress, modulus with low strain among all rope samples in the three groups.
Introduction
Braided structures have an exponentially increasing share in the textile industry, where it is extensively used in the manufacturing of technical textiles and composite materials. Braiding technique is characterized by its structural integrity, strength, durability, design flexibility, precision and aesthetic appearance, so braids are used in various industrial applications [1–4]. Braid structures comprise various types such as; flat, soutache, tubular, square, special (fancy or lace), 3 D rectangular, 3 D tubular, and the most commonly used types are flat and tubular braids [5,6]. In every braiding machine, there are two principal motions which are rotational and linear motions, where the rotating components make the braid structure, and the linear motion acts as a “take-up” process. The yarns' carriers motion in one track is clockwise and in the other one is counterclockwise with the (above-below) interactions causing the yarns to interlace at the point where the paths meet, which is the main mechanism for braid construction [7–10]. Braids can be formed using different patterns of yarns interlacing which have a major influence on their mechanical properties. The commonly used patterns are; Diamond (1/1), Regular (2/2), Hercules (3/3). Other constructions such as 2/1, 3/1 and 3/2 interlacement can also be produced [3,7,9]. The braid structure’s geometry is associated with many variables such as braid angle, diameter and pick count [3,11,12].
The braid's size depends on the carriers' number, yarn diameter, number of yarns per carrier, number of yarns per unit length and take-up speed [13]. A slow take-up produces a close braid's structure with tight plait spacing, while a rapid take-up makes a loose braid with more open plait spacing across the braid normal to its axis [5]. Braid angle can be changed by varying the take-up speed of the machine, so low braid angle results in a stiffer product lengthwise, while high braid angle improves radial hoop strength [3]. Thus changing the braid angle has an effect on the distance between yarns, area, and aspect ratio of the yarn, as the angle increases the fiber density and thickness increase as well [14]. Rawal et al. [15] had examined the tensile behavior of tubular braid with elastic core, it was found that braid angle is the most important design parameter that may has an effect on the braid/core systems extensibility. Yüksekkaya [16] analyzed the elastic deformation of braided tubular structures using experimental and theoretical approaches to give an optimum radial force for medical applications. The results showed that the diameter of the braided tube and the filaments number within it have a significant effect on the tensile force applied on the tube. Also, the models indicated that the braided tube diameter decreased with increasing in length.
Zheng and Ye [17] studied the microstructure of 3 D braids and reported that the pitch length decreases with increasing the braid angle and number of yarns as the perform dimension kept constant. Alpyiliz [18] had performed a 3 D modelling of different tubular structures by considering yarns crimp, braid angle, number of yarns, yarn and mandrel diameters. The results included analysis of the mechanical behavior and the structural performance of braids. Also, Rawal et al. [19] studied the tensile properties of braided structures based on constituent monofilament properties, braid kinematics and braid geometry including braid angle, diameter, and Poisson's ratio. They found that both the braid angle and diameter are critical design parameters in braid structures to the model of jamming state of monofilaments. Ochola et al. [20] performed an experimental investigation on the radial contraction and deformation mode of two types of tubular braided structures subjected to uniaxial tensile loading under quasi-static conditions. Realistic geometrical structures were developed for mechanical modeling of braids in terms of tensile loads, elongation, radial contraction and braid angle. The results showed that the number of yarns within the structure had an influence on the radial contraction and braid angle under uniaxial tensile deformation.
Braids are used in several applications such as: towing ropes in automotive and marine industries, propellers and complex shapes for airplane or helicopter in aerospace industry [7,11,21]. Medical products like sutures, composite bone plate, pillar implants, artificial ligament or tendon, etc. [2]. Sporting goods like baseball bats, parachute cords, fishing line and nets, mountaineering ropes, bicycle frames, etc. Other uses include ropes for lifting, winching, shipping, and forestry, electrical cables, hoses, shoes laces, etc. [9,11]. In view of that, rope is considered one of the most used braided products in various technical applications. It is a load-bearing structure used to support tensile loads, however it is very flexible in bending [10,22]. The mechanical properties of ropes are highly affected by their construction, braiding method, yarns type, linear density, braid angle, directional fiber volume fraction, and pre- and post-production heat and treatments [22–24]. Tensile strength and stiffness are the most desirable properties in a rope since it is highly associated with its durability. The rope's resistance to elongation (axial stiffness) increases with increasing its size, although elongation reflects its ability to extend under exposure to load, whether this extension is desired or not depending on the end-use [23,24].
Numerous studies had investigated the mechanical properties of braided ropes and the structure parameters affecting on them. Omeroglu [3] studied the effect of braid pattern and take-up rate on the mechanical properties of tubular braided polypropylene ropes. Vu Thanh Do et al. [25] investigated the mechanical behavior of braided ropes at their internal components scale using a finite element approach. Tensile test was simulated with the model, and the results were compared with experiment. Wang and Liu [26] studied the relationship between the structure parameters and the mechanical properties of 2 D braided polyester ropes. It was revealed that the breaking strength of ropes increased with increasing the pitch length, then after reaching a certain length, the strength declined and the elongation decreased too. Han et al. [27] studied the relationship between the mechanical properties of UHMWPE ropes and several attributes of rope construction. The results showed that the rope breaking strength and elongation were closely related to the twist angle, and the breaking strength had a positive correlation with the rope's diameter.
Due to the lack in literature regarding the interaction between braiding structural parameters and their effect on the ropes’ mechanical properties, extra investigation is required for optimization the braiding parameters to acquire a rope with adequate mechanical properties which is necessary for technical applications. Therefore, this work aims to study the relation and interaction between braiding process structural parameters such as: take-up and tension rates, yarn count, braid pattern, number of spindles and carriers' settings, and to investigate their effects on polyester tubular ropes in terms of their braid angle, linear density, diameter, and mechanical properties like tensile stress, strain, and tensile modulus. Statistical analysis using multiple regression analysis, F-test, surface and contour plots was used to illustrate the interaction between the said variables and their influence on the ropes' properties to assess their performance. In addition to optimizing the values of the significant braiding structural parameters that ensure achieving the best functional performance of ropes having better stress resistance, modulus and with lower strain.
Experimental
In this study, 27 samples of tubular braided ropes were produced with different braiding structural parameters including; take-up and tension rates, yarn count, braid pattern, number of spindles and carriers' settings. The effect of these structural parameters on the mechanical properties of the produced ropes were evaluated in terms of their tensile properties.
Materials
Two polyester multifilament yarns of different count were used in the study for producing the tubular braided ropes namely 150 Denier and 300 Denier with tenacity of 32 cN/Tex and elongation at break of 21%.
Braided ropes production
The braided ropes were produced on a braiding machine Model YTS 1/48 High-Speed machine with 1 Head and 48 Spindles. The machine is equipped with a horn gear of size 90 mm and bobbin size 48 × 140 mm. Figure 1(a) shows the YTS 1/48 braiding machine and Figure 1(b) shows the attached bobbin winding device. The yarn carriers' plates are divided into two sets with different colors (red and yellow) to easily distinguish between the yarns motion on the circular track. Where the red yarns’ carriers are rotating along the track in a clockwise direction and the yellow yarns’ carriers are rotating in a counterclockwise direction to interlace the yarns to form the braid structure.

(a) YTS 1/48 High-speed braiding machine and (b) the bobbin winding device.
The experimental design comprises producing 27 types of tubular braided polyester ropes, they were divided into three groups (A, B &C) according to the changes in yarn count, braid pattern and carriers' settings. Two types of weave patterns were used diamond (1/1) and regular (2/2) as shown in Figure 2, these interlacing patterns were produced by changing the motion of the yarn carriers. The three groups of ropes were produced using different take-up and tension rates that were controlled by changing and alternating the used gears teeth number. For different take-up rates, three gears with teeth no 20, 30, and 40 were used which refer to the low, medium and high take-up speeds, respectively. On the other hand, three gears with teeth no 28, 35, and 42 were used to change the tension rates, which present the low, medium and high tension rates, respectively. The specifications of each group of polyester ropes are illustrated and summarized in Table 1 as follows:
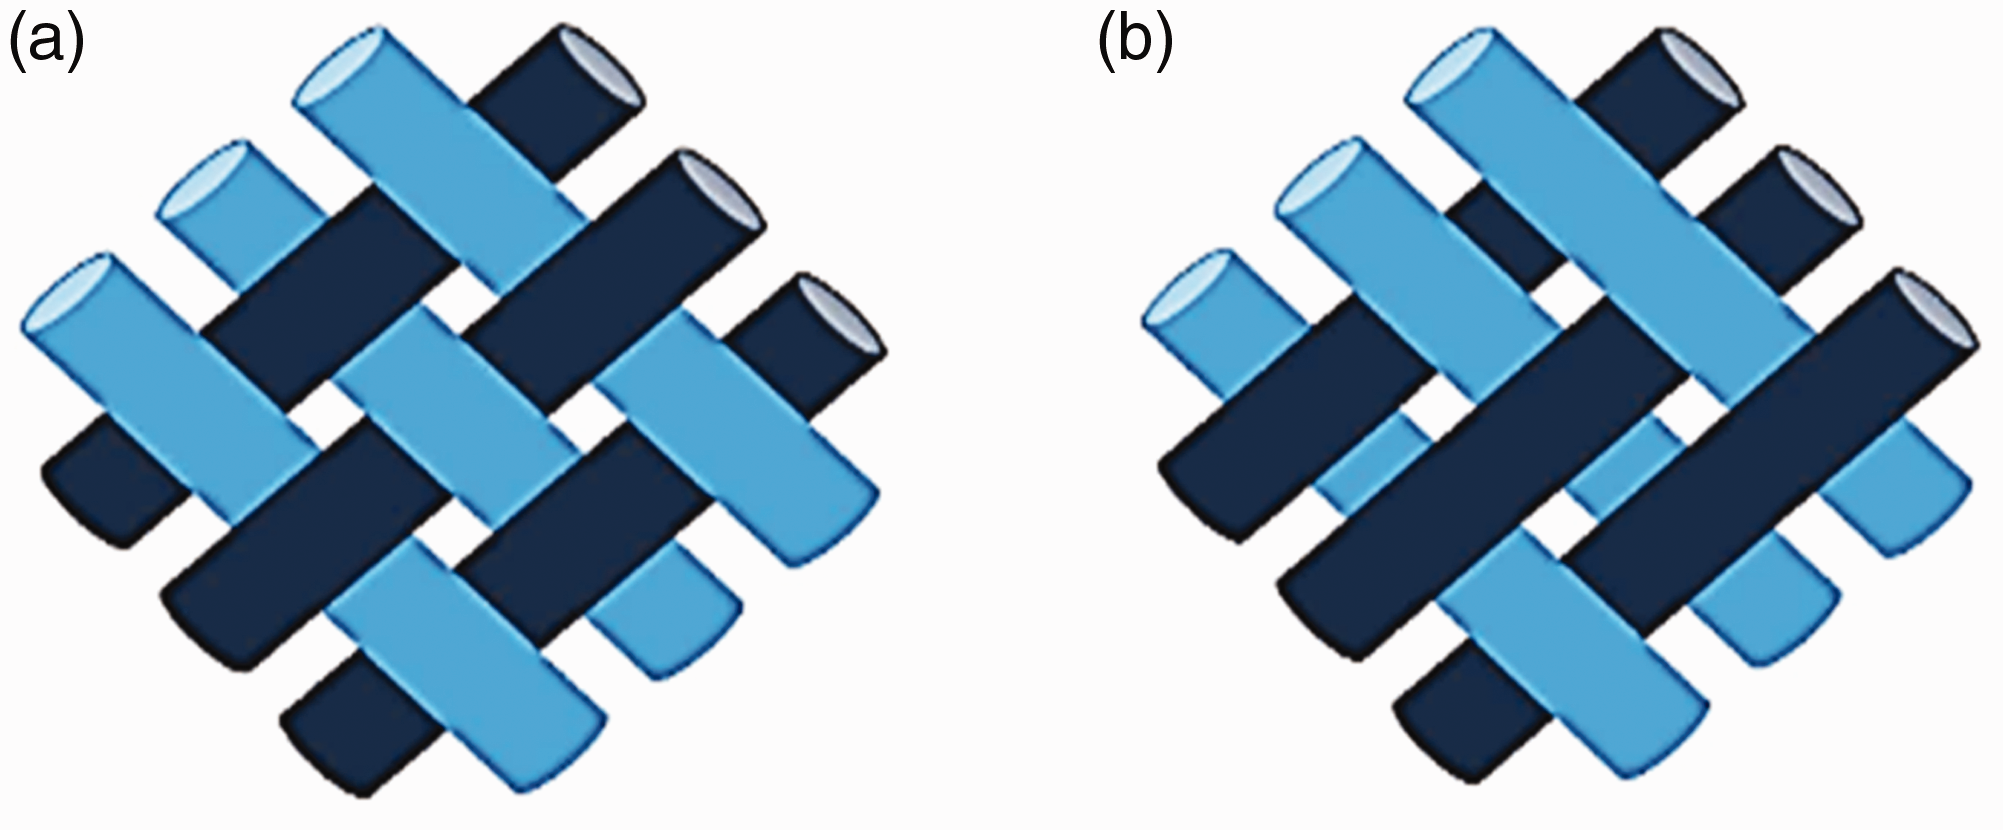
Braid patterns used: (a) diamond structure 1/1 and (b) regular structure 2/2.
The specifications of polyester ropes for groups A, B and C.

Group A composed of 9 samples produced with polyester yarns of count 150 D with regular pattern 2/2 using all the 48 spindles. To prepare the machine for pattern 2/2, the yarns pass above two and below two yarns in a repeat unit as shown in Figure 2(b). Figure 3(A) illustrates the setting of the yarn carriers to produce the 2/2 structure. Machine yarn carriers setting for producing the braided ropes for groups A, B and C. (The used yarn carriers in each group are found in red and yellow colors.)
Group B composed of 9 samples produced with polyester yarns of count 300 D with diamond structure 1/1 using 24 spindles out of the 48 spindles to form the interlacement. In 1/1 pattern Figure 2(a), the yarns have an alternation in which one yarn passing above and then below the other yarns. The carriers were adjusted to be 12 carriers x 2 spindles (1 yellow spindle, one red spindle), Figure 3(B) illustrates the setting of the two sets of yarn carriers to produce the 1/1 structure.
Group C composed of 9 samples produced with polyester yarns of count 300 D with structure 2/2 using 24 spindles out of the 48 spindles to form the interlacement. The yarn carriers were divided into 8 carriers x 3 groups, where each 8 yarn carriers are working in groups. Figure 3(C) illustrates the setting of the two sets of yarn carriers to produce the 2/2 structure.
Testing
Prior to the tests, all braided ropes were put in the standard atmospheric conditions (20 ± 2°C and 65 ± 2% RH) for 24 hours. The relationship between polyester ropes structural parameters and their mechanical properties were studied and evaluated. The changing in take-up and tension rates during production will have also an influence on the ropes linear density and braid angle.
Microscopic analysis
The produced tubular braided ropes structure were examined using laboratory Stereo zoom microscope Optika Italy model SZN-6 with Parfocal achromatic zoom 0.67x– 4.5x.
Braid angle and repeat length
Braid angle (θ) is half the angle between the interlacing yarns in the vertical direction of a braid, and the repeat length refers to the length of one helical of the braided yarn across its vertical axis. The changes in the braid angle and repeat length of the produced polyester ropes were measured for each group. 5 readings were taken for each sample to ensure of the consistency of the results and then was averaged. Figure 4 shows determination of braid angle on the rope sample.

Determination of braid angle on the rope sample.
Linear density
The linear density is the mass per unit length of the braided ropes (rope count) and determined according to ISO 2307:2010. It is expressed in count Tex (grams per kilometer).
Mechanical properties
The mechanical properties of the polyester braided ropes were evaluated in terms of tensile strength test. The test was carried out on Universal Testing Machine Galdabini Quasar 50 kN with a cross-head speed of 300 mm/min and 25 kN load cell. The gauge length between the jaws was set to be 200 mm. During the tests, mechanical properties such as maximum tensile stress, strain, and modulus of elasticity were obtained. The tensile strength of the ropes was determined according to ISO 2307:2010.
The experimental work was performed at the Innovative Textile Technology Center (ITTC) established by the Textile Alliance project located in the National Research Centre (NRC), Egypt. The physical and mechanical tests were carried out in the Textile Research Division laboratories, while the microscopic analysis were done at the laboratory of ITTC at NRC.
Statistical analysis
Multiple regression analysis and its coefficients were carried out and estimated. Surface plots were used to illustrate the relation between each variable that has a significant effect on the measured properties. Response surface analysis is a statistical method that reflects the variables which are affected by multiple factors, through reasonable experimental design methods to obtain and analyze data, find the optimal process parameters and to solve multivariable problems. This method uses a multiple regression equation to fit the functional relationship between factors and variables. In general, the function can be approximated by a quadratic function near the extreme point, and the number of iterations is small and the convergence is fast. In this study, the experiment establishes the quadratic response surface model description:
Where b0 represents the absolute limit, b1 and b2 represent the linear effect of X1, X2 respectively and b12 reveals the linear-by-linear interaction between X1 and X2 (the coefficients of the mathematical model are determined by the regression tool). The necessary data for building the response models are collected by the design of experiments (full factorial design 32) presented in Table 2.
Experimental parameters and their levels.

Results and discussion
Microscopic analysis
Figures 5 to 7 show the microscopic images of polyester braided ropes in groups A, B and C, respectively. It can be observed that the diameter of rope samples in group C is smaller compared to that of rope samples in groups A and B which are approximately have same diameter, and their values are closed as seen also in Table 1. This could be attributed to the structural parameters and carriers setting of the two groups that have the same effect on ropes. Figures 5 and 7 illustrate the pattern structure 2/2 in ropes of groups A and C, it was found that the number of yarn carriers used in each group has an effect on the pattern appearance, the pick length in group A is smaller compared to that in group C which is more tight and longer due to the high braid angle and small diameter. Although in group B ropes with pattern 1/1 which is characterized by its more intersections, the ropes show wider diameter with half the number of yarn carriers. The arrows shown in the figures indicate the pick length for three samples in each group of ropes. The repeat length varies with changing the take-up and tension rates in each group as shown in Figures 5 to 7. Rope samples no 9, 18 and 27 recorded the highest repeat length in group A, B and C, respectively compared to all the other samples. This was achieved by using the highest take-up gear with the lowest tension gear (40/28). The braid angle varies with changing the take-up rates, as it reaches its highest values with using gear no (40 teeth) in all groups of rope samples.

Group A of polyester braided rope samples from (1-9).
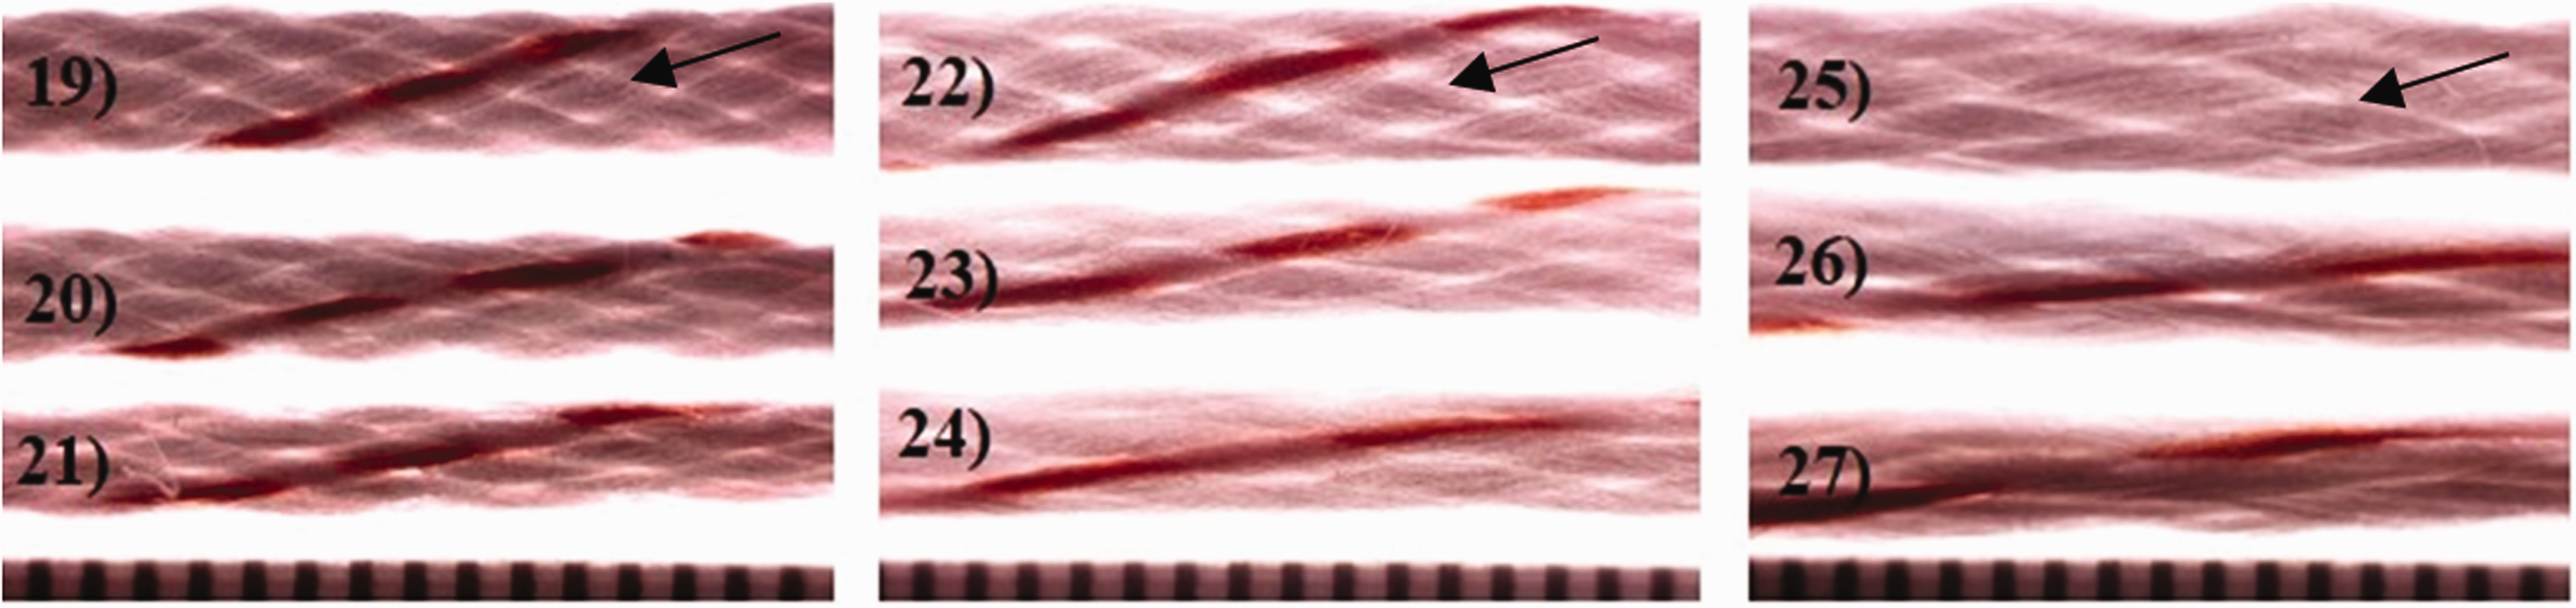
Group C of polyester braided rope samples from (19-27).

Group B of polyester braided rope samples from (10-18).
Braid angle and repeat length
The braid angle and repeat length values of the tested polyester ropes are illustrated in Table 3. It was observed that the braid angle values of all rope samples ranged between 74° and 86°. Group C recorded the highest values of braid angles of (82–86°) and low diameter values of (2.6–3.77 mm) as seen in Table 2 compared to the other samples. While ropes in groups A and B showed the same values of braid angles, this could be related to the carriers setting of 24 spindles with using yarn count of 300 Denier in group B samples which gave the same effect on braid angles of samples in group A. The carriers setting and yarn count in group C make the structure more open, which caused an increase in the braiding angle. Also, it was found that increasing the take-up rate by using gears no from (20-40 teeth) leads to increasing in braiding angle gradually, although increasing the tension rate with gears no from (28-42 teeth) has no effect on the braid angle in each group of rope samples. This may be attributed to that the take-up gears control the braiding speed which caused a change in the braiding angle. Although changing the tension rate caused a change in the repeat length for the same braid angle. The repeat length in all rope samples increased with increasing the take-up rate and decreasing the tension rate due to the contraction in braid length with increasing the tension. Rope samples no (1, 10, and 19) showed the lowest repeat length values of (1.5, 1.7, and 1.8 cm), while rope samples no (9, 18, and 27) showed the highest repeat length of 5 cm within all groups of ropes. It was noted that the setting of each group of rope samples gave a similar effect on the repeat length since their values were approximately the same in all ropes groups.
Braid angle and repeat length results of the braided polyester ropes.

Linear density
Table 4 depicts the linear density values of the braided rope samples, while the response surface equations, correlation coefficients, P-values and significance levels are shown in Table 5. The effect of take-up and tension rates on the linear density for each group of ropes are shown in the surface plots in Figures 8 to 10. It was found that the changes in the ropes linear density are highly affected by changing the take-up and tension rates. The linear density of ropes in each group ranges from 850 to 1200 Tex in group A, from 853.33 to 1244.56 Tex in group B and from 848.57 to 1157.9 Tex in group C. Rope samples no 2, 18 and 20 recorded the highest linear density values of 1200, 1244.65, and 1158 Tex in groups A, B and C respectively. The results showed that for rope samples in groups A and C increasing in the take-up rate leads to decrease in the rope's linear density at specific tension level (Figures 8 and 10). This is due to the extension (elongation) that happened in the rope length which reduced the diameter [22]. The higher values of linear density were obtained at the lowest and middle levels of take-up for all tension levels. Whereas in group B increasing the take-up rate leads to a decrease in the ropes linear density which reached their lowest values at the middle level with using take-up gear no (30 teeth) (Figure 9), and then increased at the highest level of take-up at the different levels of tension, but this increase was not-significant.
Linear density values of polyester rope samples.

Linear density response surface equations, correlation coefficients and significant values for rope samples in groups A, B and C.

X1: Take-up variable, X2: Tension variable and X1*X2: the interaction between them.

Effect of take-up and tension rates on ropes linear density (Group A).

Effect of take-up and tension rates on ropes linear density (Group B).

Effect of take-up and tension rates on ropes linear density (Group C).
In the same context, the linear density of ropes decreased in groups A and C at all levels of take-up in high levels, this means increasing the tension during the production process of the ropes to obtain the lowest level of linear density for these specifications of ropes under study. While in group B, increasing the tension leads to increase the linear density of ropes at the lowest and middle levels of take-up and decreased at the highest level. Also, it was indicated from Table 5 that the multiple correlation factor (R) for rope samples in groups A and C are 0.864 and 0.881, respectively at a high significant level. So the models were able to explain 86.4% and 88.1% respectively of the variability in the experimental results, which is a good correlation between them. The rope samples in groups A and C showed a similar behavior due to using the same pattern structure 2/2 which has longer floats compared to the pattern 1/1 and to the yarn carriers setting which gave the same effect on the braid structure. Moreover, it was indicated from the P-values of the studied parameters, that far less than 0.01 were significant value. The interaction between the take-up and tension rates was non-significant in all groups of rope samples.
Tensile stress
The effect of take-up and tension rates on the tensile stress for each group of rope samples are shown in the surface plots in Figures 11 to 13. The stress response surface equations, correlation coefficients and P-values and significance levels are given in Tables 6 and 7 illustrates the stress values of polyester ropes. The ropes stress values range from 18.37 to 26.21 cN/Tex in Group A, from 18.11to 25.9 cN/Tex in group B and from 18.04 to 24.68 cN/Tex in group C. The highest stress values were achieved by rope samples no 4, 14 and 19 which are 26.21, 25.9, and 24.68 cN/Tex respectively. For groups A and C rope samples, the results showed that increasing the tension rate leads to increase the tensile stress of all rope samples at all levels of take-up in high levels (Figures 11 and 13). This may be attributed to the increase in tension which resulted in decreasing in the ropes’ diameter. Increasing the rope tension caused increase in the tension between the fibers which increased their capability to sustain the occurred stress. So, it is better to increase the tension during the braiding production process to obtain the highest level of stress for the proposed ropes under study. It was also indicated for group B rope samples that increasing the take-up rate at a range of lower levels leads to increase ropes stress resistance which reached to its highest value at the middle level, but this increase is not significant (Figure 12). Then the ropes stress decreased at the highest level of take-up with using gear no (40 teeth) at the different levels of tension, this could be attributed to the high braid angle and open structure of the ropes associated with the high take-up rate which reduced the yarns resistance to tensile stress when exposed to the maximum load.
Stress response surface equations, correlation coefficients and significant values for rope samples in groups A, B and C.

X1: Take-up variable, X2: Tension variable and X1*X2: the interaction between them.
Comparison of stress values for rope samples in groups A, B and C using F-test.


Effect of take-up and tension rates on ropes tensile stress (Group A).

Effect of take-up and tension rates on ropes tensile stress (Group B).

Effect of take-up and tension rates on ropes tensile stress (Group C).
It was found from Table 6 that the multiple correlation factor (R) for rope samples in groups A and C are 0.89 and 0.875, respectively at a high significant level. So the models were able to explain 89% and 87.5% respectively of the variability in the experimental results, which is a good correlation between them. Also, it was clear from the P-values of parameters, that far less than 0.01 were significant value. The interaction between the take-up and tension rates was non-significant in all groups of rope samples.
When comparing the stress values for groups A, B and C using F-Test, it was indicated that there are significant and non-significant differences as shown in Table 7.
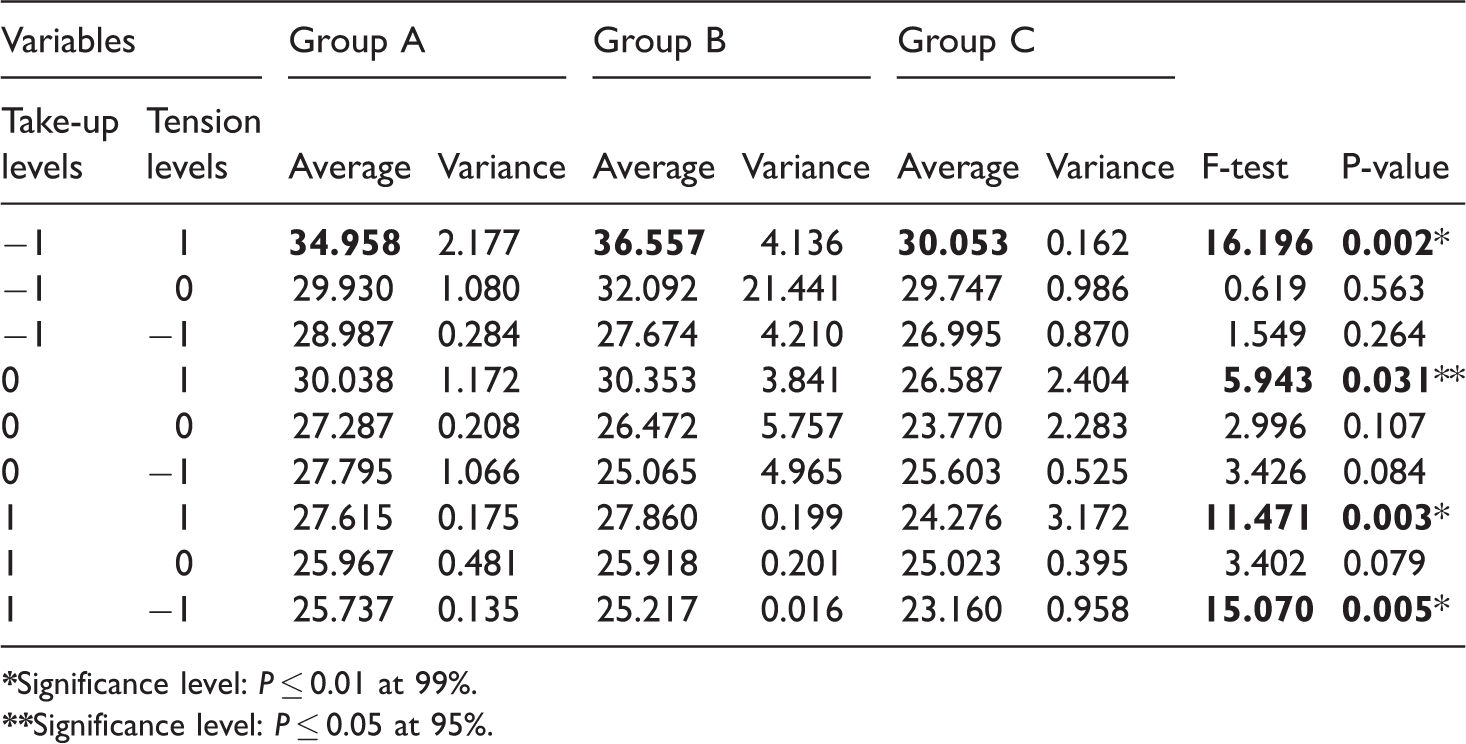
Strain
The effect of take-up and tension rates on the strain percentage of rope samples for each group is shown in the surface plots in Figures 14 to 16. The strain response surface equations, correlation coefficients and P-values and significance levels are given in Table 8 and the strain values of rope samples are presented in Table 9. The results showed that, the ropes strain values in each group ranges from 25.74 to 34.96% in Group A, from 25.05 to 36.56% in group B and from 23.16 to 30.05% in group C. The lower strain values were observed in group C samples. Highest strain values were achieved by rope samples no 1, 10 and 19 which are 34.96, 36.56, and 30.05%, respectively. It was found that increasing the take-up rate leads to decrease ropes strain gradually along with the increase in the repeat length at all levels of tension for all groups of samples. Due to the effect of high take-up speed that pulls up the yarns in the rope's structure and stretch them during exposure to load, while the low take-up packed the yarns and gave them more space to extend when exposed to extension [11]. Whereas increasing the tension rate leads to increase the strain of rope samples in groups A and B at all levels of take-up (Figures 14 and 15). This means it is better to increase the tension during the braiding production process to obtain the highest level of strain for these specifications of ropes under study. While group C rope samples had its higher values of strain with the lowest level of take-up (20 teeth gear) (Figure 16). The lower values of strain were found with the highest rate of take-up using 40 teeth gear.
Strain response surface equations, correlation coefficients and significant values for rope samples in groups A, B and C.

X1: Take-up variable, X2: Tension variable and X1*X2: the interaction between them.
Comparison of strain values for rope samples in groups A, B and C using F-test.

Effect of take-up and tension rates on ropes strain (Group A).

Effect of take-up and tension rates on ropes strain (Group B).

Effect of take-up and tension rates on ropes strain (Group C).
It was indicated from Table 8 that the multiple correlation factor (R) for rope samples in groups A, B and C are 0.917, 0.81 and 0.82, respectively at high significant level. So the models were able to explain 91.7%, 81% and 82% respectively of the variability in the experimental results, which is a good correlation between them. Also, it was clear from the P-values of parameters, that far less than 0.01 or 0.05 were significant value. The changing in take-up and tension rates was significant in all groups of rope samples, while the interaction between them was significant for groups A and B. When comparing the stress values for groups A, B and C using F-Test, it was indicated that, there are significant and non-significant differences as shown in Table 9. There is a significant difference between stress values in rope samples produced using the highest level of tension with gear no (42 teeth).
Modulus of elasticity (MOE)
MOE values are presented in Table 11 and the effect of take-up and tension rates on the rope samples modulus in each group is shown in the surface plots in Figures 17 to 19. Table 10 shows the modulus response surface equations, correlation coefficients and P-values and significance levels. The results showed that, the braided ropes modulus values ranges from 244.33 to 609 N/mm2 in Group A, from 189.67 to 619.75 N/mm2 in group B and from 389.7 to 612 N/mm2 in group C. The highest modulus values were obtained by rope samples no 7, 15 and 25 which are 609, 619.75, and 612 N/mm2, respectively, which are much closed values. For group A, it was revealed that increasing the take-up rate leads to increase the modulus at all levels of tension (Figure 17), while increasing the tension leads to increase ropes modulus at only the high levels of take-up with gear no (40 teeth), but this increase has a significant effect on the rope's modulus when an interference occurs between the take-up and tension variables. For group B rope samples, increasing the take-up leads to increase the modulus at the low and middle levels and then decreases slightly at its highest levels. Although increasing the tension leads to decrease rope modulus at the lowest level of take-up, then increased slightly at the middle and higher levels of take-up (Figure 18). Group C results showed that, increasing the take-up rate leads to increase the modulus at all levels of take-up in final levels, while increasing the tension leads to increase rope modulus at all levels of take-up (Figure 19).
Comparison of modulus values for rope samples in groups A, B and C using F-test.

Modulus response surface equations, correlation coefficients and significant values for rope samples in groups A, B and C.

X1: Take-up variable, X2: Tension variable and X1*X2: the interaction between them.

Effect of take-up and tension rates on ropes modulus of elasticity (Group A).

Effect of take-up and tension rates on ropes modulus of elasticity (Group B).

Effect of take-up and tension rates on ropes modulus of elasticity (Group C).
It was indicated form Table 10 that, the multiple correlation factor (R) for rope samples groups A, B and C are 0.928, 0.73 and 0.88, respectively at a high significant level. So the models were able to explain 92.8%, 73% and 88%, respectively of the variability in the experimental results, which is a good correlation between them. Also, it was clear from the P-values of parameters, that far less than 0.01 or 0.05 were significant value. The changing in take-up rate was significant for all groups of rope samples, while the tension was significant for groups B and C as shown in Table 10. The interaction between the take-up and tension rates was significant for groups A and C. When comparing the modulus values for groups A, B and C using F-Test, it was indicated that there are significant and non-significant differences as shown in Table 11.
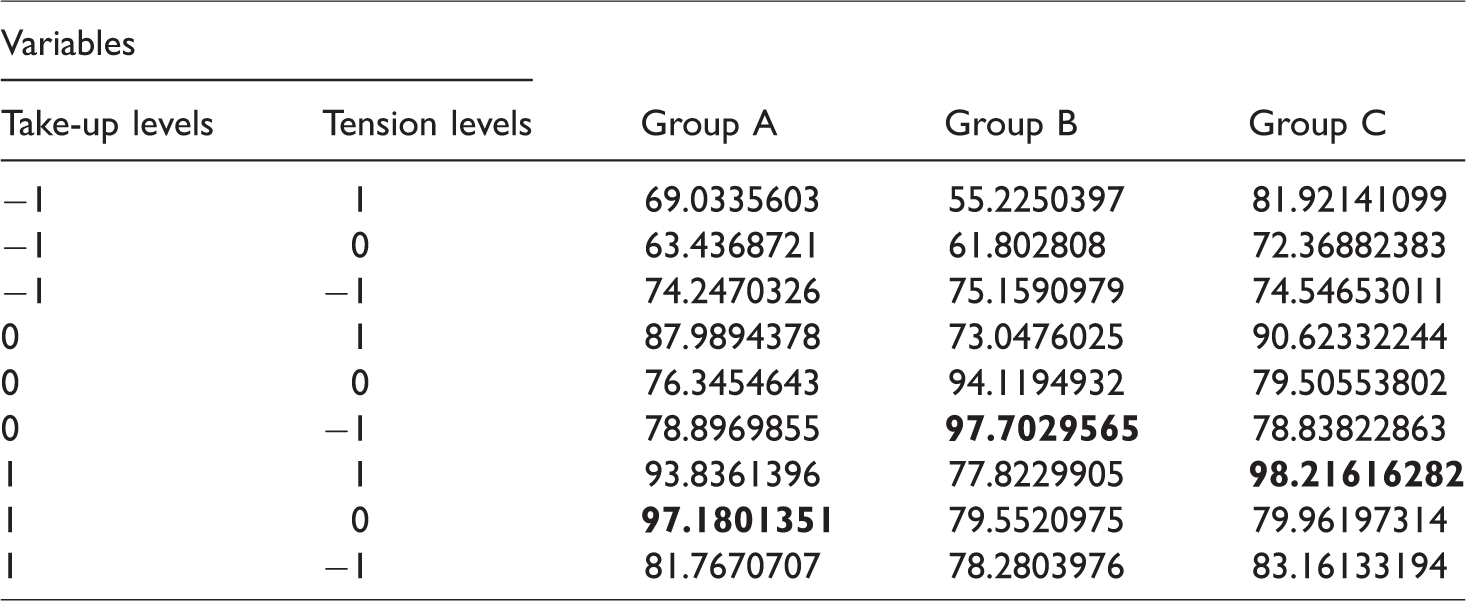
General quality factors
Table 12 shows the general quality factors evaluation for the mechanical properties of the produced polyester rope samples in each group. It was indicated that, the best ropes mechanical performance that have the highest stress resistance and modulus with the lowest strain were; rope sample no 8 produced with (Take-up/Tension) gears combination (40/35) in group A, rope sample no 15 produced with (Take-up/Tension gears) combination (30/28) in group B, and rope sample no 25 produced with (Take-up/Tension gears) combination (40/42) in group C.
Evaluation of the properties of rope samples in groups A, B and C.
Rope samples optimization
The optimization can be performed graphically through overlay contour plot. It is better for optimizing several responses when there are only a few process variables overlaying the contour plots for each response. In this method, it is possible to determine the suitable constructional variables. Figures 20 to 22 are presenting an overlay contour plots for rope samples in groups A, B and C, respectively on two dimensions representing the interaction between the two variables in a two dimensional space. The overlay contour plots show the studied properties behavior within the limitation of the tested ropes. The problem of improving the braided ropes could be solved by overlaying or observing the graphs of the response surface together. The figures show graphical solutions which represents all the investigated properties. Table 13 shows the values of the variables (Take-up/Tension gears) at the optimum region of overlay contour plots for each group of ropes that can achieve the best performance with having better stress resistance and modulus with the lowest value of strain. The results revealed that to achieve the best performance for each group of ropes with the specified structural parameters, it is better to use (Take-up/Tension) gears combination (40/38) for group A ropes, gears combination (21/28) for group B ropes, and gears combination (40/42) for group C ropes.
Levels and values of the variables at the optimum region for rope samples in. groups A, B and C.


Overlay contour plots of group A rope samples for stress, strain and modulus properties.

Overlay contour plots of group B rope samples for stress, strain and modulus properties.

Overlay contour plots of group C rope samples for stress, strain and modulus properties.
Conclusions
Designing and production of braided ropes for various applications require continuous studying of braiding process parameters and their effects on the ropes performance. In this work, 27 tubular polyester braided ropes were produced with different specifications, they were divided into three groups A, B and C according to their braiding structural parameters including; take-up and tension rates, yarn count, braid pattern, number of spindles and carriers' settings. The interaction between the structural parameters of ropes and their effect on the ropes characteristics and mechanical properties were investigated and statistically analyzed. The results revealed that increasing the take-up rate leads to increase in the ropes' braid angle and repeat length. Although, increasing the tension leads to obtain ropes with low linear density and high stress and modulus. Ropes of lower strain were attained by increasing the take-up and decreasing the tension rates.
Thus, it is better to increase the tension rate to obtain maximum stress and modulus during production of ropes in groups A and C produced with the same pattern structure 2/2. For group B ropes produced with pattern 1/1, using the middle level of take-up achieved the highest stress and modulus. An overall evaluation of the mechanical properties of the produced ropes demonstrated that, the best ropes performance which have the highest stress and modulus with the lowest strain in all groups was rope sample no 8 in group A produced with the highest take-up and middle tension rates using gears no (40/35). Additionally, followed by rope sample no 15 in group B produced with the middle take-up and lowest tension rates using gears no (30/28), and rope sample no 25 in group C produced with the highest take-up and tension rates using gears (40/42). Optimization of the produced ropes specifications and tested mechanical properties revealed that, to achieve the best performance for each group of polyester rope samples, it is better to use (Take-up/Tension) gears no (40/38) for group A, gears no (21/28) for group B, and gears no (40/42) for group C.
Footnotes
Declaration of conflicting interests
The author(s) declared no potential conflicts of interest with respect to the research, authorship, and/or publication of this article.
Funding
The author(s) disclosed receipt of the following financial support for the research, authorship, and/or publication of this article: This work was funded by the Innovative Textile Technology Center established by the Textile Alliance project located in the National Research Centre (NRC), Egypt.