
Abstract
Innovative researches are increasingly becoming very important in construction industry in order to enhance concrete performance, reduce cost or/and contributing to environmental sustainability. This paper aims to experimentally investigate the effect of burlap fiber on mechanical and micro structural properties of concrete. Five levels of Burlap fiber contents: 0.1, 0.35, 0.60, 0.85%, and 1.1 (% wt) selected and investigated for their effect on concrete the properties of C25 concrete. The experiment was designed in completely randomized design with three replications for compressive strength, tensile strength, and water absorption of the concrete. Whereas descriptive statistics for workability and permeability tests and qualitative assessment for microstructural properties were employed. All the required tests for mechanical and microstructural properties were carried out according to AASHTO and ASTM procedures. It is found that all the burlap fiber content in the range 0.1%–0.85% (wt) can produce workable fresh concrete. In this range of burlap fiber, the fiber contents have showed no statistically significant effect on compressive strength but have showed statistically significant effect on tensile strength and water absorption. Among the different levels, 0.6% (wt) burlap fiber of has shown superior performance. At 0.6% (wt) burlap fiber, the compressive strength equivalent to control mix (0% fiber) is achieved but for tensile strength and water absorption statistically significant and highest improvement relative to the control mix are achieved. The results from the permeability test and microstructural analysis of images also further confirm that the fiber content of 0.6% (wt) can ensure more strong and durable concrete. Therefore, it is recommended to use 0.6% burlap fiber to enhance the tensile strength significantly (by about +3.8% relative to the control), yet maintaining similar compressive strength and water absorption with conventional C25 concrete.
Introduction
Plain concrete has a high compressive strength but a very low tensile strength, negligible crack resistance, and high susceptibility to micro-cracking. It is frequently reinforced with steel bars, and the material is known as reinforced concrete.1–4 Its popularity is boosted by its extended lifespan and relatively simple maintenance requirements. 5 Concrete is resistant to wind, water, rodents, and insects, and does not corrode, degrade, or decay. It is made of a non-combustible substance, making it both fire- and temperature-resistant. 6
There are several ways to improve the performance of concrete. Accordingly, using fibers in concrete is one way to increase its tensile strength.2,3 Enhanced Fiber Concrete (EFC) is a composite material made of fibrous material that improves the structural integrity of the material and consists of cement mortar or concrete compositions with discrete, sporadic, and appropriately sized fibers. 7 Fibers are typically utilized in concrete to prevent cracking caused by drying and plastic shrinkage. 4 Additionally, they reduce the permeability of concrete, which in turn reduces water bleeding through concrete. 4 It has been more than 30 years since the first advancements in fiber concrete research were made.1–4,8
Studies have shown that additive materials and composites can improve mechanical characteristics and durability.2–4,8,9 Concrete can be strengthened by adding a variety of fibers, with the main benefit of increasing tensile strength. Some of the commonly used fibers in concrete are glass fiber-plastic-based polypropylene fibers, carbon fibers, steel fibers, and different fiber mixtures. Fiber-reinforced concrete is categorized by the American Concrete Institute (ACI) Committee 544 based on the fiber material type that has been used on concrete. These are steel fiber-reinforced concrete (SFRC), glass fiber-reinforced concrete (GFRC), synthetic fiber-reinforced concrete (SNFRC), and natural fiber-reinforced concrete (NFRC). 1 Several studies have been conducted to investigate the effect of fibers on the physical and mechanical properties of concrete. Moreover, considerable results have been observed for the strength and performance of concrete.8,10–19 However, there is no evidence to support the use of natural fibers in concrete in Ethiopia, and there is a lack of in-depth research on the use of burlap in concrete. Therefore, the present study addresses a critical concern regarding the use of locally available natural fibers in the production of fiber-reinforced concrete. The material proposed for this study was “Burlap” or “Hessian, a woven fabric made from a jute plant. Thus, the present study investigated the effects of burlap on the mechanical and microstructural properties of burlap fiber-reinforced concrete.
Materials and methods
Materials
Cement
Ordinary Portland cement (OPC) was used in this study. Portland cement is a mixture of calcium, silicon, and aluminum oxides. The four main chemical compounds are tricalcium silicate (3CaO·SiO2), dicalcium silicate (2CaO · SiO2), tricalcium aluminate (3CaO · Al2O3), and tetra-calcium aluminoferrite (4CaO · Al2O3Fe2O3). The relative proportions of these compounds vary depending on the specific properties of the required cement. It also contains small amounts of uncombined lime and magnesia, together with alkalis and a very small number of other elements. Portland cement can gain early compressive strength of 17.63 MPa at 2 days and standard strength of 43.65 MPa at 28 days. The initial and final setting times for Portland cement were 76.30 min and final 152.0 min, respectively). The fineness of Portland cement, often measured on a specific surface, is approximately 4310 cm2/g (as measured by the Blaine method), while its soundness is 8.50 mm (as measured by the Lee–Chatlier expansion method). Portland cement is the most commonly used type of cement. 20 The ordinary Portland cement used in this study meets all the requirements of the ASTM C150 Standard Specification for Portland cement (AASHTO M 85).
Aggregates
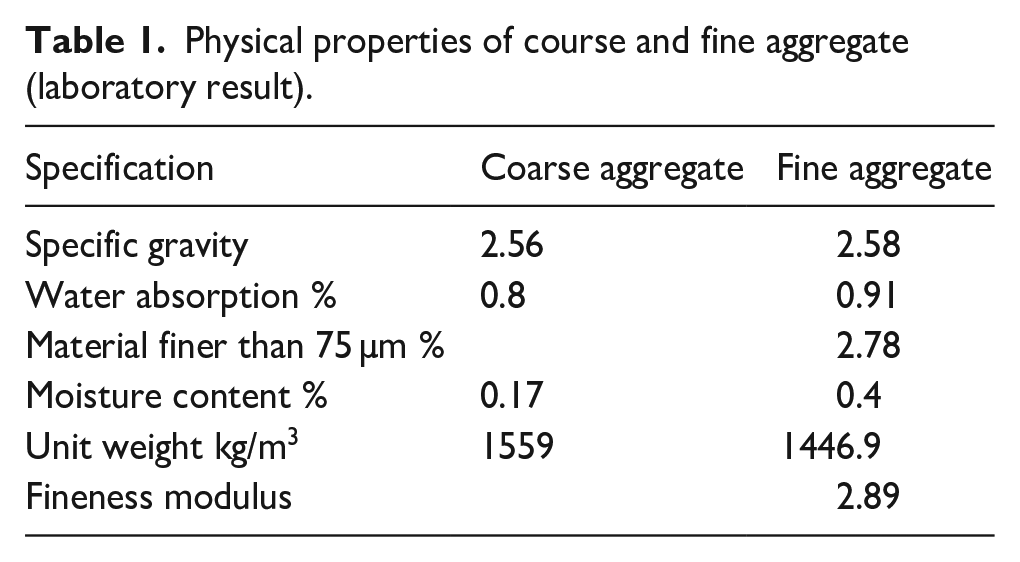
In this study, crushed natural aggregates were used as coarse aggregates. Natural River sand with a particle size of 14″ or smaller was used as a fine aggregate. To determine the physical characteristics of the coarse and fine aggregates, laboratory tests were performed in accordance with aggregate standards (AASHTO T84-85/ASTM C-127 and 142 for coarse aggregate and AASHTO T84-85/ASTM C-128 and 142 for fine aggregate). Gradation (sieve analysis), specific gravity, absorption, silt content, moisture content, and unit weight were tested. Table 1 shows the physical properties of the course and fine aggregates used in this study. Figures 1 and 2 show the particle size distributions of the coarse and fine aggregates, respectively.
Physical properties of course and fine aggregate (laboratory result).

Particle size distribution curve for coarse aggregate.

Particle size distribution curve for fine aggregate.
Burlap fiber
Burlap is a heavy plain-woven fabric composed of vegetable fibers. They are widely used for bagging and wrapping. It is known by different names such as burlap in the USA and Canada, Hessian in the UK, and crocus in the Caribbean region. Burlap is available everywhere in different forms because it is functional for human beings in their daily lives. A burlap factory exists in Ethiopia.
The burlap fibers used for this study came from burlap bags manufacturing site that wasted during production. The burlap bags were of different sizes, with a thickness of 1 mm. Therefore, burlap bags were cut into pieces of the required length. Figure 3 shows a photograph of the burlap used in this study.

Burlap fiber woven and cut pieces (own picture).
Methods
Experimental set up and design
The experiment was conducted at the Dire Dawa University laboratory in Dire Dawa, Ethiopia. Five levels of burlap fiber content (%wt.) Initially, 0.1%, 0.35%, 0.60%, 0.85%, and 1.1% were considered in this study. For each level of fiber content, the workability of concrete was tested using the slump test as per the American Standard Test Method (ASTM C143). This was done to ensure that the standard requirements for the workability of concrete were attained for fiber contents. Based on the results of the slump test, the levels of fiber contents meeting the standard requirement (25–50 mm) were selected and used as treatment levels for further experimentation. In the experiment, in addition to the above five levels of fiber content, 0% (no fiber) was included as a control. To study the effect of the fiber content on the compressive strength, tensile strength, and water absorption of concrete, the experiment was designed in a completely randomized design with three replications. However, for permeability and microstructural properties, the experiment was based on a single sample for each level of fiber content for simple descriptive statistics and qualitative assessment. Except for the treatments, all other conditions (mix design, concrete mixing methods and procedures, laboratory procedures, curing methods, and tests) were kept similar for all concrete samples.
Sample preparation
The following procedures were used to prepare the experimental units (C25 concrete samples) with the required number, shape, and size for different tests. First, the concrete mix design was determined for C-25 MPa concrete according to the ACI 211.1 method. The mix proportioning was calculated from the perspectives of weight. The mix ratio for the ingredients was 1:1.97:2.72 (cement, sand, and aggregate). A water-cement ratio (w/c) of 0.51 was used. In addition, the amounts of coarse aggregate, fine aggregate, cement, and water for all trial mixes were kept unchanged. Then, the fibers were cut to pieces of the required size (15 mm), and the required amount of fiber for the corresponding level of fiber content was prepared. A fiber length of 15 mm was adopted from previous studies for optimal performance.15,21 Subsequently, the required amount of burlap fiber was mixed with fine and coarse aggregates and then poured into the mixer for 2 min by dry mixing with cement to ensure uniform distribution of fiber. Water was then added for wet mixing. This was performed for each treatment level, except for the control. Finally, the samples of concrete specimens were cast in the required sizes, shapes, and numbers, as per the ASTM C143 Standard. Accordingly, three cube samples each with a mold size of 15 cm × 15 cm for the compressive strength test, three cylindrical samples with a dimension of 15 cm diameter × 30 cm height for the split tensile strength test, three cylindrical samples with a dimension of 15 cm diameter × 30 cm height for the water absorption test, and one cylindrical concrete sample each with 17.5 cm × 18.5 cm × 15 cm for the permeability test were cast for each level of fiber content. The specimens were then water-cured for 7, 14, and 28 days and air-dried for 24 h. before testing.
Tests
In this study, a number of tests were conducted to quantify the mechanical, microstructural, and durability parameters of concrete.
Workability of concrete
Slump tests were performed to ensure that the samples met the standard workability level for concrete.
Mechanical strength of concrete
A crushing load test was conducted for the concrete samples (at 7, 14, and 28 days after watering curing). The crushing loads were measured using a compressive and tensile testing machine (model DYE-20000) after calibration. Concrete samples were tested at 7, 14, and 28 days to ensure data quality according to the requirements of the standard BS: EN 206-2013.
Durability of concrete
Water absorption and permeability tests were performed to assess the durability of the concrete. The water absorption of the concrete samples was tested according to the standard, BS 1881-122:2011 Testing Concrete. It refers to the amount of water that seeps into the concrete samples when submerged in water. The permeabilities of the concrete samples were tested under an applied water pressure of 1.0 MPa for 72 h. Impermeability is expressed by the anti-permeability level, P, which is established by the highest water pressure (MPa) that a standard specimen can withstand when it is impermeable at the age of 28 days through necessary testing. Based on the impermeability level P, the impermeability standard classes P6, P8, P10, and P12 were used.
Microstructure properties of concrete
Finally, microscopic and X-ray image analyses were performed to characterize the microstructural properties of the samples. Scanning electronic microscopy (SEM, model JCM-6000) and X-ray diffraction (XRD, Model XRD-7000) were used to characterize the microstructural properties of the concrete samples. Microstructural images of the concrete samples for the three selected levels of fiber content were taken and analyzed. Three levels of fiber content were selected based on their effects on the mechanical properties. SEM provides an image of both low and high resolution for the powdered concrete specimen. For these reasons, the cube samples were crushed after they were subjected to compression and tensile tests. The deepest core of the concrete cube sample was used together with the hydrated concrete powder. The crushed samples were sieved using a 450 µm sieve after being collected. All images were scanned at an acceleration voltage of 15 kV as per the ASTM C1723 standard. For the XRD analyses, a rapid analytical technique was used to identify and quantify the crystalline phases present in the material. XRD analysis is a powerful non-destructive technique used to identify the crystalline phases present in a material, thereby revealing chemical composition information. The identification of phases was achieved by comparing the acquired data to those in reference databases, as per the ASTM C1365 standard.
Data analysis
Analysis of variance (ANOVA) was carried out using R 4.2.3 software to identify if the different levels of Burl fiber have statistically significant effects on the compressive and tensile strengths of concrete and water absorption. The test results at 28 days were used for the analysis. The least significant difference (LCD) test was used to compare the treatment mean values with the mean control treatment. The interpretation of the ANOVA and LSD test results is based on the level of significance or probability of the null hypothesis being true (probability of means having no significant difference). A 95% confidence level (p < 0.05) is often sufficient for many laboratory and field experiments in different disciplines. Therefore, a 95% confidence level (at α = 0.05 or p < 0.05) was used to interpret the results of this study.
To determine the optimal level of fiber, the results from ANOVA were further compared with the results from descriptive and qualitative analyses of microstructural properties and permeability test results. The results from microscopic and X-ray image analyses were also visually analyzed and interpreted to select the optimal fiber content.
Results and discussion
Slump test result
A slump test was carried out to screen the fiber contents that can achieve optimal workability. The slump test results for different levels of fiber content were in the range of 25–50 mm. According to ASTM C143, the Standard requirements for the workability of concrete for foundations, slabs, beams, columns, etc., can be fulfilled when the slump test results are in the range of 25–50 mm. The slump test results showed that the fiber content under consideration ((% wt.): 0.1%, 0.35%, 0.60%, 0.85%, and 1.1%) can meet the standard requirements for workability. Therefore, all levels of fiber content were selected for the experimental investigation.
Effects of burlap fiber on compressive strength of concrete
The average compressive strengths (at 28 days) for the different burlap fiber levels are listed in Table 2. As shown in Table 2, the compressive strength for different fiber contents varies from 28.41 to 31.05 MPa with an overall mean of 29.61 MPa varying at a coefficient of variation of 2.6%. The presence or absence of a significant effect on compressive strength requires an analysis of variance.
Average compressive and tensile strength, and water absorption for each fiber content.

The results of the analysis of variance (ANOVA) for the compression strength are presented in Table 2. The coefficient of variation (CV) was 3.12%. According to David Machin and Campbell, 22 a CV of less than 5% is acceptable in medical research. Therefore, the CV indicates that the experiment is highly reliable. The results in Table 3 also indicate that the fiber content has no statistically significant (at α = 0.05) effect on the compressive strength of the concrete. This implies that the difference in compressive strength across the samples cannot be explained by the difference in fiber content. In other words, within the ranges of the different levels of fiber content considered in this study, there is insufficient evidence showing that the fiber content affects the compressive strength. However, this does not mean that there is no association or relation between the fiber content and compressive strength; rather, the relationship was not detectable under the experimental setup. Therefore, from a practical point of view, all the levels of fiber content, including the control level investigated in this study, technically perform equally in terms of affecting the compressive strength of concrete. There is no benefit or harm with respect to the compressive strength associated with the addition of burlap fiber.
Analysis of variance (ANOVA) table for compressive strength.

ns: not significant.
CV = 4.12 and Sig. Codes – 0 “***” 0.001 “**” 0.01 “*” 0.05 “.” 0.1 ‘’ 1.
Effects of burlap fiber on split tensile strength of concrete
The 7th and 28th days samples of curried concrete have both had their split tensile strength tested. and the result has been combined as follows in Figure 4, Tables 4, and 5. The control mix gained a split tensile strength of 3.12 MPa after 28 days of curing, and the burlap fiber concrete samples with a fiber content of 0.1%, 0.35%, 0.60%, 0.85%, and 1.1% has gained strength of 3.13, 3.21, 3.44, 3.19, and 3.18 MPa respectively. The result compared with the control mix in percent and 0.1%, 0.35%,0.60%, 0.85 and 1.1% burlap fiber have +0.32%, +2.88%, +10.26%, but burlap contained 0.85% has gained equal strength to the control and the trial mix burlap contain 1.1% gained less strength −0.64% than the control mix. To test the statistical significance Analysis of Variance (ANOVA) was tested and the result is presented in Table 6.

Tendency of burlap fiber on split tensile strength.
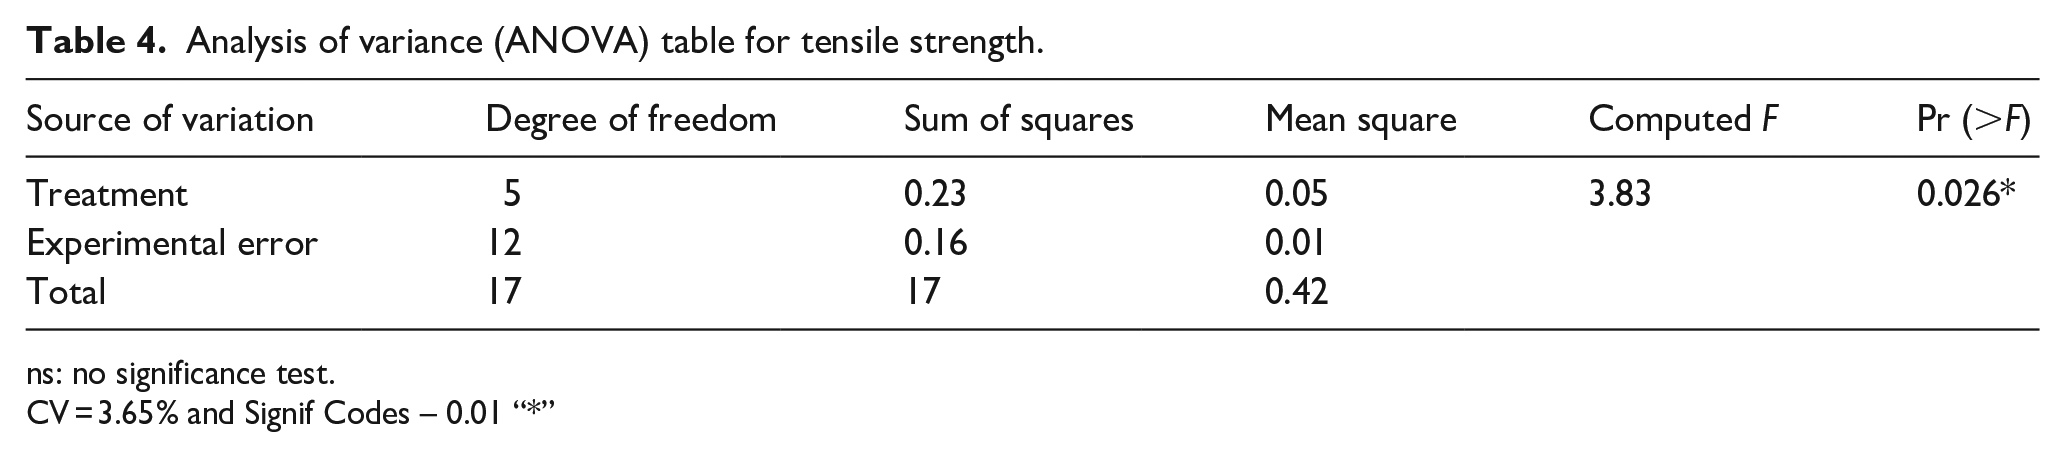
Analysis of variance (ANOVA) table for tensile strength.
ns: no significance test.
CV = 3.65% and Signif Codes – 0.01 “*”
Difference in mean tensile strength between the control and other fiber contents.

ns: no significance test.
significance at α = 0.05.
Analysis of variance (ANOVA) table for water absorption.

ns: no significance test.
CV = 3.92% and Signif Codes – 0 “***” 0.001.
The average tensile strengths at 28 days for different levels of burlap fiber are listed in Table 2. As shown in the table the tensile strength over the different fiber contents varies from 3.10 to 3.44 MPa with an overall mean of 3.19 MPa varying at coefficient of variation of 3.48%. It should be noted that higher coefficients of variation were found for tensile strength than for compressive strength. This indicates that the effect of the fiber is more prominent on the tensile strength of the concrete than on the compressive strength. However, the presence or absence of a significant effect on tensile strength requires an analysis of variance.
The results of the analysis of variance (ANOVA) for the tensile strength are presented in Table 4. The coefficient of variation (CV) was 3.65%. According to David Machin and Campbell, 22 CV of < 5% is acceptable in medical research. Therefore, the CV indicates the experiment is highly reliable. The results shown in Table 4 also indicate that the fiber content has a statistically significant (α = 0.05) effect on the tensile strength of the concrete. This means that the difference in tensile strength across the samples can be explained by the difference in the fiber content. To quantify the effect of different levels of fiber content relative to the control treatment and identify the optimal fiber content, mean comparisons should be made.
The results of the mean comparisons performed using the least significant difference method are presented in Table 5. The results showed that all levels of fiber content except 0.6% showed no significant difference compared to the control (0% fiber). However, the 0.6% fiber content showed a significant difference (improved tensile strength) compared to the control fiber content. This means that there is practically no detectable benefit in adding fiber to the concrete for levels other than 0.6%. Although there is statistical evidence, a rise in fiber content from 0.1% to 0.6% showed a tendency to enhance tensile strength, but a rise in fiber content beyond 0.6% showed a tendency to reduce tensile strength.
Effects of burlap on water absorption of concrete
The average water absorption of the concrete samples (at 28 days) for different levels of burlap fiber is listed in Table 6. As shown in the Table 2, the water absorption for the different fiber contents varied from 3.68% to 5.57%, with an overall mean of 4.81%, varying at a coefficient of variation of 13.56%. It can be noted that higher coefficients of variation were found for water absorption than for the compressive and tensile strengths. This indicates that the effect of the fiber is more pronounced in the water absorption capacity of the concrete than in the relative compressive strength and tensile strength. However, the presence or absence of a significant effect on water absorption requires an analysis of variance.
The result in Figure 5 shows that all trial mixes with the addition of burlap fiber have less water absorption characteristics compared with the control mix which shows the fiber does have not a negative impact on the absorption characteristics of the concrete.
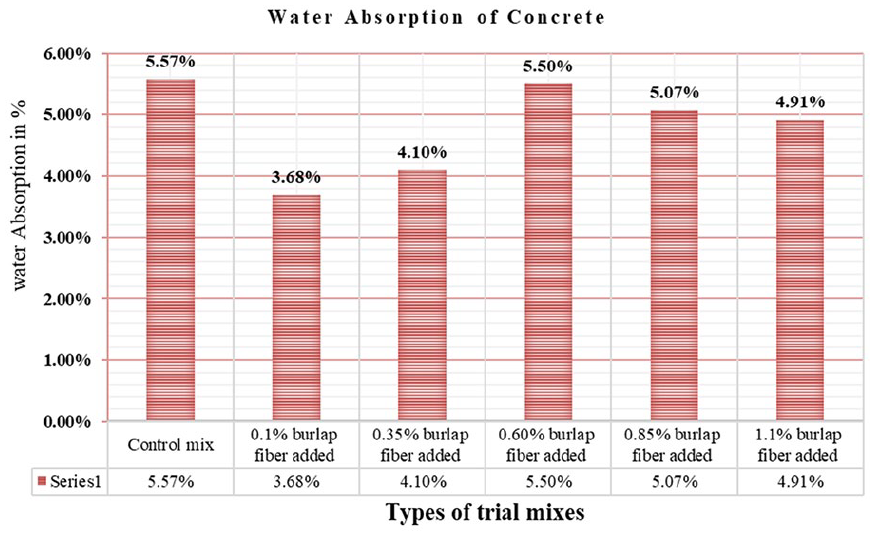
Water absorption of concrete.
The results of the analysis of variance (ANOVA) for water absorption are shown in Table 6. The coefficient of variation (CV) was 3.92%. Therefore, the CV indicates the experiment is highly reliable. The results in Table 6 also indicate that the fiber content has a statistically significant (α = 0.001) effect on the water absorption of concrete. This means the difference in water absorption across the samples can be explained by the difference in fiber contents. To quantify the effect of different levels of fiber content relative to the control and identify the optimal fiber content, mean comparisons should be made.
The results of the mean comparisons performed using least significance are presented in Table 7. The results showed that all levels of fiber content except 0.6% showed significant differences in water absorption (lower than the control) compared to the control (0% fiber). However, for a fiber content of 0.6%, no significant difference (similar) in the water absorption compared to the control fiber content was found. Hence, there is strong statistical evidence that a rise in burlap fiber both below and above 0.6% would decrease water absorption. Yet, as such it might not be desirable to reduce the water absorption beyond the value for the control, it is argued that the water absorption at 0.6% fiber content can be acceptable.
Difference in mean water absorption between the control and other fiber contents.

ns: no significance test.
and ** significance at α = 0.05 and 0.01, respectively.
Hence, Table 7 shows that, there is strong statistical evidence that a rise in burlap fiber both below and above 0.6% would decrease water absorption. Yet, as such it might not be desirable to reduce the water absorption beyond the value for the control, it is argued that the water absorption at 0.6% fiber content can be acceptable. In conclusion, the main objective of the study is to improve the tensile strength of the concrete, but this should be done without affecting the concrete compressive strength and the negative effect on water absorption. So, as you can see in the above Table 2, higher tensile strength 3.44 MPa were registered on 0.60% Burlap fiber content compared to the control mix 3.12 MPa. Comparatively, the compressive strength of 0.60% Burlap fiber content 29.97 MPa is also higher than the control mixes 29.45 MPa and the water absorption value is also lesser than the control mix (5.55% < 5.57%). Therefore, 0.60% Burlap fiber content is the most favorable mix to achieve the study aims.
Effects of burlap fiber on the permeability of concrete
For assessing the effect of fiber on the permeability concrete, measurements were taken for each fiber content. The results given in Table 8 below shows that permeability class for all concrete sample are same despite the numerical difference in measurement, indicating the concrete samples for varying fiber content exhibit similar permeability characteristics. The impermeability class (P6), indicates that the concrete is not porous and can withstand water pressures of 0.6 MPa.
The permeability test results.

Microstructural analysis
To assist in the selection of optimal fiber content, the two levels of fiber content that have shown better performance in affecting the key mechanical properties of the concrete (in this case, the tensile strength of concrete) and the control mix were selected for microstructural image analysis using Scanning Electron Microscopy (SEM) analysis and X-ray diffraction analysis. The three levels of fiber content selected were the control mix, 0.35, and 0.6% (wt) fiber. The results of each analysis are presented in the following sections.
Scanning electron microscopic (SEM) analysis
SEM images created via backscattered electron (BSE) imaging were used to visualize the microstructural features of the concrete. As shown in the figures below (Figures 6–8), concrete samples with burlap fibers have denser and less discontinuous pores than concrete without burlap fibers. The density of the concrete improved with the fiber content. Because the burlap fiber is distributed uniformly on the concrete mix, the crack is affected by the resistance stress field around the burlap fiber. Therefore, the stress concentration at the crack is reduced. The burlap fiber plays a role in the concrete mix by reducing the occurrence of cracks and reducing the concentration of existing cracks. It also achieved strength and cracking resistance properties in concrete.

SEM micrograph for control mix (2000× magnification).

SEM micrograph for 0.35% burlap fiber (2000× magnification).

SEM micrograph for 0.60% Burlap fiber (1000× magnification).
X-ray diffraction analysis
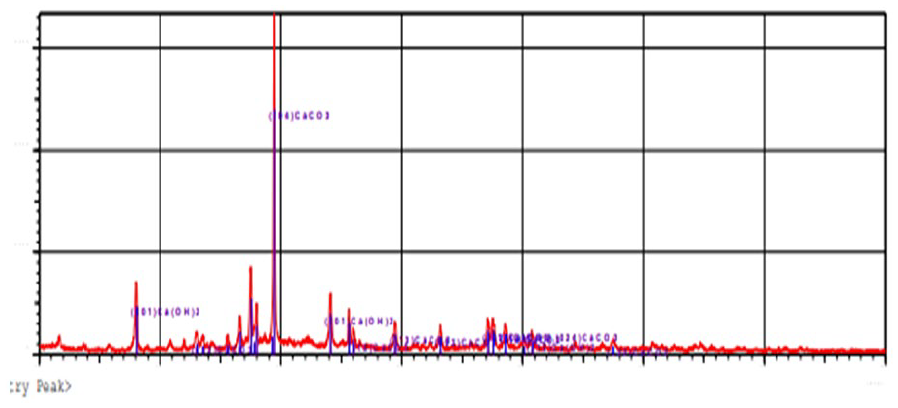
The XRD results for the peak intensity components and peak width of the three selected samples are presented in Figures 9–11 revealed that the peak-intensive particles in the XRD patterns of the three samples were calcium carbonate (CaCo3); however, for the 0.60% fiber content, CaCO3 was more intense and its peak width was more crystalized relative to the other two mixes. The strength of the concrete was increased by the calcium carbonate. In addition, it stimulates the self-compacting qualities of concrete and enhances its particle packing and spacer effects. Additionally, calcium carbonate enhances permeability in concrete by lowering porosity and air voids.2,3,23

X-ray diffraction analysis for control mix.
X-ray diffraction analysis for 0.35% burlap fiber content.

X-ray diffraction analysis for 0.60% fiber content.
In addition, for the two samples in the control mix and the mixture with 0.60% fiber content, silicon dioxide (SiO2) was the second peak intensive particle, but for the 0.60% fiber content, the peak width was greater than that of the control mix samples. SiO2 can enhance the interface strength and refine the pores, thereby effectively reducing the water permeability of concrete. Accordingly, in the XRD report, the mixed 0.60% fiber content was denser in the particles. This can enhance the density and thereby reduce the porosity of concrete, making it more durable and stronger like steel and glass fibers.13,18,24,25 Burlap fibers have good shear tensile strength and immense stress resistance,26–29,30 these leads to improve the structural integrity of concrete.
Conclusion and recommendation
It can be concluded that a burlap fiber content in the range of 0.1%–0.85% (wt) can produce workable fresh concrete. In this range of burlap fiber, the fiber content has no statistically significant effect on compressive strength but has statistically significant effect on tensile strength and water absorption for C25 concrete. Specifically, for C25 concrete, all five levels of fiber content (0.1%, 0.35%, 0.60%, 0.85%, and 1.1%) in this study showed no effect on compressive strength. Similarly, all levels of fiber content, except 0.60%, showed no statistically significant effect on the tensile strength. All levels of fiber content, except 0.60%, showed a statistically significant effect on water absorption (all levels resulted in lower water absorption relative to the control). For burlap fiber of 0.6% (wt), a compressive strength equivalent to control mix (0% fiber) was achieved but statistically significant, and highest improvement relative to the control mix in tensile strength and water absorption was achieved for C25 concrete. The results from the permeability test and microstructural analysis of images also further confirm that the fiber content of 0.6% (wt) can ensure more strong and durable concrete. At 0.6% fiber content, concrete can achieve a compressive strength of 29.97 MPa, tensile strength of 3.44 MPa, water absorption of 5.55%, and permeability of 0.6 MPa. Tus, among the different levels, 0.6% (wt) burlap fiber of has shown superior performance. Therefore, it is recommended to use 0.6% burlap fiber to enhance the tensile strength significantly (by about +3.8% relative to the control), yet maintaining similar compressive strength and water absorption with conventional C25 concrete.
Supplemental Material
sj-pdf-1-jef-10.1177_15589250241281933 – Supplemental material for Effects of locally available burlap fiber on the mechanical and microstructural properties of concrete, Ethiopia
Supplemental material, sj-pdf-1-jef-10.1177_15589250241281933 for Effects of locally available burlap fiber on the mechanical and microstructural properties of concrete, Ethiopia by Yohannes E Gebreegziabher, Werku Koshe Hareru and Solomon Mulugeta in Journal of Engineered Fibers and Fabrics
Supplemental Material
sj-pdf-2-jef-10.1177_15589250241281933 – Supplemental material for Effects of locally available burlap fiber on the mechanical and microstructural properties of concrete, Ethiopia
Supplemental material, sj-pdf-2-jef-10.1177_15589250241281933 for Effects of locally available burlap fiber on the mechanical and microstructural properties of concrete, Ethiopia by Yohannes E Gebreegziabher, Werku Koshe Hareru and Solomon Mulugeta in Journal of Engineered Fibers and Fabrics
Supplemental Material
sj-pdf-3-jef-10.1177_15589250241281933 – Supplemental material for Effects of locally available burlap fiber on the mechanical and microstructural properties of concrete, Ethiopia
Supplemental material, sj-pdf-3-jef-10.1177_15589250241281933 for Effects of locally available burlap fiber on the mechanical and microstructural properties of concrete, Ethiopia by Yohannes E Gebreegziabher, Werku Koshe Hareru and Solomon Mulugeta in Journal of Engineered Fibers and Fabrics
Footnotes
Acknowledgements
We extend our gratitude to the Ethiopian Ministry of Education on behalf of the Dire Dawa University Institute of Technology for providing the opportunity to conduct this research through sponsorship. Secondly, we would like to thank the editors and reviewers for their precious time spent to review, and valuable comments.
Authors’ contributions
Availability of data and material
The author will provide the requested data upon request, in a formal manner.
Declaration of conflicting interests
The author(s) declared no potential conflicts of interest with respect to the research, authorship, and/or publication of this article.
Funding
The author(s) received no financial support for the research, authorship, and/or publication of this article.
Ethics approval and consent to participate
Not applicable.
Consent for publication
Not applicable.
Supplemental material
Supplemental material for this article is available online.
References
Supplementary Material
Please find the following supplemental material available below.
For Open Access articles published under a Creative Commons License, all supplemental material carries the same license as the article it is associated with.
For non-Open Access articles published, all supplemental material carries a non-exclusive license, and permission requests for re-use of supplemental material or any part of supplemental material shall be sent directly to the copyright owner as specified in the copyright notice associated with the article.