
Abstract
It is difficult to prepare Ti2Ni alloys using traditional single-wire arc additive manufacturing. In this study, a Ti2Ni alloy wall was fabricated in situ by double-wire arc additive manufacturing with pure Ti and Ni wires, and the resulting material has the potential to be applied to spacecraft and ground armor protection. In the stable region, the Ti: Ni content ratio was close to 2:1 after stabilization, indicating that the as-built wall was very close to the designed composition (Ti2Ni). From the top of the wall to the substrate, the microstructure evolved as follows: Ti2Ni + NiTi → Ti2Ni + NiTi + α-Ti → α-Ti + Ti2Ni. In the stable region, the hardness remained stable at approximately 660 HV0.5.
Introduction
Ti2Ni intermetallic compounds with high strength and hardness exhibit good ductility owing to their face-centered cubic crystal structure, which leads to broad application prospects in the fields of spacecraft protection, ground armor protection, and mechanical engineering. 1 Traditional manufacturing methods for Ti2Ni alloys, such as casting and powder metallurgy, have disadvantages such as high cost, long periods, time-consuming manufacturing, and limitations in the fabrication of parts with complex geometries.2,3 In addition, Ti2Ni alloy is difficult to draw due to its brittleness, and thus there is no Ti2Ni welding wire. It is difficult to prepare Ti2Ni alloys with large and complex shapes using traditional single-wire WAAM technology. To solve above problems, the double-wire arc additive manufacturing (D-WAAM) method was applied for the fabrication of Ti2Ni alloys. D-WAAM technology uses an electric arc as a heat source and two wires as feedstocks, which adds layers of material guided by a digital model to fabricate a wall.4,5 During the D-WAAM process using different wires, an in-situ alloying reaction occurs between the atoms.6–8 The fabrication of intermetallic walls by in situ alloying has been demonstrated to be feasible. A Ni-rich NiTi alloy was in-situ fabricated successfully with different substrate heating temperatures using pure Ni and Ti wires by D-WAAM technology.9–11 Fe3Al intermetallic walls were fabricated by the D-WAAM process using in-situ alloying with different post-production treatments. 12 TiAl alloys with high mechanical properties were fabricated successfully using pure Ti and Al wires as the feedstocks by D-WAAM technology.13,14 Therefore, D-WAAM technology has a potential for preparing intermetallic compounds without the corresponding composition wire.
In this study, it is the first time D-WAAM was used to fabricate Ti2Ni alloy through in situ alloying with pure Ti and Ni wires. This study focused on the Ti2Ni alloy, which has not yet been produced as a bulk material. The microstructure and its effects on the mechanical properties of as-built wall were studied in detail.
Materials and methods
In this study, the wire feedstocks were pure Ti and pure Ni wires with diameters of 1.2 mm. The angle between Ti and Ni wires is 90°. Ti-6Al-4V alloy was used as a substrate with a dimension of 300 mm × 300 mm × 6 mm. The substrate was heated to 400°C by a heating blanket. The temperature is measured by a thermocouple. The interlayer residence time is 120 s. The chemical compositions of materials, equipment schematic diagram, and sampling locations were the same as the reference. 10 The process parameters were a current of 120 A, voltage of 9 V, travel speed of 150 mm/min, heat input of 260 J/mm, pure Ar flow rate of 15 L/min, and wire feed speeds of pure Ti and Ni wires of 1500 mm/min and 70 mm/min, respectively. The walls prepared using D-WAAM consisted of 10 layers. A metallographic specimen from the wall was etched by Kroll's reagent (HF: HNO3: H2O = 1: 3: 46) for 50 s. The phase compositions of the wall were identified by an X-ray diffractometer (XRD). The microstructure was examined using an optical microscope, scanning electron microscope (SEM) equipped with an energy-dispersive spectroscopy (EDS) system and transmission electron microscopy (TEM). TEM specimen was obtained from top region of as-built wall. The hardness in the deposition direction of the walls were measured with the load of 200 g and dwell time of 15 s. At room temperature, the compression tests were performed on three specimens with a dimension of ϕ 4 mm × 8 mm. The compression rate was 0.5 mm/min.
Results and discussion
Phase identification
A Ti2Ni alloy wall was fabricated using the D-WAAM system with pure Ti and Ni wires. Figure 1(a) shows the cross-section of the as-built wall. No obvious pores and cracks were found in the cross-section. Along the building direction, mapping EDS analysis was performed, and the distribution of the elemental content was obtained, as shown in Figure 1(b). The wall consists of a dilution-affected region and a stable region. The dilution-affected region was in the range of 0–5 mm from the substrate, and this region was formed due to the remelting of the Ti-6Al-4V substrate. In the dilution-affected region, the Ti content is decreased, and the Ni is increased. The Ti content decreased from 90 at.% to 70 at.%, while the Ni content increased from 10 at.% to 35 at.%. Ni: Ti atomic ratio is different from the designed ratio in dilution-affected region. In the stable region, the Ti and Ni contents were stable at 70 at.% and 35 at.%, respectively. The Ti: Ni ratio was close to 2:1 in stable region, indicating that the as-built wall was very close to the designed composition (Ti2Ni). Therefore, it is feasible to fabricate Ti2Ni alloy using D-WAAM with pure Ti and Ni welding wires through in situ alloying.
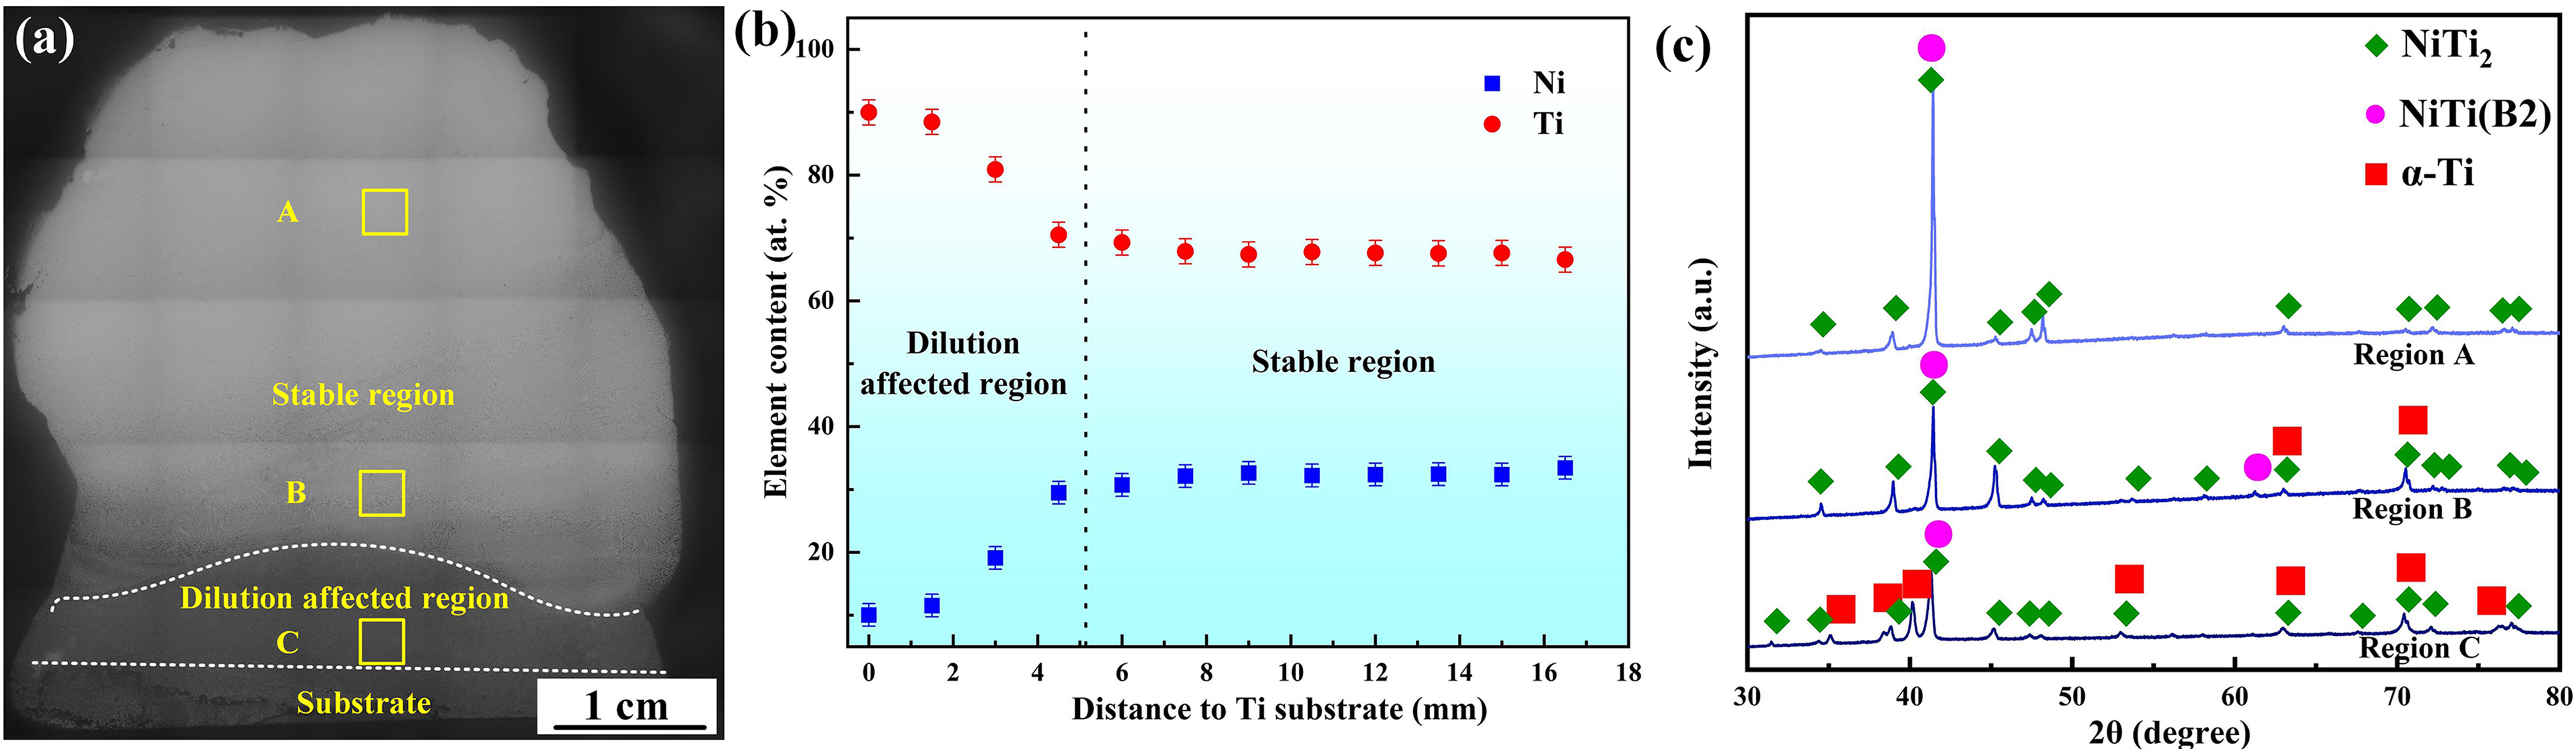
(a) Cross-section of as-built wall, (b) distribution of element content, and (c) XRD results.
In the XRD results shown in Figure 1(c), Ti2Ni, NiTi, and α-Ti phases were identified. In region C, α-Ti and Ti2Ni phases were detected. During the deposition of the first layer, the Ti-6Al-4V substrate melted, leading to sufficient Ti atoms in the molten pool. According to the Ni-Ti diagram, α-Ti is formed under rich-Ti conditions. 15 In the middle, Ti2Ni, NiTi(B2), and α-Ti were found. The remelting of deposition layers led to the occurrence of α-Ti in region B. In region A, only Ti2Ni and NiTi(B2) were detected and no unreacted Ti or Ni are detected, indicating that pure Ti and Ni reacted sufficiently in the weld pool. Besides, a mapping result of region A is shown in Figure 2, indicating that only Ti and Ni elements are detected and no other elements were found. The contents of Ni and Ti are 67.62 at.% and 32.38 at.%, respectively. Thereby, in region A, the microstructure and composition are close to the designed Ti2Ni alloy. Notably, the intensity of Ti2Ni was relatively strong compared with that of other phases at the top and middle, indicating the Ti2Ni was dominant. Ti2Ni was identified as the matrix. As the distance from the bottom to the top increased, the intensity of α-Ti decreased and that of Ti2Ni increased. α-Ti disappears in stable region due to the sufficient reaction between Ti and Ni atoms.
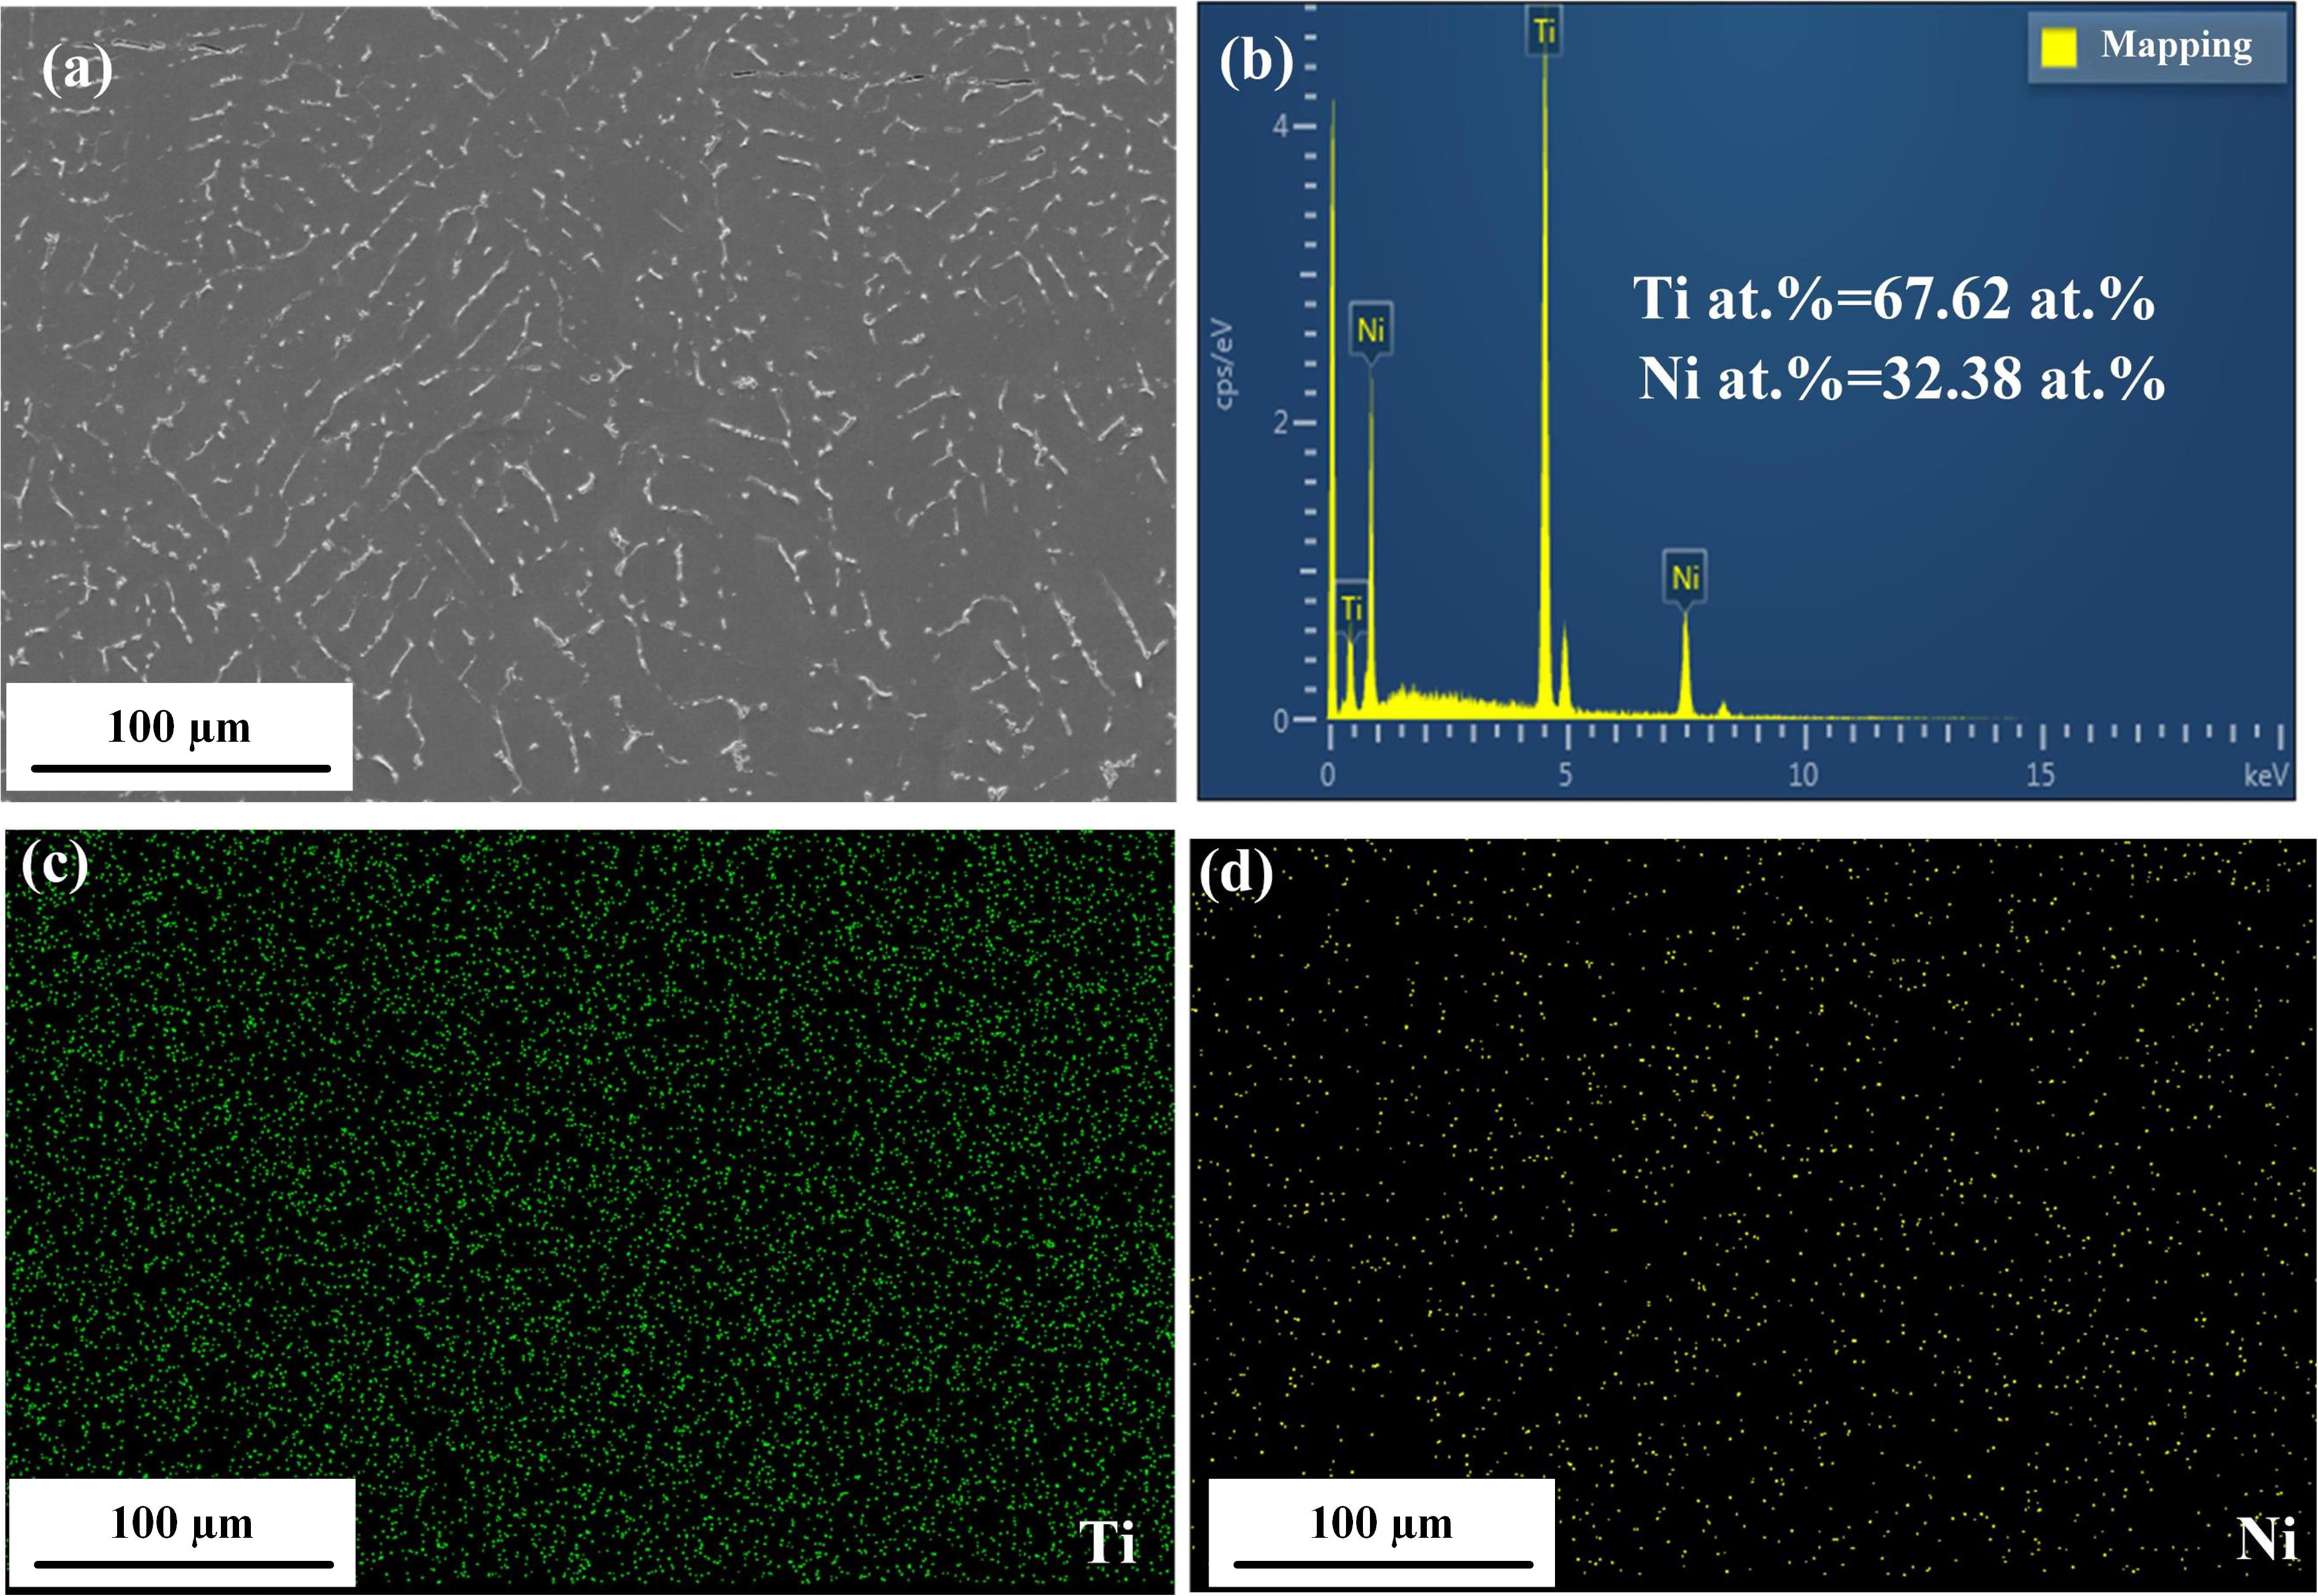
EDS mapping of area A: (a) SEM image, (b) spectral distribution in Figure 2(a), (c) Ti distribution, and (d) Ni distribution.
Microstructure evolution
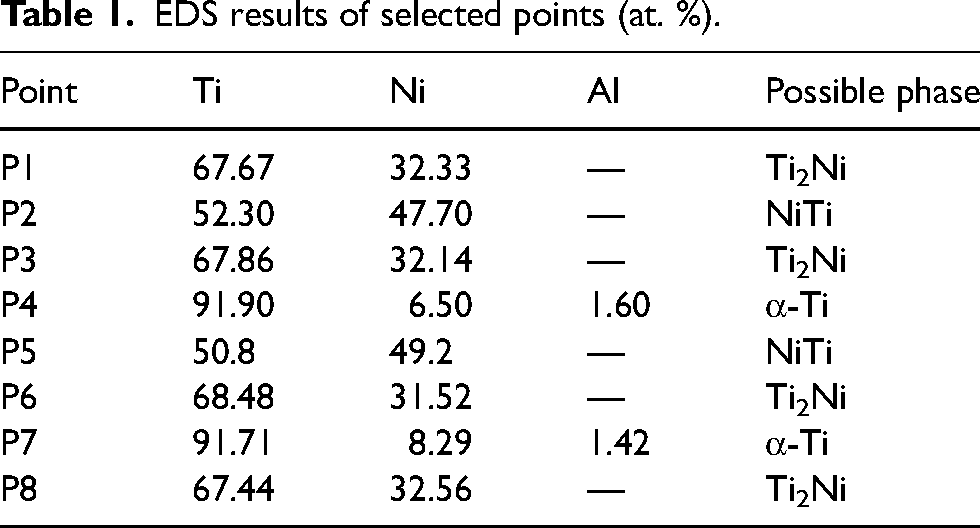
Figure 3 shows the microstructure morphology at different locations in Figure 1(a). In region A, as shown in Figure 3(a), the white precipitated phase is distributed in the matrix. According to the EDS results in Table 1, the matrix (P 1) is Ti2Ni and the white precipitated phase (P 2) is the NiTi phase. In region A, the volume fraction of NiTi is ∼4.3%, and the volume fraction of Ti2Ni is ∼95.7%. In region A, the element content was close to the designed composition. Region A was selected for TEM experiment. According to the TEM analysis in Figure 3(d), Ti2Ni and NiTi(B2) are formed in region A, and the matrix can be identified as Ti2Ni, which is in accordance with the XRD results. Figure 4 shows the dark field which reveals the distribution of precipitated phase (NiTi) in region A. The formed NiTi (B2 phase) is equiaxial structure. According to TEM result in Figures 3(d) and 4, the size of NiTi is between 100 and 500 nm. The volume fraction of NiTi (B2) phase is ∼3.5% in TEM (Figure 4(a)), which is closed to that in SEM. Gibbs free energy of Ti2Ni phase is lower than that of NiTi phase, which leads to the priority to form for Ti2Ni phase. The sequence of reactions is as follows: 2Ti + Ni→ Ti2Ni, Ti2Ni + Ni→ NiTi. In region B, as shown in Figure 3(b), the microstructure mainly includes a black matrix, gray dendrite and white particle. According to the EDS analysis in Table 1, the black matrix is Ti2Ni, the gray dendrite is the α-Ti phase which is from Ti-6Al-4V substrate, and the white particle is NiTi. In region B, NiTi and α-Ti have a total volume of 42.4%, and the volume fraction of Ti2Ni is 57.6%. In region C, the microstructure mainly includes a gray matrix and precipitated phase with the shape of a strip in Figure 3(c). According to the EDS analysis in Table 1, the gray matrix is α-Ti, and the precipitated phase is Ti2Ni. In region C, during WAAM process, Ni atoms appear in the weld pool with the Ti-rich liquid. Then, the following reaction occurs: (L) → Ti2Ni + L (Ti). In this reaction, almost all Ni atoms are used up and the remaining liquid in weld pool is Ti-rich, which lead to the formation of NiTi2 and α-Ti. Comparing the change about α-Ti in regions A, B, and C, indicates that the amount of α-Ti tends to decrease with an increase in the deposition height. According to Figure 1(b), in the dilution-affected region, the Ti content decreases with an increase in the deposition height, which leads to a decrease in α-Ti. In region C, Ti2Ni and α-Ti are formed. The volume fraction of both is approximate. From the top of the wall to the substrate, the microstructure evolved as follows: Ti2Ni + NiTi → α-Ti + Ti2Ni + NiTi → α-Ti + Ti2Ni.
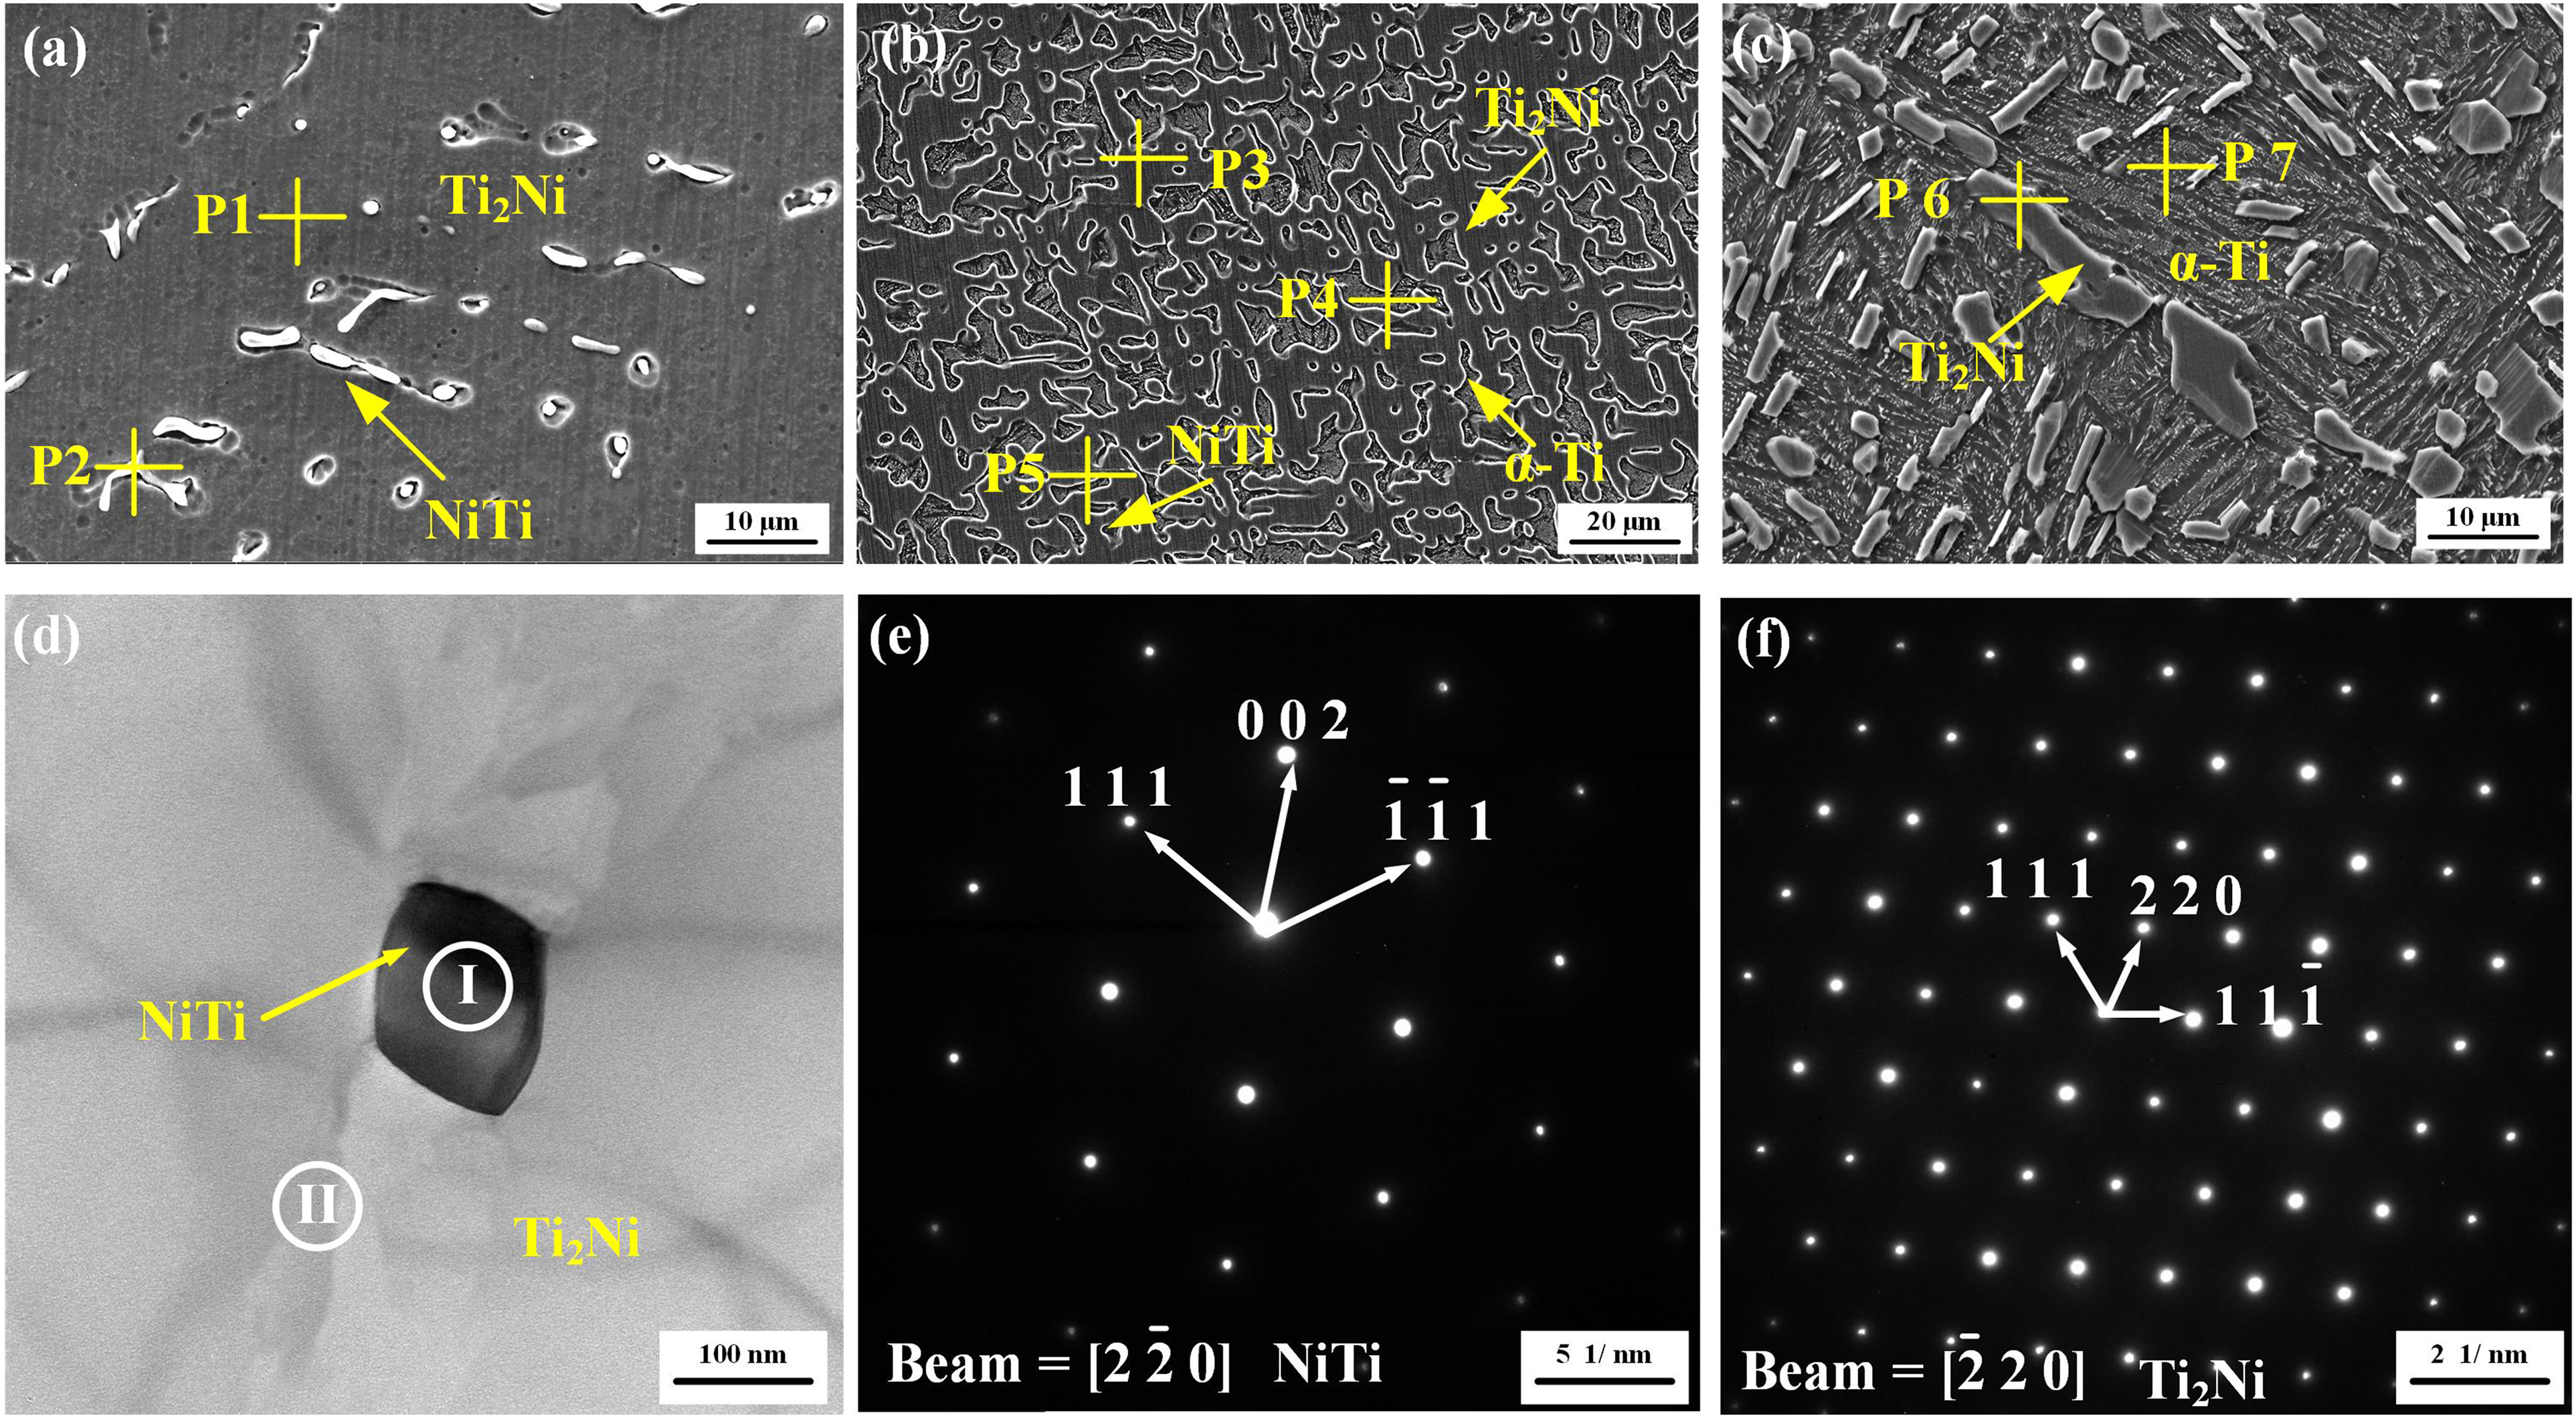
Microstructure: (a)–(c) SEM micrograph in regions A, B, and C in Figure 1, respectively, (d) TEM micrograph with bright field in region A, (e) and (f) electron diffraction pattern of area I and II, respectively.
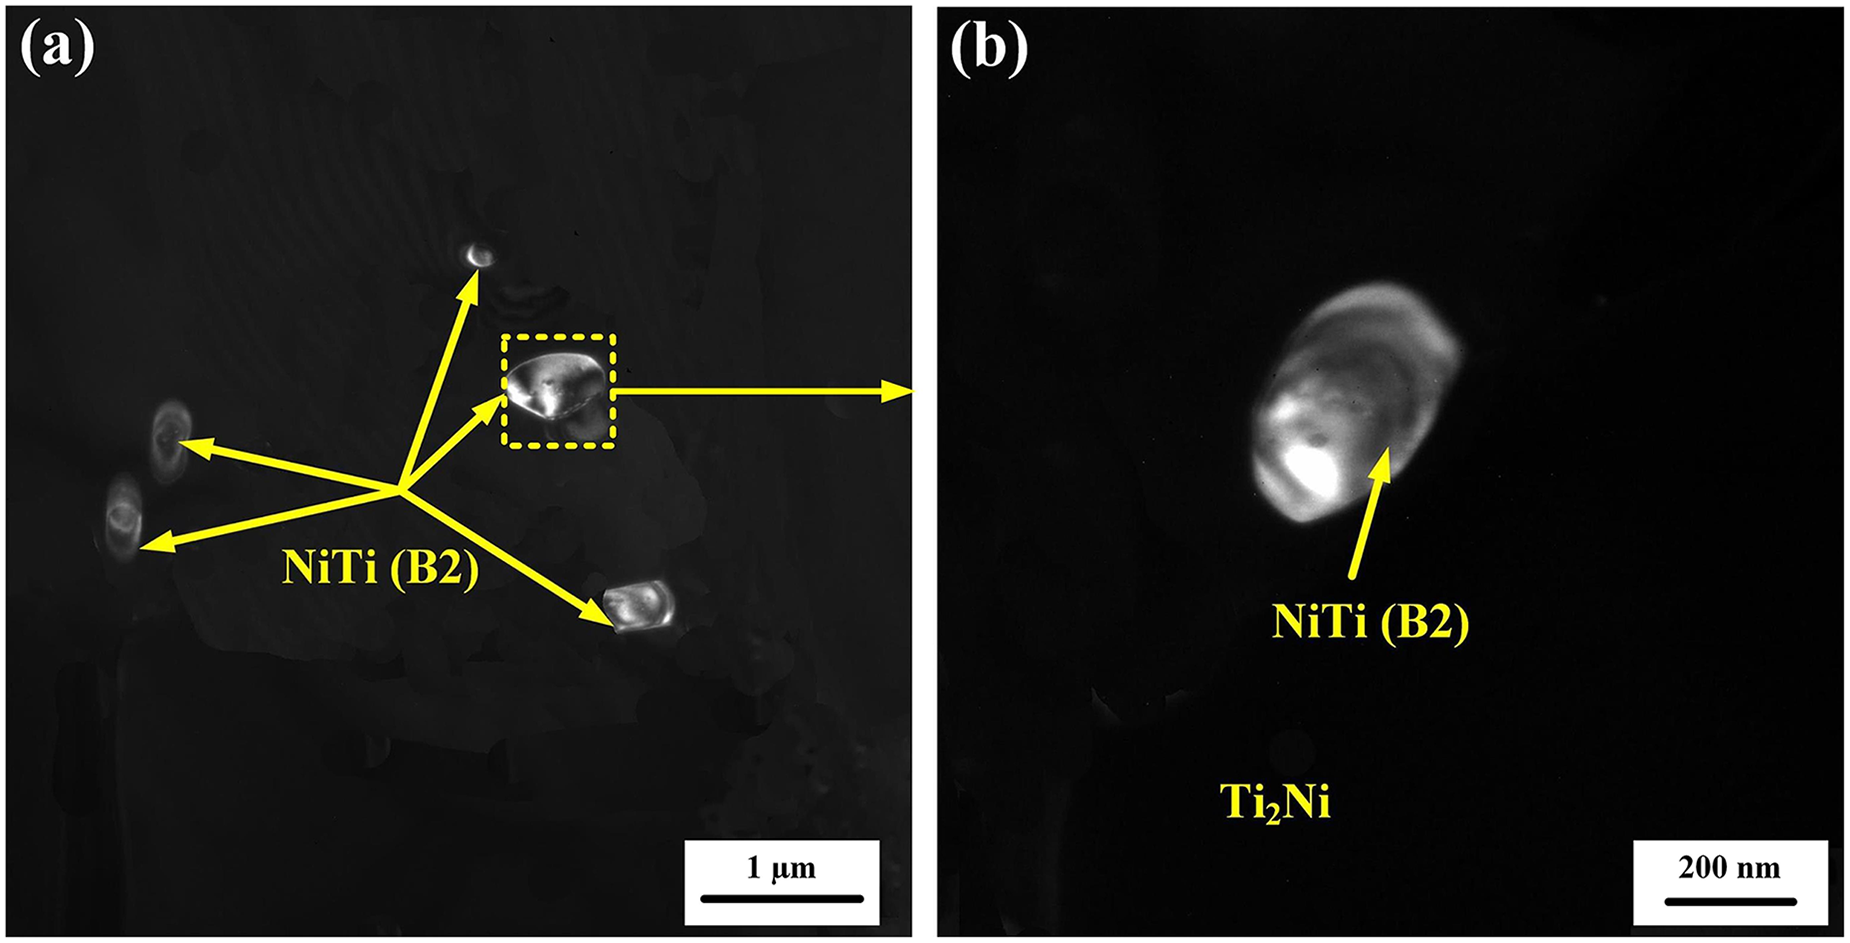
The TEM images in region A: (a) dark field with low magnification and (b) dark field for the square area in Figure 4(a).
EDS results of selected points (at. %).
Properties
Figure 5(a) shows the microhardness distribution. In the dilution-affected region, the hardness of the wall increased from 320 HV0.5 to 600 HV0.5. In the dilution-affected region, the matrix was α-Ti and Ti2Ni as the second phase was formed, which increased the hardness significantly due to the formation of Ti2Ni with a second phase strengthening effect. Due to its proximity to Ti-6Al-4V substrate, the first test point approximated the hardness of the Ti alloy (∼320 HV0.5). 16 With an increase of the distance from Ti-6Al-4V substrate, α-Ti decreases and the formed Ti2Ni increases in the dilution-affected region, which improves effectively the hardness. In the stable region, the matrix is Ti2Ni and NiTi(B2) as the precipitated phase is 4.3%, the hardness of as-built wall remains stable at ∼660 HV0.5.
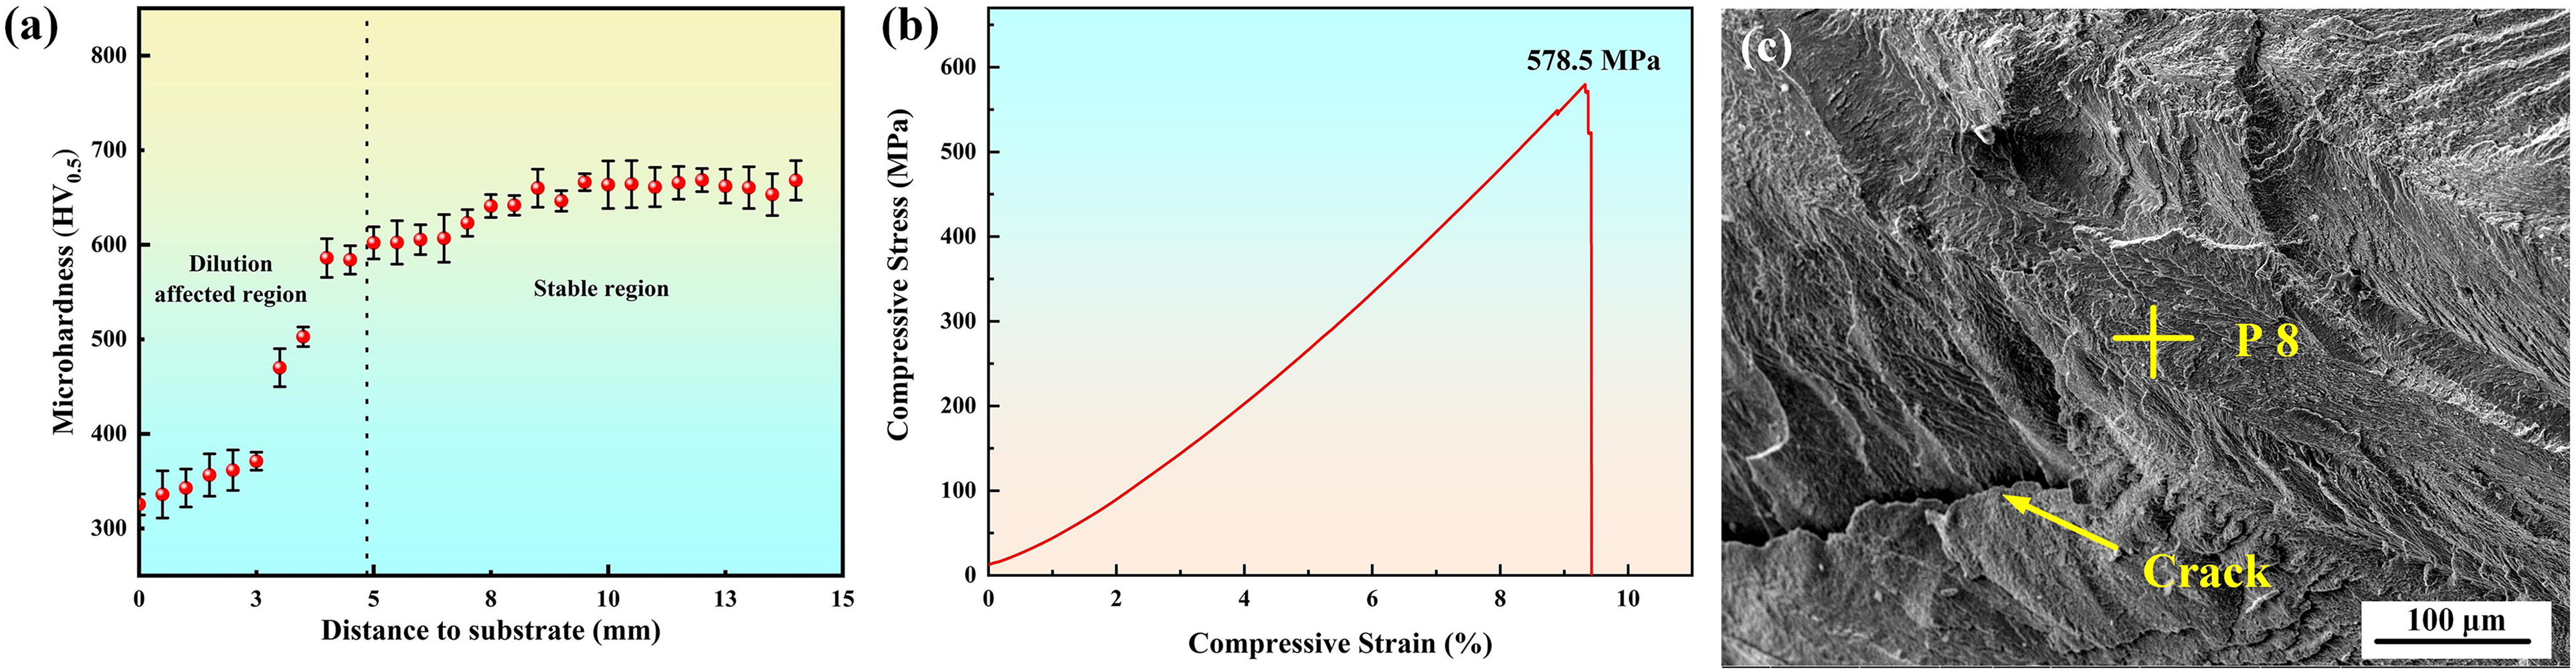
(a) Microhardness distribution of the as-built wall, (b) compression stress–strain curve, and (c) fracture morphology.
In this study, the compression test using three specimens was performed at room temperature. The average fracture stress is 573 MPa and average fracture strain is 9%. As shown in Figure 5(b), the maximum fracture stress and strain are 578.5 MPa and 9.3%, respectively. Before specimen fracture, the necking phenomenon not occurs. Besides, in Figure 5(c), the fracture surface is flat and smooth, and no dimples are formed, which shows the characteristics of brittle fracture. According to Table 1, P 8 is Ti2Ni phase. Ti2Ni alloy wall is the brittle rupture due to forming abundant of Ti2Ni phase. 17 Ti2Ni phase is a hard and brittle phase, which leads to the material embrittlement. 18 Ti2Ni phase fractures the specimen at the initial stage of plastic deformation, which results in the crack formation and propagation.
Conclusion
In this study, a Ti2Ni alloy wall was fabricated in situ by double-wire arc additive manufacturing with pure Ti and Ni wires. The following conclusions can be obtained.
In the dilution-affected region, the content of Ti decreased and that of Ni increased. In stable region, the content ratio of Ti:Ni was close to 2:1 after stabilization, which indicated that the as-built wall is very close to the designed composition (Ti2Ni). At the bottom, the as-built wall consisted of α-Ti and Ti2Ni. In the middle, the as-built wall consisted of α-Ti, NiTi and Ti2Ni. At the top, the as-built wall consisted of Ti2Ni and NiTi. In the dilution-affected region, the hardness of the wall increased from 320 HV0.5 to 600 HV0.5 from the bottom to top. In stable region, the hardness remained stable ∼660 HV0.5. The average fracture stress is 573 MPa and average fracture strain is 9%. Ti2Ni alloy wall shows the characteristics of brittle fracture.
Footnotes
Declaration of conflicting interests
The authors declared no potential conflicts of interest with respect to the research, authorship, and/or publication of this article.
Funding
The authors disclosed receipt of the following financial support for the research, authorship, and/or publication of this article: Natural Science Foundation of China (Grant No. 52305408), Tianjin multiple input projects (Grant No. 22JCYBJC01610).