
Abstract
The welding manufacturing process is increasingly being used as an alternative joining method to sewing for functional textiles including for medical and protective wear, high-performance reinforcement textiles for fiber-reinforced plastics, film materials, and smart textiles. Ultrasonic (US) welding technology is a universally applicable cost-effective joining method for thermoplastic membranes. A key issue with the quality of the welded seam is that many of the faults are not visible on the membrane surface. The traditional quality control of the seam cannot be performed because it is done by destructive testing methods. Therefore 100% assurance of compliance of product safety produced at a production scale is not possible. The objective of the study is to develop a nondestructive (NDT) inline testing method for the quality control of welded seams during the continuous ultrasonic welding process. Currently, the quality control of Ultrasonic (US) welded seams is performed based on sample destructive standard tests, where the quality control of complete welded seams is not ensured. The air-coupled US sensors are used to detect imperfections in the welded seam. A variety of membrane materials with base fabric made of polyester and coated with PVC coating were tested during this research. A superimposed type of seam was produced longitudinally by PVC-coated textiles with smooth surfaced anvil wheels and was welded using a welding width of 10 mm. These coated materials were provided by industrial partners and are used in diverse technical textile applications. A process-integrated NDT test method was developed. The imperfections in welded seams were identified during a continuous US welding procedure with the help of air-coupled ultrasonic sensors by developing an inline test method. A prototype to realize inline monitoring during continuous ultrasonic welding was developed and tested. Faults of different widths were artificially produced during welding. The inline monitoring of welded seams with faults was successfully performed and analyzed. The developed process can further pave the way for the development of inline monitoring of welding seams with US sensors for textile membranes joined with a continuous US welding technology.
Keywords
Introduction
A reliable quality joining of textile fabrics without compromising on the functionality in the seam areas is a prerequisite for marketable products, for example, in hospital hygiene, protective textiles, automotive engineering, and textile architecture. Welding and gluing are increasingly being used as alternative joining methods to sewing, in functional textiles, high-performance reinforcement textiles for fiber-reinforced plastics, film materials, and as a contact technology for smart textiles. 1
In the case of safety-relevant products, one of the key process parameters is the quality of welded seams concerning the permeability of fluids in the welding zones. The selection of optimal welding parameters for a seam of optimum strength is very important. 2 The quality control of welded seams is done with the help of conventional destructive laboratory testing methods. These methods do offer a statistically based solution toward the credibility of welded seams but are unable to ensure 100% quality of the complete length of welded seams of thermoplastic membrane joining zones. Moreover, it is also associated with considerable effort in terms of personnel and costs and is usually only carried out on a random basis. In practice, when determining the quality value, empirical knowledge and complex experimental preliminary tests are still used.
Nondestructive methods have been gaining significance because they help inspect textile materials and products without causing any damage or alteration to the material itself. Various NDT techniques are employed in the textile industry to detect defects, flaws, or irregularities in the fabric or finished products. These methods are used not only for testing historic textiles 3 but also widely used in composite parts for fault detection in textile composites. 4 A variety of NDT techniques are suitable for defect characterization such as porosity, delamination, or debonding within adhesive bonds
The inline inspection methods used in the plastics and metal processing industries are based on infrared, terahertz, and X-ray technologies. However, due to the low material thickness and the inhomogeneity of the textile fabric (thread structure), these cannot be directly transferred to textile materials. In addition to this, our focus area of welded seams has a much smaller width, thickness, and material properties, which are different from the rest of the product plane. The non-contact method of thermography, established in many areas, measuring the intensity of the thermal radiation emitted by a body using a thermal imaging camera, is strongly influenced by the ambient conditions (light, room climate). Moreover, there is no direct connection between the temperature profile in the joining zone and the seam properties in continuous ultrasonic welding, since the textile structure in particular (type, arrangement concerning the seam direction) has a major influence on this. 5 It is found that the spatial homogeneity of the temperature distribution in the bonded area correlates with the peel strength of that bond. A threshold value for the in-homogeneity in the thermal distribution can be set to distinguish between a bad bond and a good bond. 6
For the quality control and assurance of textile weld seams in safety-relevant areas of application, there is a general need for technology development that can ensure reliable and secure welded seams of thermoplastic textile membranes. 7 There are no practical, non-destructive testing methods for inline testing of weld seams on flexible textile materials available for industrial manufacturing. However, there is a strong urge by the research community for defect recognition in CFRP components using various NDT methods on the concept of smart production. 8 Non-destructive testing methods are already used extensively for metals, and they are becoming increasingly important for plastics.9,10
The methods of non-destructive testing can be divided into acoustic methods and methods based on electromagnetic radiation. The latter methods include visual inspection, eddy current testing, the microwave method, dielectric spectroscopy, radio X-ray and computed tomography (CT). Eddy current testing,11,12 thermography,13,14 and computed tomography15–17 are already being used for NDT of FRP components and reinforcement structures. The acoustic methods include linear and non-linear vibrometry as well as linear and non-linear ultra-sonic testing. 18 Ultrasonic testing has proven itself to be very successful in monitoring the quality of fiber-reinforced plastics in the automotive sector19,20 and in the inspection of continuously moving nonwoven webs during manufacturing. 11 The ultrasonic methods for determining the basic weight of textile materials have also been studied by researchers. 21 The propagation of ultrasonic guided waves in ultrasonically welded thermoplastic composite joints to study the effect of weld manufacturing defects on guided wave transmission across the joint has been performed. 22
An inspection of welded seams in textiles with ultrasonic welding technology in a continuous inline manufacturing process is not known.
Ultrasound (US) is the designation for the propagation of elastodynamic waves with frequencies between 20 kHz and 1 GHz, which are above the ability of human hearing. In principle, these sound waves can propagate in gases, liquids, and solids. 23 In the non-destructive testing of plastics, ultrasonic frequencies in the range of 0.4–5 MHz are used. 24 This oscillator, built into a probe, acts as a transmitter, but can also be used as a receiver of the sound waves. The waves arriving at the oscillator then cause a mechanical deformation and the generation of an electrical voltage. When the ultrasonic waves pass through a body, they hit boundary surfaces, and reflection, refraction, and/or transmission occur. Internal structures are thus made visible through the altered propagation of the ultrasonic waves in the workpiece. The decisive factors are the material density and the speed of sound. According to the measurement method, the ultrasonic method is further divided into three subcategories.
Pulse Echo Method
Resonance Method
Transmission Method
The Pulse Echo method emits a sound beam into a test fabric surface. The sound travels through the raised divider portion of the fabric and then returns to the transducer or returns early when reflected from discontinuities inside the part. 25 The pulse-echo method would be non-practical and expensive for inline testing of textile seams as this process is performed with testing material immersed in the fluid, which would require a subsequent drying process. The resonance method is ruled out due to the rough surface quality of the textile seams and the corresponding adjustments and necessary devices for the supply of the coupling medium. 26 The economic viability is less for machinery manufacturers for the integration of an expensive NDT method in the welding machine.
Therefore, the transmission measurement using air-coupled ultrasound is the most promising for inline testing of textile seams. The economic advantages lie in the relatively low procurement costs and uncomplicated integration into the production process. 27 The use of ultrasonic NDT in the textile industry is still an emerging area and is gaining popularity. Conventional ultrasonic systems like the Pulse-echo method and resonance method can not be easily adapted to textile joining processes. 28 The high attenuation factor of flexible textile materials, makes the air coupled a preferred choice because the ultrasonic beam crosses the material just once compared to the pulse-echo technique which has to go and come back within the material thickness. 29
Within the framework of an interdisciplinary research project, the development of air-coupled ultrasonic testing technology for inline monitoring the weld seam quality in the textile joining process was studied. Linking continuous ultrasonic welding with ultrasonic testing will increase the reliability of the welded functional products (airbags, contamination protection suits, etc.). The ultrasonic welding process with inline inspection of the weld seam quality in textiles will reduce previous market entry barriers for SMEs in safety-relevant application areas and will enable high-tech textiles to be used in new application areas with high economic relevance in the future. The objective of the funded research project was the development of a non-destructive process integrated inline monitoring for the quality assurance of US welded seams with the help of US sensors. Within the framework of the project, industrial inputs were also provided and processes were performed at industrial operational speeds for the detection of seams faults. The idea of introducing a US sensor after the seams welding to examine the seam integrity is a step toward process integrated 100% inline non-destructive quality assurance in ultrasonic welding technology.
Materials, machine, sensors, and methods requirements
Textile materials and types of equipment
During the research, the focus of material was laid on thermoplastic-coated textile materials for the application areas for Protech and Buildtech. The textile materials were provided by the firms from their product portfolios, which were part of this research project. The properties of the materials used are shown in Table 1.
Material properties.

During this research machines and equipment have been used, which are mentioned below.
• Ultrasonic welding machines Nucleus DX1 Eco from Nucleus Ultraschall GmbH, Germany and Pfaff 8311 from PFAFF Industriesysteme und Maschinen GmbH, Germany
• Ultrasonic sensors with operating frequencies of 80, 125, and 210 kHz from Airmar Technology Corporation, USA, and 300 kHz from Hillger NDT GmbH, Germany
• Zeiss AXIOImager microscope from Carl Zeiss Microscopy Deutschland GmbH, Germany
• Monoaxial tensile testing machine 2.5 KN from Zwick GmbH & Co. KG
• Hydrotester FX 3000 from Textest AG, Switzerland
• Scanner system developed by IKTS and Suragus GmbH, Germany
• Ultrasound Hardware (PUCS (R) pro LF and Software PCUS Lab by IKTS, Dresden
The details about the used hardware and software are further discussed in the following respective section.
Welding technology
Ultrasonic welding is a universal, environmentally friendly, and safe welding technology for the preparation of welded seams. The process of ultrasonic welding technology uses mechanical vibration energy to heat the thermoplastic material and surfaces are joined under pressure. The connection of the plasticized joining partners requires sufficient joining pressure, which is why US welding and the other textile welding processes according to DIN EN ISO 8593-6 belong to the pressure welding processes. 30 The properties of the ultrasonic welds are influenced by the process parameters including amplitude power, gap size between the welding tools, welding tool geometry, welding pressure, and welding speed. Ultrasonic welding machines from two different machinery manufacturers were used. The first machine was “Nucleus DX1 Eco” provided by project partners from Nucleus Ultraschall GmbH, Germany. At a later phase of the project, the Pfaff 8311 machine from Pfaff Industrials GmbH, Germany, was incorporated into the project. The later machine was also used for the demonstrator tests (Figure 1).

Pfaff 8311 Ultrasonic Welding machine at ITM.
Selection of suitable US sensor
Considering the nature of the US welding process, the inline monitoring measuring principle should be contact-free and an inexpensive solution. The technical boundary conditions for an air-coupled ultrasonic method to be developed is a suitable method. The main advantage is that the measurement with air-coupled ultrasound is contactless, while all other ultrasonic methods require a coupling medium. This is the only way to integrate the process into the textile welding process as an inline inspection.
Based on the defect sizes mentioned above, the material or seam thickness under consideration, the probe parameters under consideration (e.g. frequency, oscillator diameter, probe head distance) were narrowed down and the required parameters for the ultrasonic electronics (excitation voltage, reception amplification, the sampling rate of digitization, etc.) were established. The following criteria for the US sensors for fault detection were selected.
• Contactless method
• Sensor detection test speed as per the real process speeds in US welding
• The transmission method of US sensors
The data obtained from an ultrasonic pulse (A-scan) shows the structure of the test specimen at a probe position. The propagation time or path is proportional to the thickness d. The excitation signal S and the reflected echo of the rear wall R can be recognized, as well as the error echo F if present.
They can be entered in an image in a column in such a way that the higher the ultrasonic echo determined at the respective depth position, the higher the gray value of the image. Nowadays, color scales are used to represent the signal height. A sequence of adjacent image columns can be used to create an image that represents a section through the test specimen. Such an image is referred to as a B-scan. The C image represents a projection of the test specimen onto the scanned surface and is therefore comparable to a radiographic or X-ray image (Figure 2). 31

Principle of A, B, and C scan presentation. 31
At the IKTS, a corresponding scanner system Figure 3 was used for the measurements. The Scanner system is an indigenous development by IKTS and Suragus GmbH based in Dresden, Germany. During the measurements Ultrasound Hardware (PUCS (R) pro LF and Software PCUS Lab are used which are also developed by IKTS, Dresden.

US sensing system with air-coupled transmitter and receiver at IKTS.
In the scanner system, the textiles can be mounted between two ultrasonic sensors that can be moved in the X, Y, and Z directions in the transmission method. The flexible A4-sized seam samples were fixed in a special clamping frame. Intensive testing was performed to find out the best working frequency for US sensors with which the highest signal amplitude reception was attained.
During the selection of the US transmitter and receiver, five pairs with frequencies from 80 to 300 kHz were chosen. The details about the used US sensors are provided below in Table 2.
Details of air-coupled US sensors.

In addition to the excitation pulse characteristics, the optimum distance between the transmitter and receiver to sample surfaces is another effective parameter that has to be found for the experimental setup. From extensive testing, the transmitter and receiver with 210 kHz provided the best results for all four materials mentioned in Table 1. The transmitter transducer was excited by a sinusoidal wave without a window. The smallest detectable length of a defect was approximately 2 mm. The results from 80 kHz and 125 kHz sensors showed lots of distortion for all materials except for Mat 3 and Mat 2 respectively. However, the results were not better than 210 kHz sensors. The 300 kHz transmitter/receiver did not detect any useful details for any of the materials. 32
Welded seam requirements
In general, the most important welded seam requirements are the seam strength and sealing effect against fluids, for example, water or chemicals. The resistance of textile fabrics to water penetration in a hydrostatic pressure test is often the primary requirement parameter. This is particularly important when using internal pneumatic pressure, for example, for life rafts, biogas plants etc. For the investigations, the two weld seam geometries are carried out on two superimposed layers of material or as simple overlap seams with a seam width of 5 mm and 10 mm. According to industrial partners of the project, these seam widths are commonly used in various applications manufactured with US welding technology. Therefore, the research focused mainly on these two seam widths. The establishment of optimum welding parameters for a particular welding material is a tedious task. Before performing testing with US sensors, they were found out. Extensive welding experiments were performed and the process windows for reference Mat 2 and Mat 4 were first determined. It has been published in a research paper, which discusses the systematic approach selection of welding parameters and the mechanical properties of materials and welded seams in detail. 33 However, the focus of this publication remains on the non-destructive inline monitoring of welded seams. The properties of the weld seams obtained were determined using the transverse seam strength in the strip tensile test according to DIN EN ISO 13934, peel strength (DIN EN ISO 11339) and the sealing effect in the hydrostatic pressure test according to DIN EN ISO 20811.34–36 The tests are performed on a monoaxial testing machine (2.5 kN) from Zwick GmbH & Co. KG and with Hydrotester FX 3000 from Textest AG, Switzerland. The cross sections of the weld seams were examined and evaluated using an optical microscope. In Tables 3 and 4, the seam strength and sealing effect of hydrostatic pressure are measured respectively for a welded seam with 5 mm width for Mat 2.
Seam strength (N/5 cm) for 5 mm Amboss.

Hydrostatic pressure resistance (mbar) for 5 mm Amboss.

The maximum values for the seam strength are 1250 N/5 cm (5 mm wheel width) or 2150 N/5 cm (10 mm wheel width). 37 A maximum of 206 mbar (5 mm) or 479 mbar (10 mm) was measured for the sealing effect. It should be noted that the implementation of the hydrostatic pressure test was difficult and fraught with problems, and the registered measured values therefore only give an orientation for the expected tightness of the weld seams. Therefore, actual maximum sealing effect of the weld seams as well as that of the base material (Mat. 2) could not be determined and were reported as display value.
Faults classification of a welded seam
The external irregularities are usually recognized immediately during the usual visual inspection during or after the welding process. However, inhomogeneities (e.g. cavities) within the seam cross-section, remain undetected. It is precisely these “invisible” defects or irregularities in the joint interface between the material layers (or workpieces) that can affect the seam performance, for example, reduction/complete loss of fluid-tightness, and may also affect the load-bearing capacity of the weld.
Concerning the development of a non-destructive method for checking seam integrity, systematic consideration of possible defects and irregularities in weld seams with respect to their size and morphology is important. Since there are no binding standards for the textile welding process that define irregularities in textile welds, existing standards regarding the classification of irregularities in welds from areas related to testing, for example, for thermoplastics DIN EN 14728, DIN EN 16296 and metals DIN EN ISO 6520 are used. These were analyzed for their structure, level of detail, and feedback on the manufacturing process. Based on the available welding experiments, the experiences from earlier investigations, the consultations with experts, and a perspective view to future standardization activities for textile welding, it was appropriate to focus on fault categories that are related to continuous ultrasonic welding technology. The following defects and irregularities that occur in textile weld seams are considered relevant for the ultrasonically welded seams.
• Cracks
• Cavities
• Solid inclusions of foreign objects
• Binding errors
• Deviations in shape and dimensions
• Other irregularities
Pores and cavities enclosed in the cross-section of the seam are the most common in textile welds. The causes usually lie in the later textile process stages, in particular the coating process. Depending on their size and morphology, the pores can severely impair the sealing effect of the weld seam, despite sufficient strength. The size of the identified pores ranges from approx. 100 µm (individual pores) to 1 mm and more. In Figure 4 (left) the pores in the welded seam are visible. The pores are formed and the thermoplastic material is not fully intact in the welded area. In Figure 4 (right) an elongated cavity has air pockets. The seam is also not here well intact with the welding surface. Both of these examples show a weak spot in the welding zone. These weak spots in the welding zone always initiate whenever a seam failure takes place.

Pores in welding area (left) elongated cavity (right).
Sometimes the joining layers are not completely connected over the entire seam cross-section, which can occasionally be temporary during the welding process and often goes unnoticed in the production process. This lack of fusion with insufficient penetration can reach an extent of up to approximately 5 mm. In contrast to the error categories shape and dimension deviations as well as heat damage, the pores in particular and occasionally lack of fusion are not visually identifiable. The research work accordingly focused on the detection of pores and lack of fusion in the joining interface between the thermoplastic joining partners. The following requirements can be derived for the non-destructive ultrasound-based measurement method to be developed for inline monitoring.
• Detection of seam defect sizes in the range of 1–5 mm
• Welding speed of 2 m/min
Knowledge of the defect morphologies and irregularities identified in textile welds is used later to derive the requirements for the US transmitter/receiver and the measurement method.
Intentional creation of a faulty US welded seam
For the development of the non-destructive measuring method, welded seams with a defined and reproducible defect geometry were first required, which realistically depict cavities or interruptions in the connection of the material layers of the welding zone. These seam patterns with artificial seam defects were essential for the development of the measurement conditions, the selection of the US sensors, software and hardware adjustments, and the refinement of the evaluation algorithms.
Selected real-case scenarios from assembly practice that can occur during the production process were simulated and corresponding seam samples with real weld seam defects were produced. Optical microscopic images were taken of all seam patterns for the verification of the US scan images.
To simulate interruptions in the weld seam, PTFE film strips with a width of 1, 3, and 5 mm were prepared and positioned between the joint partners in the intended seam area zone transversely to the intended direction of the seam.
After welding, the PTFE strips were removed from the seam area. Figure 5 shows an example of the PTFE strips in the welding zone. The seams were observed with the Zeiss AXIOImager microscope from Carl Zeiss Microscopy Deutschland GmbH, Germany. The image on the right shows the cross-section of artificial defects in the seam after removing the strip of 1 mm width. The geometries of the defects correspond very well to the strip widths of the cut PTFE strips and are sharp-edged. These faults were produced at known intervals and were studied for the characterization of textile material and welded seams. With the test design, a large number of initially invisible weld seam defects in the joint interface, which mostly occur objectively and often cannot be easily compensated were investigated. These include setting problems after switching to a new production machine, the use of automatic start/stop, the effect of wear on welding tools, and contaminated material surfaces.

PTFE strips in the welding zone (left) and cross-section of 1 mm fault taken with an optical microscope (right).
Characterization of textile material and welded seam w.r.t. to their acoustic properties
The aim of further preliminary investigations was the acoustic characterization of the welded seams with artificial faults created during the welding process. A probe emits sound pulses that penetrate a test specimen. Within the test specimen, the pulse is reflected at a defect and an interface and can be detected by the probe, which also acts as the receiver probe. The depth “d” of the inhomogeneity and the interface can be determined by measuring the time Δt between the transmission and reception of the pulse if the speed of sound “c” of the material is known. The depth d results from the equation for perpendicular sound incidence:

The aim of ultrasound diagnostics is often to visualize the volume of an intrinsically opaque test specimen. The A-scan is a representation of the detected echo amplitudes at one point. A more meaningful representation is achieved by scanning the surface of the test specimen point by point. In the C-image display, the probe is moved two-dimensionally over the test specimen surface. At each measuring point, the highest echo amplitude between the entrance signal (A0) and the back wall echo is recorded, whereby each echo is assigned a brightness or a color depending on its height. The C-scan thus provides a two-dimensional reproduction of the amplitude distribution, similar to an X-ray image. If defects are present, the amplitude attenuation at these points results in a defect distribution. The actual amplitude A depends on the attenuation of a material (α), the distance d of the propagated waves, and the exiting pulse amplitude A0.
The respective received signals were recorded for the various samples as shown in Figure 6. It was found that the US signals in the area of the seam had a significantly higher amplitude than in the faulty seam area or the non-welded area. This is also confirmed in the simulation. A transmitter and receiver with 210 kHz were used to measure the textile weld seams with the scanning air-ultrasonic system.

Comparison of receiving signals for defective weld (red) and good weld (blue).
A successful material welding indicates that there is no air gap in the joint interface, therefore less loss in the transmitted sound energy. Areas with seam defects have layers of air, which have a great sound-damping effect and high loss in US signals.
These different amplitudes of the received signals can therefore be used for error detection. An evaluation of the area or integral over these received signals enables a decision to be made as to whether good sound transmission has taken place at the respective point or not. Scanning methods, which record these temporal reception signals at a large number of points in the area of the weld seams, enable a 2-dimensional (C-scan) or 3-dimensional display.
In the first step, the measured data files recorded the amplitude of the received signals in 0–400 μs and for all positions (x and y points) by 12.5 MHz sampling rate. By running the system without the sender transducer and just the receiver, the system’s noise was measured. Later, in MATLAB, it was reduced from the primary signal of all scanned points. The filtered signals were separated in a time range of 100–200 μs, and the Hamming window was applied to that range. It made the main signals smoother.
Algorithm finding (signal analyzing)
MATLAB software was used for signal processing. In the first step, the measured data files recorded the amplitude of the received signals in 0–400 μs and for all positions (x and y points) by 12.5 MHz sampling rate. By running the system without the sender transducer and just the receiver, the system’s noise was measured. Later, in MATLAB, it was reduced from the primary signal of all scanned points. The filtered signals were separated in a time range of 100–200 μs, and the Hamming window was applied to that range. It made the main signals smoother. Figure 7 shows the C-scans of the defects that previously were cut to take a microscopic image of their actual cross-section. It makes it possible to compare the results with the actual size of the defects. In addition, they have welded with different welding parameters as mentioned before.

C-scan of (a) 1 mm fault (b) 2 mm fault, (c) 3 mm fault, (d) 4 mm fault.
Based on the previous investigation steps, the developed ultrasonic sensors were also tested. A scanning process must be used for later integration into an inline inspection. The hardware settings (excitation signal, receiver signals, US scanner parameters, working distances, focusing devices, etc.) have been extensively tested and optimized. Depending on the measurement results and accuracies achieved, technical software adjustments were also made for sample rate, and use of signal filters. Since different reflections and signal patterns occur at the relevant feed rate. The maximum possible feed rate in the welding process and the resulting lateral resolution of up to 1 mm of the error pattern were also tested here and ultimately determined. The result is the parameters for the air-coupled ultrasound process, the acoustic parameters of the starting materials and the welds with and without artificial defects or irregularities in the weld. With the test frequency of 210 kHz, both the existing starting materials PVC (Mat. 1, 2, and 4) and TPU (Mat. 3) and weld seams made from them can be identified significantly.
Results
The result section is divided into two parts. In the first section, the US scan results of different types of faults will be discussed and in the later part, the developed demonstrator for the realization of inline monitoring during the continuous US welding process will be discussed.
US scanning results of welded seams
Fault areas in the welding zones are qualitatively reflected from the US scans as areas with high energy loss or intensity fluctuations of the US signals. Seam areas with good welding have a lower damping effect on the air. The results of welded seams of different fault types are discussed further.
Influence of start/stop points
The start-stop areas appear similar to errors in the US scans. They reduced the amount of energy that passes through the welds, but not as much as the completely unwelded areas by comparison. Figure 8 6 shows the US scans of the three start-stop points within the weld seam 1.2, which were produced without automatic start/stop. Furthermore, the top view of images of the associated cross-sections of the weld seams over a seam length of approx. 15 mm are shown. The areas of the start/stop points (length approx. 4–5 mm) have increased pores. Repeated exposure to energy likely causes the air trapped in the tissue to overheat and expand.
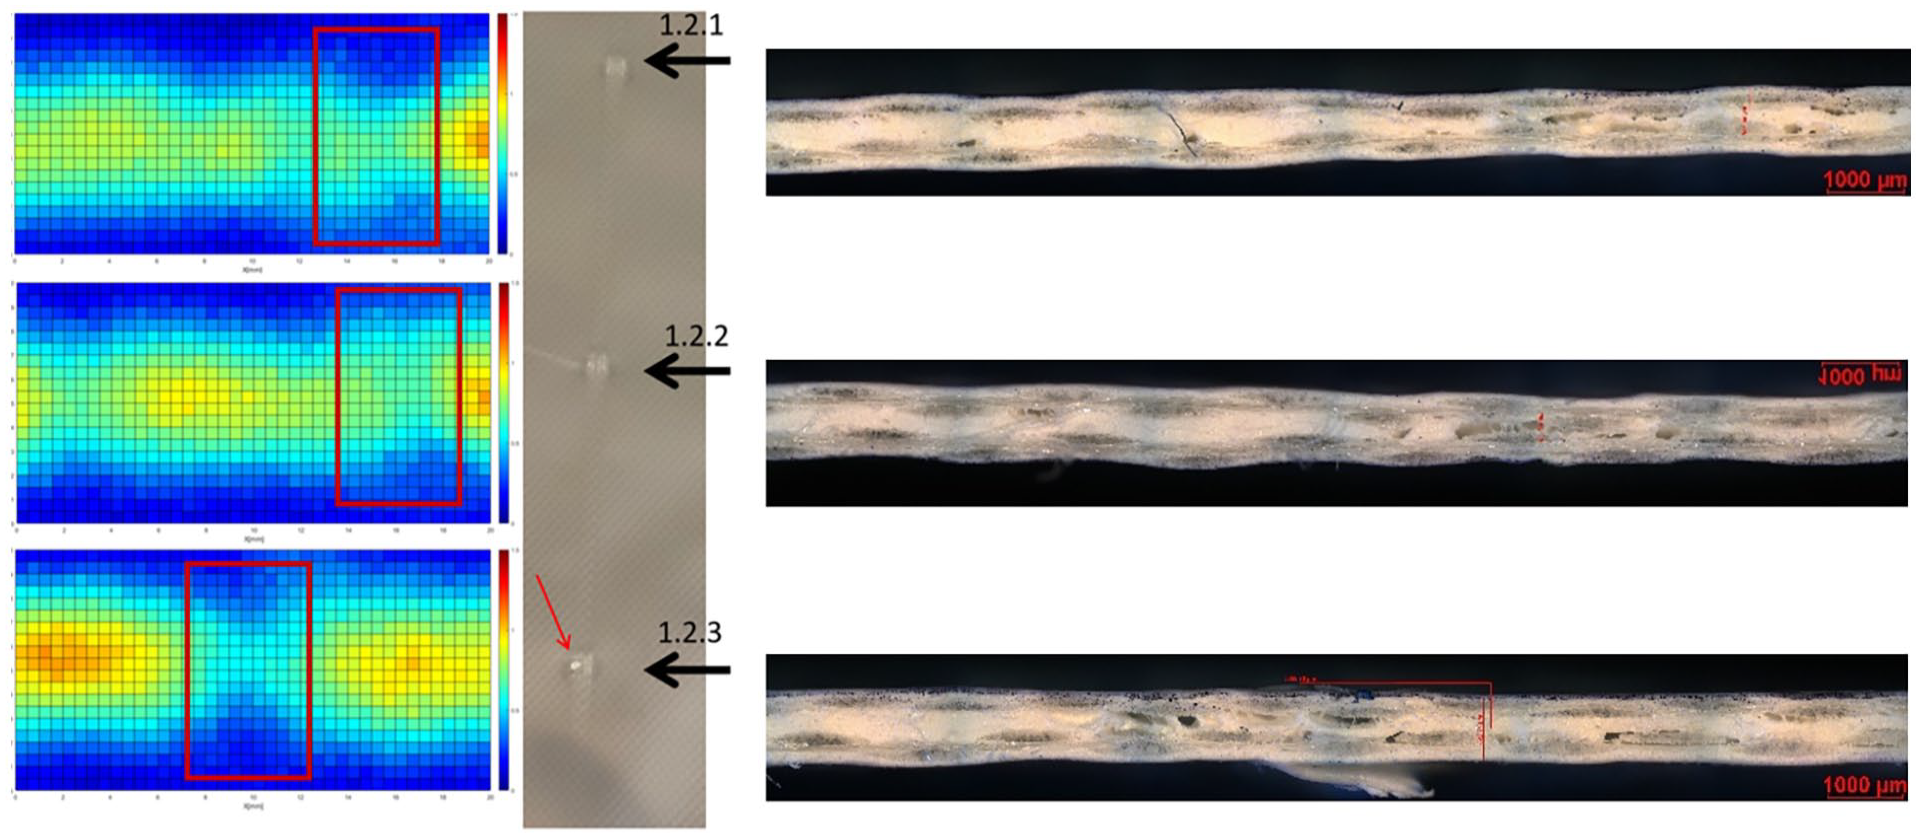
Start-stops faults.
The start-stop points, which were created without an automatic delay, appear (visually) very transparent since the pressure effect forces melted coating polymer out of the seam zone. At these points, the US is reflected more strongly on the surface than in the seamlessly welded seam sections (yellow/orange). Accordingly, the US receiver only receives a small number of transmitted US signals, which can be seen in the US scan as green or green/blue areas with high energy loss. At seam 1.2.3, the reflection effect is higher compared to 1.2.1 and 1.2.2, the seam area is also visually very transparent and the energy loss is correspondingly high.
Impact of dirty surface
Figure 9 shows the US scans of the welds with clean (above) and contaminated material surfaces in the weld area. Significantly, more US energy can be transmitted through the welded seam without contamination (top). The yellow and red colored areas in the US scan indicate a good connection between the two material surfaces in the joint interface. In contrast, the passage of energy through the joint interface is reduced by the dust particles. The weld appears narrower in the US scan and there are a few welded, intermittent (greenish areas) with high energy loss, suggesting a less good joint. It can be assumed that the amount of dirt or solid particles or the degree of contamination of the material surfaces influences the quality of the connection in the joint interface.

The US scans with clean weld (top) and the dirty weld surface (bottom).
Faults with cavities
Figure 10 shows the C-scans of weld seams with defects (bottom) and the optical microscopic images of the associated seam cross-sections in the direction of the seam (top). The faults of the size 5 mm are shown comparatively very well in the C-scan. The enclosed volume of air reduces the transmission of the ultrasound considerably, which is particularly evident in the color transition from red/blue to green/yellow in the example in the middle. Defects of the size 1 mm (left) are comparatively not well shown in the C-scan. In this case, the size of the defect is in the range of the size of the measurement spot, which is why a clear detection is possible, but no determination of the lateral error dimensions. With the given parameters the scans with 3–5 mm cavities were identified with good results. The results of less than 3 mm were identified, but the reproducibility of the results was not enough and needed further investigation.

Welded seams with faults. Light microscopic cross-sectional images (top) and corresponding C-Scan images (bottom).
Seam areas with good welding have a lower damping effect on the air-coupled US method. Air pockets in the seam cross-section, for example, due to expanded pore volume or air layers between the unwelded material layers, weaken the US signals or cause high energy losses. The presence of foreign particles, for example, dirt particles, has an increased attenuation effect for the US signals. Faults in welding zones are qualitatively reflected from the US scans as areas with high energy loss or intensity fluctuations of the US signals. Rough surface scattering effects can be reduced when scanning from the underside of the weld.
Hardware and software adjustments are necessary, on the one hand, to resolve seam defects with dimensions of 3 mm and below and, on the other hand, to also take into account the effect of changed welding process settings, for example, welding force, welding energy, to be able to identify and interpret significantly. The US scans are merged with the database for the laboratory results and initially developed error categories in an error library that is continuously supplemented and can be expanded according to new findings.
The difference in the maximum and minimum of the amplitude in the windowed data was calculated for all scanned points and Figure 11 represents them. It shows a significant drop in the defected area.

Minimum/maximum evaluation of welded seam with 1 mm fault (left) and with 4 mm fault (right).
Cross-sections in the y-direction for two points along the x-direction defective and without defect are presented in Figure 12.

Cross sections of 4 mm fault in y direction for two X points, (red) defective and (blue) without defect.
For all x points, the area under these curves was calculated, and the graph in Figure 13 was formed.

Mean and cut-off are applied in the curve of the area under the maximum amplitude in the y direction for all x points (a) 1 mm fault (b) 4 mm fault.
Figure 13 shows the cut-off and mean values with dashed lines, and by this cut-off, the accurate size of the defect can be determined as 1 and 4 mm defects. The upper threshold is not crucial, as more than the mean value means more transmitted energy, which is desirable. That is why only the lower limit is inserted into the figures.
Most of the graph’s fluctuations are inherent to the welding process and nature of the weld and its quality is not the same through the welded seam. The defective area can be recognized. The reduction of the area under the curves can reveal the center of the defects, but it is not sufficient to size the defects accurately. Two methods were used to find an accurate cut-off value for the curves. First, based on the same seam. The mean value and the standard deviation of the graph can be an excellent way to detect the defect size. In this case, it is necessary to determine the proper cut-off for the area. Considering the slope of the curve around the defected area, it is clear that the smaller the defect, the less slip the line near the defect. In this case, they need a smaller cut-off than the more dominant defect with a higher slope. A proper value was calculated to set the cut-off amplitude by finding the difference between the mean value and the minimum value of the curve, and the standard deviation. The suggested value is one standard deviation plus the reverse of the calculated difference.
The Figure 14 below shows the cross-section presentation of FFT spectra of all received signals to determine the error size of 1 and 4 mm.

FFT spectra of all received signals of the welds with errors 1 mm (left) and 4 mm (right).
Development of demonstrator/experimental setup
Earlier laboratory tests with air-coupled US sensors were carried out in IKTS, in which the sensors moved in X, and Y dimensions and scanned the welded seam for defects, while the weld seam sample was stationary. Since this doesn’t represent an applicable usage scenario in an industrial US welding process. Therefore, a prototype demonstrator was required.
The experimental setup was developed as part of the project deliverables. The aim is to develop a US welding machine concept with integrated inline monitoring of welding seams for inline fault detection during a continuous process. The US welding machine Pfaff 8311 was used for the integration of a prototype demonstrator for continuous inline testing of welds. The experimental set-up was required to perform the following tasks:
• Integration of the air-coupled US sensors in an industrial US welding machine,
• Flexible mounting of the air-coupled US sensors for optimal adjustments,
• Faults detection of weld seam in a continuous welding process
• Operation with normal welding process speeds.
Figure 15 shows the graphical illustration of the demonstrator concept. The two US sensors are positioned right after the welding zone. The welded seam is required to pass through the sensor area so that the imperfections can be detected. The red marked spots in the figure above are the faults in blue colored welded seam shown as a cross-section. The green arrows depict the US waves coming from the transmitter and received by the receiver.

Demonstrator.
The air-coupled US sensors are fixed in a frame made of an aluminum profile. The sensors are mounted in a special holder manufactured by the 3D printing process. The distance between the US sensors is variable and can be adjusted according to the field parameters of the transmitter and receivers. It was required to achieve improved transmission, detection, and monitoring of welded seam defects. The US transmitter and receiver must be positioned precisely and concentrically for signal transmission between transmitter and receiver.
The demonstrator configuration consists of the Pfaff 8311 US welding machine and the complete experimental setup with a pair of US sensors positioned on a separate table as shown in Figure 16. The entire sensor structure was aligned to the welding machine in such a way that the welded seam runs exactly between the US sensors across the entire width when it leaves the welding machine table. Figure 16 (left) shows the close-up of the two US sensors after the welding zone (here without the welding seam). It is important to ensure that US transmitters and receivers are precisely aligned with one another, otherwise, a good US signal cannot be received. The image on the right shows how a welded seam passes between the US sensor set-up after it is being welded.

Sensors close up (left), complete setup (right).
The welded samples were prepared with five different fault widths (i.e. 5, 4, 3, 2, and 1 mm) and these faults were placed at a regular intervals of 15 cm. As it was difficult to create reproducible faults of the aforementioned dimensions and perform the scan at the same time with accuracy. Therefore, faults were produced on the whole length of the welded seam ahead of scanning and later passed through the US sensor setup in the next step as a continuous process. The received signals were optimized using the algorithm developed which has been described in the previous section.
The defects with widths of 5, 4, and 3 mm (Figure 17 shows 4 and 3 mm) are very well detected by US sensors. They were identified in all test repetitions and delivered well-reproducible results. In contrast to this, errors smaller than 3 mm are not reliably and reproducibly detected by the inline sensors (Figure 18).

Faults detected during continuous inline monitoring of welded seams 3 mm (left) and 4 mm (right).

Faults detected during continuous inline monitoring of welded seams 2 mm.
The demonstrator tests provided evidence that the inline inspection of weld seam defects using air-coupled ultrasonic measurement methods is possible in a continuous process. Seam defects with a lateral size of 5–3 mm can be detected very well non-destructively in a continuous welding process at a processing speed of 2 m/min in the ultrasonic whitening process.
Conclusion
The PVC-coated textile materials were welded with ultrasonic welding technology with artificially introduced welded seam defects. These defects were studied with an innovative method for non-destructive testing of the weld seam quality based on air-coupled ultrasonic technology. This method was developed, and tested at partner research institutions. The inline monitoring of welded seams during the continuous welding process was realized.
The PVC-coated material was welded with industrial welding practices with an anvil wheel width of 10 mm. The welded seams were tested for seam strength for given welding parameters to find out the optimized welding parameters with the best-welded seams. US sensors with operating frequencies of 80, 125, 210, and 300 kHz were tested with PVC-coated material for fault detection. It was found through experimentation that the operating frequency of 210 kHz produced the best results for our given PVC-coated material. The faults introduced were from 5, 4, 3, 2, and 1 mm in width which were placed at regular intervals. The faults with a width of 5 mm–3 mm were detected by air-coupled sensors quite well and reproducible results were obtained. However, certain limitations were observed for the detection of defects with a lateral size smaller than 2 mm to achieve reproducible results.
Welding faults were qualitatively reflected from the US scans as areas with high energy loss or intensity fluctuations of the US signals. Seam areas with good welding have a lower damping effect for the air-coupled US sensors. Air pockets in the seam cross-section, for example, due to expanded pore volume or air layers between the unwelded material layers, weaken the US signals or cause high energy losses. These lack of US signals are analyzed as seam defects. MATLAB software was used for signal processing. By running the system without the sender transducer and just the receiver, the system’s noise was measured. Later, in MATLAB, it was reduced from the primary signal of all scanned points.
The presence of foreign particles, for example, dirt particles, has an increased attenuation effect for the US signals. However, a direct comparison with the microscopic 2D cross-sections is only possible to a limited extent within the scope of the investigations, since the 3D seam cross-section is recorded integrally in the US scan. No quantified conclusions about the pore morphology can be drawn from the US scans because both a large number of small pores or a few number of large pores may provide passageways for liquids. The US scans are merged with the database for the laboratory results and initially developed error categories in an error library that is continuously supplemented and can be expanded according to new findings. The difference in the maximum and minimum of the amplitude in the windowed data was calculated for all scanned points and shows a significant drop in the defected area. It can be on further refinement of sensors and optimization of the distance between the sensor and continuously moving seam. It is also suggested that this is because of the experimental setup. The US welding machine, its moving parts, noise from the sonotrode, and other noise from the surroundings must be isolated to reach US sensor connections. In an ideal case, the sensor setup should be placed right after the welding zone, but it must be isolated to produce reproducible results.
However, the demonstrator setup was successful in performing the inline monitoring of welded zones, and faults were well identified. In the following research, the setup with exposed wires, connections, and sensors to its surroundings will be isolated for improved US signal transmission and reception, it has to be well isolated from surrounding noise.
The inline solution can have great advantages and high economic benefits for SMEs, especially for the manufacturers of ready-made products with high safety relevance. The quality check is currently carried out manually on every ready-made product in which cost-intensive assemblies are already installed, for example, fire brigade protective suits or chemical protective suits. Furthermore, new knowledge about the origin and morphology of weld seam defects was gained and a system for categorizing textile weld seam defects was proposed. Both represent an important prerequisite for the development of standards and norms for the classification of weld seam defects and irregularities in thin, flexible materials. The benefit of the research project for SMEs in textile and clothing technology can therefore be rated as high, since the non-destructive testing technology, which is integrated inline into the entire ultrasonic welding process, can be used to implement significantly improved quality assurance and thus increase the reliability of safety-relevant products.
Footnotes
Acknowledgements
We would also like to thank DAAD for the financial support of student researchers.
Author contributions
During this joint project, the authors from both ITM and IKTS worked together to reach project milestones. The requirements and classification of seam faults were a joint work of both institutions. The measuring principle selection, acoustic characterization, and acoustic simulation were performed by the IKTS. The creation of welded seam faults, systemization, and machine concept integration of prototype was conducted by authors of ITM.
Declaration of conflicting interests
The author(s) declared no potential conflicts of interest with respect to the research, authorship, and/or publication of this article.
Funding
The author(s) disclosed receipt of the following financial support for the research, authorship, and/or publication of this article: The research work was funded by IGF with project number IGF 50555 BR, financed by the German Ministry for Economic Affairs and Climate Action.