
Abstract
The 3D virtual simulation technology is widely applied in the fashion industry tasks, including product planning such as 3D sample work, design development, marketing, and display, enabling styling of virtual models for differentiation. Achieving a digital representation of fabrics that closely resembles actual materials requires additional information obtained through experiments, beyond basic fabric characteristics like fiber content, weight, and thickness. However, research reflecting changes in fabric properties is relatively lacking. Therefore, this study aims to propose criteria for the physical characteristics of shirt fabrics and compare fit variations of virtual garments based on fabric properties to enhance the usability of virtual garment simulation. Thus, we compared and analyzed the characteristics and draping properties of shirt fabrics using two different fabric testing methods, KES-FB and CLO Fabric Kit, and investigated correlations based on each measurement device. Additionally, virtual clothing was performed based on various fabrics to compare clothing suitability. Consequently, we classified fabrics into three clusters for each measurement method and confirmed the characteristics of each cluster. Furthermore, by visually comparing the fit of shirts based on fabric properties, we observed changes in clothing pressure and deformation rate among clusters. Therefore, we believe that the results of this study can assist designers with low proficiency in 3D virtual garment production when applying virtual materials to designs. These findings are expected to be valuable for utilizing 3D virtual clothing simulations in the fashion industry for online sales and marketing, as well as in the gaming industry for avatar costume design.
Keywords
Introduction
Recently, the fashion industry has been expanding its use and integration of three-dimensional (3D) technology, including the establishment of design libraries, the expansion of online platforms, and the implementation of artificial intelligence (AI) for personalized shopping experiences. Additionally, the commercialization of digital technology has demonstrated economic benefits such as cost reduction through shortened design, manufacturing, and production processes, as well as streamlining design workflows. Further, 3D virtual clothing technology is becoming a critical factor in streamlining the design process and is considered essential for gaining competitive advantages in the fashion industry.1–3 Concurrently, the fashion industry is not the sole domain experiencing changes; consumer attitudes are also evolving. The COVID-19 pandemic has driven a surge in contactless activities, leading consumers to shift their spending patterns from offline to online. Moreover, the metaverse has garnered significant attention as an immersive 3D next-generation platform with the potential to replace e-learning, web portals, and e-commerce.4,5 Within the metaverse, online marketing utilizing 3D virtual clothing has emerged as a critical focus area, with luxury brands adopting metaverse marketing, virtual fashion shows, and campaigns involving virtual influencers.6,7 Consequently, active research is underway to advance the virtual representation of fabrics and garments.
The successful implementation of this technology relies on obtaining high-quality fabric properties, including digital fabric colors and materials, for a highly accurate representation of 3D models and real products. This is essential for achieving a high level of reproducibility in silhouettes and details. To achieve the digital representation of fabrics that closely resemble real materials, additional information obtained through experimentation is required, in addition to basic fabric properties such as fiber content, weight, and thickness. The Kawabata evaluation system for fabrics (KES-FB) is commonly used to measure fiber properties, providing objective handle values and the physical characteristics of fabrics, which can be utilized to predict the silhouette. However, operating the KES-FB system incurs significant costs and requires specialized expertise, making it challenging for general users or individual designers to effectively utilize this equipment.8–10 Despite extensive research and technological advancements in 3D virtual clothing systems, challenges persist in addressing issues related to the discrepancies between virtual and real garments, the unnatural appearance of virtual clothing, and user discomfort. Additionally, continuous efforts are being made to tackle problems concerning the correspondence between avatars and virtual garments, as well as algorithmic and technical solutions for simulating fabric drapes.11,12 The fit of actual garments is influenced by various factors such as patterns, sewing techniques, and physical properties of fabrics. However, research on virtual garment fit largely focuses on the similarity between virtual and actual garments,13–16 with limited attention given to reflecting changes in the physical properties of fabrics. To enhance the utility of 3D virtual clothing simulation technology in the clothing design process, it is essential to understand the correlation based on fabric properties and improve faithful reproduction of actual garment fitting in virtual environments.
In this study, our objective was to ascertain whether fabric types could be classified according to their physical characteristics and to establish guidelines for selecting fabric properties tailored to design objectives. Furthermore, we intended to compare the differences in appearance based on fabric characteristics using virtual clothing simulations, aiming to provide foundational data to assist in the production of virtual garments.
Materials and methods
Selection of shirt woven fabric for analysis
We requested fabric samples from manufacturers and collected them randomly. In total, 83 fabric samples were obtained, accompanied by basic sales information such as blend ratios, weight, width, and yarn count. After excluding fabrics unsuitable for shirt purposes, such as mesh fabrics or those with decorative weavings causing uneven thickness, we selected 62 types of fabrics for comparative analysis. The fabrics analyzed included 5 samples of 100% polyester, 3 samples of 100% cotton, 1 sample of 100% silk, and 1 sample of 100% nylon. Additionally, there were 33 samples of cotton blend fabrics, incorporating various materials like wool, silk, linen, nylon, and polyester in different proportions with cotton. Lastly, 19 samples of synthetic fiber blend fabrics were included, bringing the total to 62 fabrics analyzed.
Measurement method for properties and drape properties of woven fabrics
The mass per unit area, thickness, and bending stiffness of the fabric were measured by referring to the research method of Yoon. 17 Additionally, to assess the drape properties of real fabrics, a drape-testing apparatus developed by the Korea Institute of Industrial Technology was used. For the virtual fabrics, drape measurements were conducted using simulated drape images obtained using CLO 3D.
Measurement methods for KES-FB properties
For the KES-FB experiments, 20 × 20 cm2 square-shaped samples were prepared after marking the fabric (Figure 1(a)). To minimize the fabric damage, the measurements were conducted in the following order: mass per unit area, thickness, and bending stiffness. Each measurement was performed using the Woven standard conditions of the KES-FB system, as described in Table 1. An analytical electronic scale obtained from compression testing was used to measure the weight, which was divided by the area to calculate the mass per unit area. The thickness was determined using the T0 value from the compression testing, which is the value when the pressure pressing the fabric is 0.5 gf/cm2.
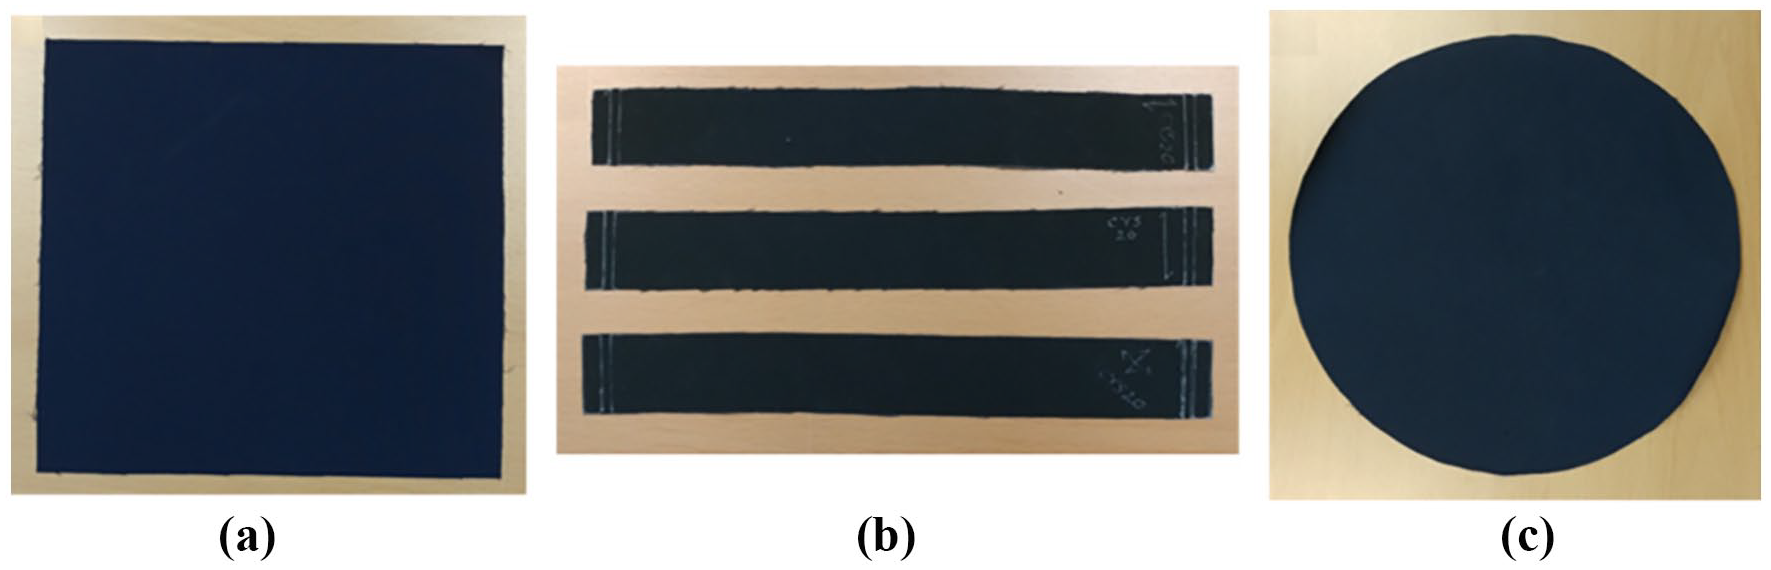
Examples of fabric sample specimens for property measurements: (a) sample for KES-FB measurements, (b) sample for CLO fabric kit measurements (warp, weft, bias directions), and (c) sample for drape measurements.
Measurement items for fabric properties of KES-FB.

Measurement methods for CLO fabric kit properties
For the CLO fabric kit measurements, samples were prepared in three directions: warp, weft, and bias, with rectangular dimensions of 22 × 3 cm2 (Figure 1(b)). The measurements were conducted in the following order to minimize fabric damage: weight, thickness, and bending stiffness. The measurement methods are listed in Table 2. First, the weights of the three samples in the warp, weft, and bias directions were measured simultaneously using a simple electronic scale. Thereafter, the weight per unit area (unit: g/cm2) was calculated by dividing the weight by the fabric area. The thickness was measured using a digital thickness gage. For the bending stiffness, the KES-FB measured the bending force, whereas the CLO fabric kit measured the bending length. As the measurement units differed, the bending length was converted into mN·cm and used to calculate the bending stiffness according to the KS K ISO 9073-7 standard using Equation (1). The bending length was obtained using the bending test kit provided by the CLO fabric kit and converted into bending stiffness using the formula specified in the standard.

G: bending rigidity (mN‧cm)
m: Unit weight of the test specimen per unit area (g/m²)
C: Overall average bending length of the test samples (cm)
Measurement items for fabric properties of CLO fabric kit.

Measuring the drape properties of the actual fabric
To measure the drape performance of the fabric, a drape performance measurement device was used, which was designed to obtain the draped appearance of the fabric on an acrylic cylinder with a diameter of 7.5 cm and height of 30 cm. 8 Circular experimental samples with a diameter of 25 cm were prepared (Figure 1(c)). The measurements were performed by aligning the center of the cylinder with the center of the sample and obtaining high-resolution images of the draping appearance of the fabric on the top and side of the cylinder. We calculated the drape coefficient using Equation (2) based on the top-surface image of the draped fabric.
Measuring the drape properties of the virtual fabric
Virtual fabric drape measurements were simulated using CLO 3D software in the same manner as the actual fabric drape measurement method, and images in the top and side directions were obtained. 8 To measure drape performance, we calculated the area based on an image of the top surface of the draped fabric. Assuming the area of the circular shape with a diameter of 25 cm to be 1, we quantified the drape performance by calculating the area ratio using Equation (2) when the fabric was pressed by the drape, referring to it as the drape coefficient. A low drape coefficient indicates a high drape performance, and vice versa.

Data analysis methods for fabric properties and drape characteristics
SPSS 26.0 was used to analyze the correlation between the unique fabric properties and the drape coefficient obtained from both the KES-FB and CLO fabric kits for the same fabric samples. Next, factor and cluster analyses were conducted using the properties of the shirt fabrics; thereafter, a one-way ANOVA was performed to compare the clusters and groupings based on the fabric properties. Discriminant analysis was performed to validate the grouping, and a classification function was created to discriminate fabric clusters based on their properties.
Selection of clothing items
In contemporary usage, a shirt is an upper-body garment worn on the torso, characterized by collars, cuffs, and a front closure. Moreover, with the expansion of leisure and casual lifestyles, shirts have taken on a relatively large role as casual outerwear and have become widely popular items, regardless of gender and age.18–21 Shirts can be categorized into formal, casual, and sports styles, depending on their intended use. The typical structure of a shirt includes a front panel, back panel, collar, sleeves with cuffs, front plackets, yoke, and pockets. Shirts offer a wide array of design possibilities by incorporating various elements, such as back pleats, closure methods, shoulder embellishments, and pocket shapes. Furthermore, by making structural adjustments; varying silhouettes; and selecting different fabrics, print patterns, and colors, a diverse range of shirt designs can be creatively achieved. The ability to create diverse designs through modifications allows for easy customization to suit individual orders. Additionally, the design and production of shirts are considered fundamental in clothing construction education in fashion-related college curriculums.18,19,22–25
Shirts offer versatile design possibilities tailored to various purposes and serve as apparel items capable of incorporating a wide range of fabrics. Therefore, in this study, a basic shirt pattern was chosen and applied to virtual garment fitting with various fabrics, with the anticipation of demonstrating high utility in future research endeavors.
Application in virtual garment production
In this study, we used patterns for men’s shirts (Figure 2) and fitted them based on the default avatar size in CLO 3D (Table 3). Furthermore, for each cluster of shirt fabrics, we selected three representative fabrics closest to the mean of the cluster. Thereafter, virtual clothing was performed using these fabrics to compare and analyze the fit of the shirts according to the virtual fabrics.

Shirt patterns used for virtual clothing.
Body size of avatar unit (cm).

The 3D virtual clothing simulation software used in this study was CLO 3D, which is widely used in the fashion design industry. 9 It facilitates simultaneous pattern design and clothing simulation. Once the garment pattern was designed, the simulation window enabled the simulation of the garment production process. The fitting information was evaluated by analyzing the garment fit maps, such as the stress map, strain map, and show pressure points, generated during the simulation process, thereby assessing the fit of the clothing.
Silhouette
A comparison was made to determine whether or not the outline and silhouette of the shirt varied based on the fabric properties.
Stress map
A stress map is the level of force generated based on the area, volume, and movement of the avatar when a cloth is worn on it, and it is expressed in garment pressure (kPa). The pressure level within the program was divided into eight steps in the range of 0–100 kPa to distinguish the pressure ranges, and the corresponding color range was set, as shown in Table 3, to represent the color distribution.
Strain map
A strain map is the pressure that causes the garment to deform because of external forces. It allows the assessment of the stretchability of the garment under forces such as the avatar or gravity, and it is expressed as a strain percentage ranging from 100% to 120%. A fabric that experienced no external force was represented in green, whereas the color became closer to red as it became relatively tight under pressure (Table 4).
Color range of stress map and strain map.


Show pressure points
The areas where clothing came into contact with the avatar were indicated by blue dots, indicating less room for flexibility as the distribution of contact points increased. Further, the show pressure points indicated the locations of the areas experiencing pressure.
Results
Analysis of correlation between KES-FB and CLO fabric kit property measurements
The properties measured using the KES-FB and those measured using the CLO fabric kit were compared. The results showed significant correlations at a significance level of 0.01 (Table 5).
Correlation analysis results of shirt fabric measured by KES-FB and CLO fabric kit (N = 62).

<0.01.
The unit weight per area showed a high correlation coefficient of 0.998 was observed. The KES-FB and CLO samples yielded similar results (Figure 3(a)). Regarding thickness, a comparison was made between the value of the CLO fabric kit’s digital thickness gage and the T₀ value obtained from the compression test using the KES-FB. The KES-FB measurement results were larger than those of the CLO fabric kit. However, the correlation coefficient was 0.859, indicating moderate correlation (Figure 3(b)). The correlation coefficient for bending stiffness was 0.776 (Figure 3(c)). This suggested that even for the same fabric, there may be differences in the measurement of bending owing to variations in the method of measuring bending between different devices, despite converting the units to force values. A high correlation of 0.801 was observed between the drape coefficient of the real and virtual fabrics. However, when comparing the measurements, the drape coefficient of the virtual fabric was relatively high, indicating that the drape properties of the virtual fabric, based on measurements from the CLO, were not as favorable as those of the actual fabric (Figure 3(d)).

Comparison of KES-FB and CLO fabric kit measurements: (a) mass per unit area, (b) thickness, (c) bending, and (d) drape coefficient.
A comparison of the fabric properties, such as mass per unit area, thickness, bending, and drape, measured using both the KES-FB and CLO methods revealed a high positive correlation between them. Notably, there was a strong correlation between the mass per unit area and thickness. Therefore, we analyzed the differences in the fit of virtual garments based on changes in the fabric properties when real fabrics were measured using the CLO Fabric kit and applied to create virtual fabrics for virtual clothing production and simulation.
Clustering analysis of KES-FB fabric property measurements and design of discriminant classification formulas
Based on the factor scores obtained from the KES-FB measurements of the 62 collected fabrics, a K-means cluster analysis was conducted, resulting in three clusters. Cluster 1 included 20 fabrics, cluster 2 included 30 fabrics, and cluster 3 included 12 fabrics. The average values of the mass per unit area, thickness, bending, and drape coefficient for each cluster are listed in Table 6, with all items showing statistically significant differences among the clusters.
Comparison of mean values by cluster of KES-FB measurements.

a < b < c.
<0.001.
Cluster 1 exhibited the highest mass per unit area and the highest thickness; however, it had the lowest drape coefficient, indicating that it was a thick and flexible fabric with excellent drape characteristics. Cluster 2 had the lowest mass per unit area and the lowest thickness. The bending was also lower than those of the other clusters. However, its drape coefficient was higher than that of cluster 1. Therefore, this cluster consisted of lightweight and thin fabrics with slightly stiff characteristics. The mass per unit area of cluster 3 was close to the average; however, its thickness was slightly higher than the average. Additionally, it exhibited the highest bending and drape coefficient, making it the stiffest fabric.
In the discriminant analysis, we used the fabric clusters as the dependent variable and the mass per unit area, thickness, bending, and drape coefficient as predictor variables. The results showed that all four predictor variables had significant explanatory power in differentiating the fabric clusters, with p-values less than 0.001 (Table 7). The significance of the discriminant functions was confirmed, with discriminant function 1 having a Wilks’ Lambda of 0.119 and a chi-square of 122.283 (p < 0.001) and discriminant function 2 having a Wilks’ Lambda of 0.387 and a chi-square of 54.576 (p < 0.001). This indicated that the discriminant functions effectively discriminated between the fabric clusters. The classification accuracy was 100% for cluster 1, 96.7% for cluster 2, and 100% for cluster 3, resulting in an overall classification accuracy of 98.4% (Table 8), demonstrating a high level of accuracy in fabric cluster classification.
Test results for homogeneity of Clusters of KES-FB.
Discriminant probabilities based on Clusters of KES-FB n(%).

The discriminant functions, as designed and based on Table 9, are as follows.

Discriminant functions based on Clusters of KES-FB.

To classify a fabric into an appropriate cluster, the specific values of the unit-area weight, thickness, bending, and drape coefficient should be substituted into their respective functions. The function that yielded the highest value determined the cluster to which the fabric belonged.
Clustering analysis of CLO fabric kit fabric property measurements and design of discriminant classification formulas
The results of the K-means clustering analysis conducted on 62 collected fabrics were as follows. Using the factor scores of the CLO measurements, the fabrics were classified into three clusters: 18 fabrics in cluster 1, 31 fabrics in cluster 2, and 13 fabrics in cluster 3. The average values of the fabric properties, including mass per unit area, thickness, bending, and drape coefficient for each cluster, are presented in Table 10; statistically significant differences were observed in all categories.
Comparison of mean values by cluster of CLO measurements.

a < b < c.
<0.001.
Cluster 1 of the CLO fabric kit exhibited the highest mass per unit area and thickness with the lowest drape coefficient. Therefore, cluster 1 is a fabric with excellent drape characteristics, thickness, and flexibility.
Cluster 2 showed the lowest mass per unit area and thickness, as well as the smallest bending among the three types. However, compared with cluster 1, it had a higher drape coefficient, indicating that it was a lightweight, thin, and relatively flexible fabric with a slightly stiff texture.
Cluster 3 had the closest mass per unit area and thickness values to the average with the highest bending and drape coefficient. Hence, cluster 3 represents a fabric with medium thickness and the stiffest texture.
A discriminant analysis of the shirt fabrics was conducted using the dependent variable (shirt fabric clusters) and the predictor variables (mass per unit area, thickness, bending, and drape coefficient). We examined whether or not each predictor variable significantly explained the differences among the shirt fabric clusters, and all four variables showed a significant effect (p < 0.001; Table 11). The significance of the discriminant functions was verified, with discriminant function 1 having a Wilks’ Lambda of 0.084 and a chi-square of 142.159 (p < 0.001) and discriminant function 2 having a Wilks’ Lambda of 0.360 and a chi-square of 58.769 (p < 0.001). This indicated that the discriminant functions had significant discriminatory power between the fabric clusters. The classification accuracy was 100% for cluster 1, 96.8% for cluster 2, and 100% for cluster 3, resulting in an overall accuracy of 98.4% (Table 12), indicating a highly accurate classification. Therefore, the classification function equation designed through discriminant analysis was as follows. By substituting the variables, the cluster could be determined by selecting the equation with the highest value. The discriminant functions, as designed and based on Table 13, are as follows.

Test results for homogeneity of Clusters of CLO fabric kit.

Discriminant probabilities based on Clusters of CLO fabric kit n(%).
Discriminant functions based on Clusters of CLO fabric kit.

Application of 3D virtual clothing
Comparison of draping images between actual and virtual fabrics
To compare the drape images of the virtual fabrics based on the characteristics of the clusters, three representative fabrics were selected for each cluster based on their proximity to the cluster means. Additionally, fabrics corresponding to the KES-FB measurements were referred to as “actual fabrics,” whereas fabrics obtained by applying CLO measurements to CLO simulations were named “virtual fabrics.” The measurement values for the representative fabrics of each cluster are listed in Table 14, and the drape images of the actual and virtual fabrics are presented in Table 15. Although there were differences in the measurement values for each fabric, the number of nodes appearing on the upper surface and the draped appearance of the fabric on the side surface exhibited similar tendencies, as observed in the drape images of the fabrics.
Comparison of measurements for representative fabrics by cluster.

Comparison of drape Images between actual fabrics and virtual fabrics.


Comparison of virtual clothing images based on selected fabrics
The virtual clothing results for the shirts, considering the properties of the fabrics (stress, strain, and shear pressure points), are listed in Tables 16 and 17. When comparing the basic silhouettes, noticeable wrinkles were observed under the arms and on the backs of clusters 2 and 3, which had higher drape coefficient than cluster 1. This is because the fabrics in cluster 1, with low drape coefficient, flowed flexibly without forming wrinkles along the body curves, whereas the fabrics in clusters 2 and 3, with high drape coefficient, wrinkled and conformed to the body curves. Garment pressure and contact points were primarily observed on the shoulders, upper back, and collar, where the weight of the garment was concentrated. Fabrics with high bending stiffness values and drape coefficient exhibited significantly varied color distributions, with a prominent presence of red. When comparing the virtual clothing results by cluster, clusters 2 and 3 showed higher garment pressures and contact points than cluster 1. However, in terms of strain, the fabrics in cluster 1 exhibited significantly varied color distributions owing to the high drape coefficient, indicating a relatively high drape quality. The fabric in cluster 3-3, despite having a low drape coefficient, showed a higher distribution of strain and a lower distribution of garment pressure than fabrics within the same group. This may be due to the high bending stiffness value. As the drapability of the fabrics is influenced by various interconnected properties, it is necessary to simultaneously consider multiple factors.
3D virtual clothing of representative fabrics by cluster.


Comparison of Clothing stress, strain, and Show Pressure Points in 3D virtual clothing for Representative Fabrics by Cluster.


Discussion and conclusion
This study aimed to classify and analyze 62 types of fabrics based on their physical properties to determine if fabrics could be distinguished according to their physical characteristics and to create guidelines for selecting fabrics suitable for design purposes. Additionally, virtual clothing simulations were conducted to compare the visual differences based on fabric properties, aiming to provide foundational data to aid in virtual garment production.
First, the relationship between the properties of 62 actual shirt fabrics and virtual fabrics was compared and analyzed. The results showed a high correlation in all aspects, suggesting that the virtual garments created and simulated using the CLO Fabric Kit, which applied fabric properties, were comparable to the garments produced using actual fabrics.
Second, factor and cluster analyses were conducted based on the measured properties of the collected fabrics, classifying both the KES-FB and CLO Fabric Kit measurements into three clusters. Although the methods for measuring the fabric properties differed, the trends for each cluster were similar. Cluster 1 consisted of fabrics with the highest mass per unit area and thickness but the lowest drape coefficient, indicating thick and flexible fabrics. Cluster 2 comprised fabrics with the lowest mass per unit area, thickness, and bending, making them lightweight and flexible but slightly stiff owing to a higher drape coefficient as compared with Cluster 1. Cluster 3 included fabrics with mass per unit area and thickness similar to the average but with the highest bending and drape coefficient, making them the stiffest fabrics. When comparing the cluster results with the specifications provided by the manufacturers, such as blending ratios, shrinkage, and post-processing, the fabrics in cluster 1 were deemed suitable for winter shirts or blouses, as they are primarily made of polyester and acetate. The fabrics in cluster 2 were mostly cotton and nylon blends, with the 60 s or 80 s count; they were suitable for summer shirts with a lightweight crisp texture or lightweight outer shirts. The fabrics in cluster 3 were thicker and heavier than those in cluster 2, with a softer and thicker sensation when touched. Compared with those in cluster 1, they felt lighter and thinner, and the fabrics mainly consisted of polyester, cotton, and Tencel, making them suitable for spring and autumn shirts.
Thirdly, to determine whether the fabric clusters identified through statistical analysis exhibited visually distinct differences across clusters, we utilized 3D virtual clothing simulations. Three virtual fabrics most similar to the average values of each cluster were selected for the simulations. We observed that the representation of features such as virtual garment silhouettes, clothing pressure, deformation rate, and contact point maps varied significantly depending on the fabric’s characteristics. By comparing cluster-specific properties such as clothing pressure and deformation rate based on the characteristics of each fabric, we noted that fabrics with good drape and high flexibility exhibited fewer color indications in the clothing pressure map and more color indications in the deformation rate map. Consequently, it was confirmed that the characteristics of the clusters were visually distinguishable.
Consequently, the results of this study suggest that even less experienced designers can achieve diverse implementations in 3D virtual clothing production and design. The increasing utilization of 3D virtual sampling is leading to the incorporation of 3D design-related tasks into the responsibilities of Technical Designers. These tasks include creating 3D virtual samples (such as altering fabrics and colors, adjusting design variations, and confirming pattern balance and fit), producing lookbooks using 3D images, and crafting 3D virtual samples that reflect fabric properties. However, as this is a newly emerging field in the fashion industry, there is often a low understanding of these tasks, and information related to virtual materials and designs is frequently provided separately without integration. Consequently, in cases where both fabric and design are crucial considerations in 3D design, it may be challenging to find the necessary information. Therefore, novice 3D designers may struggle with understanding differences based on fabric properties in virtual environments due to their limited comprehension of the tasks. In such scenarios, it is believed that referring to the clustering results of materials from this study could assist in selecting virtual fabric properties suitable for seasonal and design purposes, thus providing valuable assistance in their tasks. These findings are expected to be beneficial in utilizing 3D virtual clothing simulations in the fashion industry for online sales and marketing and in the gaming industry for avatar outfit designs.
However, this study was limited to shirts as clothing items, and there was no examination of fabric processing and organization. Therefore, future research should investigate the application of various materials, clothing items, and designs. It can also explore the differences in visual images when virtually fitting fabrics with controlled weights, thicknesses, and blending ratios or when virtually fitting fabrics with the same weight and thickness but different blending ratios. Additionally, while there was a relatively high correlation between the measured properties of the KES-FB and CLO fabric kit, the bending property showed a weaker correlation than the other properties. Therefore, investigating the correlation between the bending measurements of the KES-FB and CLO Fabric Kits and determining the extent of correction for the CLO fabric kit bending may further reduce the gap between the actual and virtual drapes. Furthermore, this study has limitations in that it did not conduct a comparison between virtual samples and real samples. In future research, we aim to compare the differences between virtual and real samples, analyze these differences, and strive for more comprehensive virtual sample production.
With the increasing consumer culture of online shopping, the utilization of 3D virtual clothing simulation technology in fashion marketing is becoming diverse. This technology allows for virtually trying on garments and checking fit online, and it can be creatively applied to digital fashion shows and promotional materials using virtual models. This application could be extended to various aspects of clothing design, production, distribution, sales, and marketing. Moreover, the data obtained from these results can be used for AI and big data applications. With the advancement of 3D virtual clothing simulations, consumers are expected to be able to use virtual garments on their virtual bodies, allowing them to preview and purchase clothing in a generalized system. To achieve this, it is necessary to conduct research on virtual bodies, including diverse motions, to accurately reflect consumer body shapes in virtual clothing simulations.
Creating physical clothing samples requires a significant number of raw materials, which leads to waste. However, using 3D virtual clothing simulation technology, 3D samples can be produced without using raw materials, thereby enabling online fitting and evaluation sessions. This could lead to a reduction in clothing development costs and waste, contributing to the eco-friendliness of the apparel and fashion industry. Furthermore, it can save time and expenses in sample production, enabling rapid progress in the entire process of design, clothing development, and production and expanding the values of sustainable fashion and sustainable management.
Footnotes
Declaration of conflicting interests
The author(s) declared no potential conflicts of interest with respect to the research, authorship, and/or publication of this article.
Funding
The author(s) disclosed receipt of the following financial support for the research, authorship, and/or publication of this article: This research was supported by the Technology Innovation Program (Grant No.: 20000806, The development of AR-VR cloud platform for fashion product) funded by the Ministry of Trade, Industry & Energy (MOTIE, Korea).