
Abstract
A method for predicting the complex physical properties of fabric using a simple measurement method has been developed. For this, a correlation analysis was performed between the data measured by the traditional measurement method for the physical properties of fabric, KES-FB, and by the simple measurement method, CLO Fabric Kit, which showed a high correlation. Then, a multiple regression analysis was performed between the drape coefficient and the KES-FB complex factors to find a factor that had a major influence on the drape coefficient. From this result, a regression equation for estimating the drape coefficient has been obtained. Euclidean distance calculation was used to find the fabric from the database that is most similar to the measured sample, from which the drape coefficient was predicted. Finally, it was confirmed that there is no statistical difference between the actual drape coefficient and the predicted drape coefficient.
Introduction
Recently, the fashion industry is making various attempts to enhance its competitiveness and create high added value by implementing the information technology. One of the most important attempts is the introduction of 3D virtual clothing.1–3
The 3D virtual clothing production system is a system that can simulate the silhouette and details of clothing according to patterns and materials in a virtual space before actual clothing production.
Recently, it is possible to produce highly realistic virtual clothes, which can be used to reduce sample production cost and shorten the production cycle of fashion products.4–6
In the virtual clothing system, the ability to render the virtual clothing as similar as possible to real clothing is one of the most important issues. This expressive power has a decisive influence on the drape characteristics, which are important factors that determine the appearance and silhouette of a garment. Because the physical properties of clothing materials have a great influence on the emotional characteristics such as appearance, feel, and fit, the need for research on material properties is increasing.7,8
Currently available commercial 3D virtual clothing solutions include CLO3D (Clo Virtual Fashion, Korea), Gerber Accumark3D (Lectra, France), Modaris3D (Lectra, France), Optitex3D (Optitex, Israel), Style3D (Linctex, China), V-Stitcher (Browzwear, Israel), Tuka3D (Tukatech, USA), etc. Sayem. 9 CLO3D originated from Marvelous Designer, which was developed for realistic clothing modeling in the game and computer graphics industry, and is optimized for virtual fashion shows or product presentations. Optitex3D is a professional CAD system capable of 2D pattern and marker making, but is not optimized for presenting the products in 3D. V-Stitcher is linked to various programs such as Lotta, Stylezone (merchandising), Tech Pack (work order), and FabricAnalyzer (fabric property analyzer).
According to Slintel, 10 there are 24 commercial systems in the field of virtual clothing, with 11,955 customer companies worldwide. Among them, CLO 3D has 435 customers with a market share of 3.64%, followed by Browzwear (0.26%) and OptiTex (0.02%).
In this study, the CLO 3D software (CLO Virtual Fashion, Korea) was used to make virtual clothes. It measures the physical properties of the fabric using its own simple measurement device, the CLO Fabric Kit. Although it is easy to use, it has a limitation in that it cannot reflect the complex emotional characteristics of the fabric such as the drapeability. On the other hand, KES-FB (Kawabata Evaluation System for Fabrics), a widely used fabric property measurement device, can measure the various characteristics of fabrics through complex mechanical tests. However, it is a very expensive set of equipment and takes quite a long time for measurement.
In this study, a database of fabric properties measured with CLO Fabric Kit and KES-FB has been established. Finally, a method for predicting the drape coefficient of fabrics only from the measurement results of CLO fabric Kit has been developed by analyzing the relationship between two data sets in the database.
Theoretical background
CLO virtual cloth simulation system
The CLO 3D virtual clothing simulation system is a software that allows designers to design clothing in real time and quickly check for pattern errors. It is used by many apparel companies worldwide because it can produce not only clothes, but also fashion items such as shoes, bags, and gloves. 4
KES-FB test
The KES-FB test is a method to objectively evaluate the complex characteristics of fabric by measuring six basic mechanical properties including weight, compression properties, surface properties, bending properties, shear properties, and tensile properties. It is a method to quantitatively evaluate the emotional properties of fabrics by converting the measured mechanical properties into a hand value and a total hand value using the KES conversion equations. 11
Drape property
The drape property refers to the property of the fabric to hang under its own weight to create wrinkles. Drapeability is a characteristic that is closely related to the fit and appearance of a product.12,13 The drape coefficient, which is used to evaluate the drape properties of a material, is a qualitative measure of the extent to which a fabric is draped. The drape coefficient is defined as the ratio of the area of the fabric before and after being draped. Since the area of the fabric before being draped is constant, the area after being draped determines the drape coefficient of the fabric. 14 The drape coefficient can be measured by a simple device such as Cusick drapemeter. 15
Experimental
Preparation of specimen
A total of 243 types of woven fabrics and 285 types of knitted fabrics were prepared for the experiment. As shown in Table 1, woven fabrics were classified into Outer, Active, Top, and Dress. Knitted fabrics were classified into Outer, Active, and Top according to the use of clothes and emotional feeling. However, each fabric is not used exclusively for one kind of garment and therefore woven fabrics were finally classified into 123 types for Outer, 73 types for Active, 118 types for Top, and 71 types for Dress. Similarly, knitted fabrics were classified into 74 types for Outer, 77 types for Active, and 236 types for Top.
Classification of clothing according to use and emotional feeling.

Experimental method
KES-FB method
Fabric specimens were prepared as 20 cm × 20 cm square shapes. As shown in Table 2, 17 items of six property groups including tensile properties, bending properties, shear properties, compression properties, surface properties, and weight were measured in the warp and weft directions under standard conditions.
KES-FB fabric property measurement items.

CLO fabric kit
Figure 1 shows the CLO Fabric Kit, a simplified fabric property measuring device developed by CLO Virtual Fashion. The samples were cut into 22 cm × 3 cm strip in the warp, weft, and bias directions. Five properties were measured including tensile properties, bending properties, shear properties, thickness, and weight.
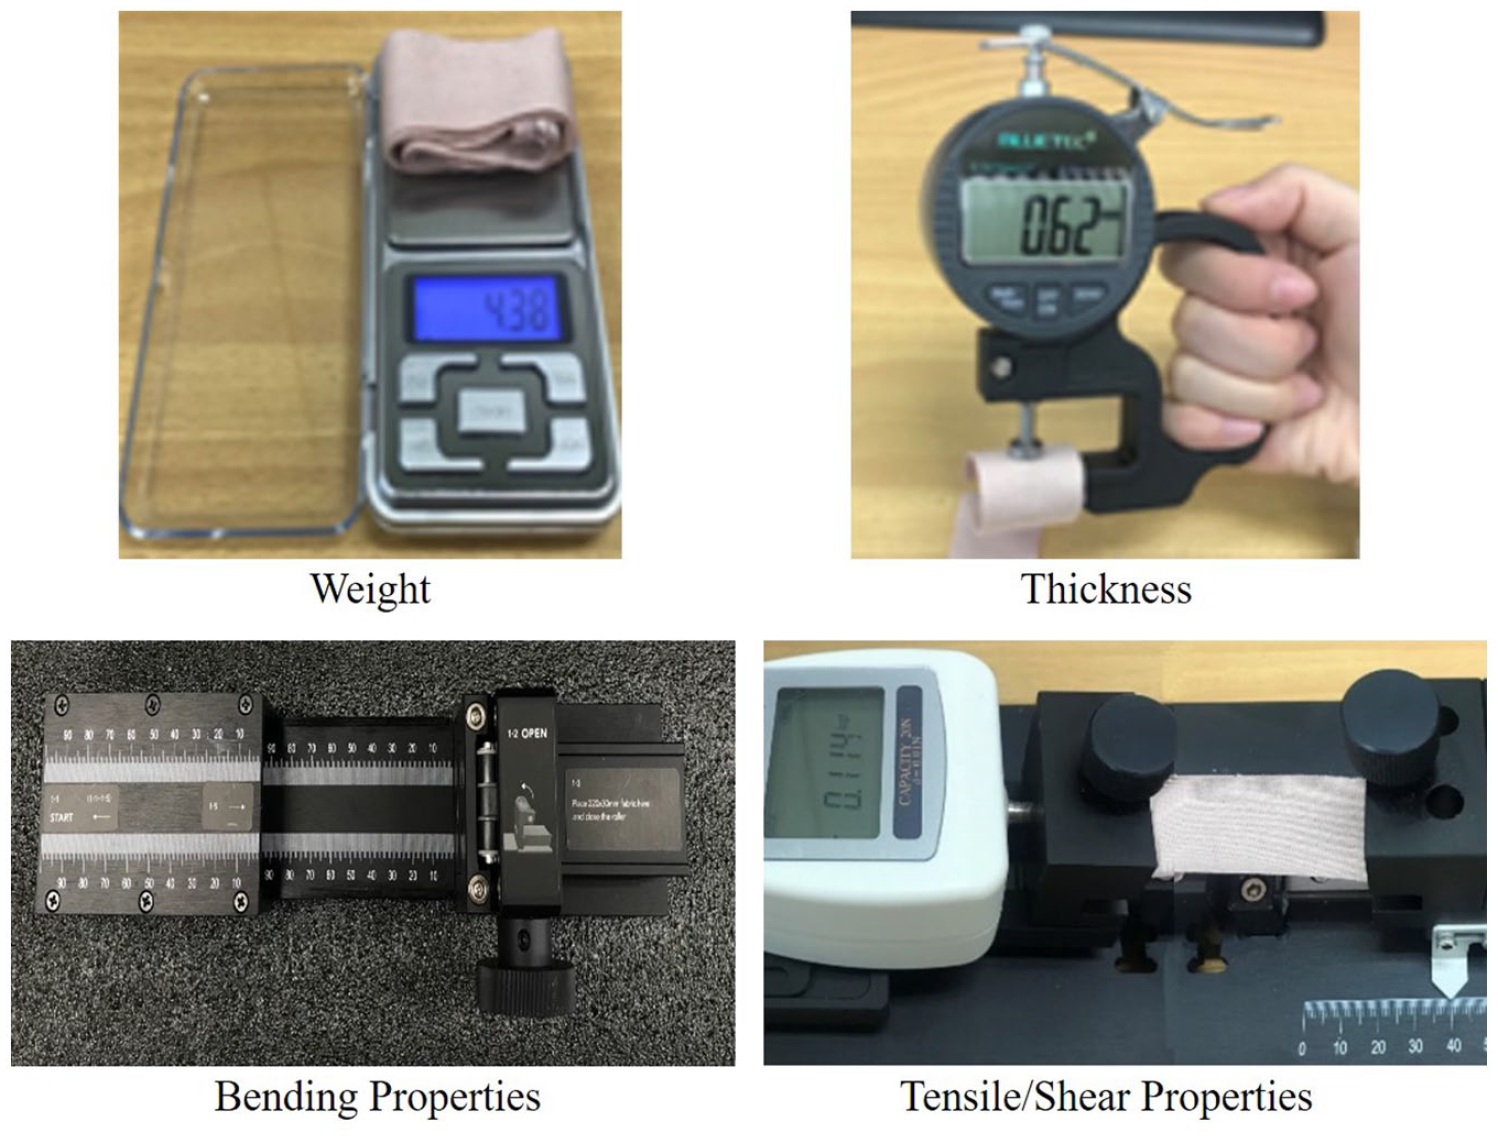
Overview of CLO fabric kit.
The measurement items of CLO Fabric Kit are as shown in Table 3.
Measurement items of CLO fabric kit.

Drape coefficient measurement
Figure 2 shows the device developed by the Korea Institute of Industrial Technology (KITECH), which measures the drape coefficient using image analysis based on the studies of Park. 16 The device consists of two high resolution cameras and four lighting devices. A circular fabric specimen is placed on a circular cylinder, and images of the fabric are taken with the cameras installed on the top and side before and after drape test. The drape coefficient of the fabric is calculated by analyzing the two images.

Overview of drape coefficient measurement device.
Results and discussion
Experimental results
A database has been built with KES-KB test result, hand value, and CLO Fabric Kit test result. The drape coefficient of the fabric was calculated as equation (1) using the image of the fabric taken with the drape coefficient measuring device developed in this study.

Relational analysis on KES-FB and CLO test data
Common properties measured in KES-FB and CLO tests were weight, thickness, bending stiffness, shear stiffness, and tensile strength. Since the correlation coefficient of tensile strength was relatively smaller than that of other physical properties, subsequent correlation analysis was performed on other physical properties except for tensile strength.
Analysis result of woven cloth
Table 4 is the correlation coefficient between KES-FB data and CLO data for woven fabric. It was found that OW, AW, TW, and DW fabrics all had a high correlation between weight and thickness with a correlation coefficient of 0.9 or higher. It was found that bending stiffness and shear stiffness had a high correlation except for TW fabric with a correlation coefficient of 0.5701 and AW fabric with 0.6215.
Correlation coefficient between KES-FB and CLO data for woven fabric.

**p < 0.01.
Analysis result of knitted cloth
Table 5 is the correlation coefficient between KES-FB data and CLO data for knitted fabrics. OK, AK, and TK fabrics all showed a high correlation between weight and thickness with a correlation coefficient of 0.9 or higher. It can be seen that bending stiffness and shear stiffness have a high correlation with the exception of OK fabrics with a correlation coefficient of 0.5364.
Correlation coefficient between KES-FB and CLO data for knitted fabric.
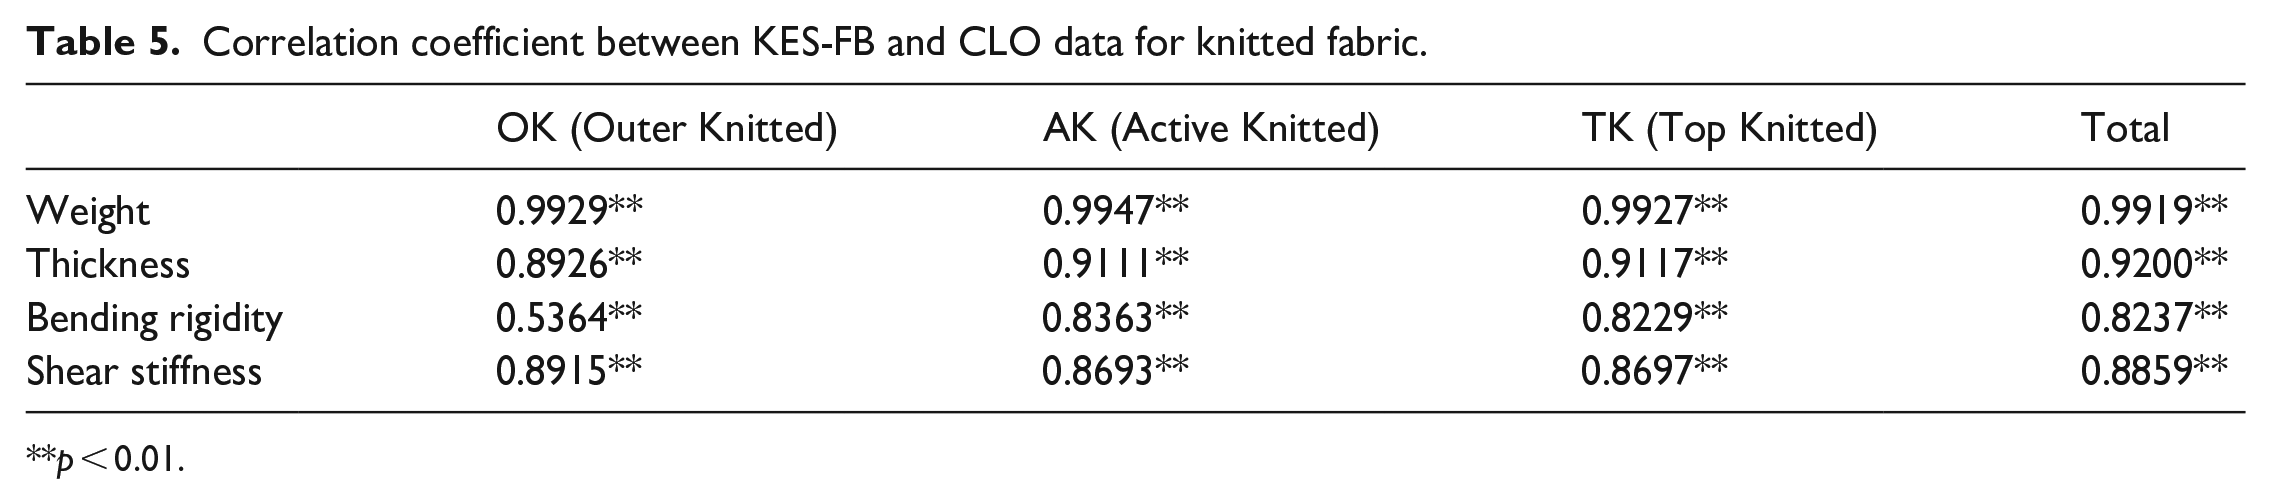
**p < 0.01.
From these results, it can be concluded that KES-FB and CLO data are correlated, and can cross referenced from the database.
Relational analysis on KES-FB data and drape coefficient
As a result of correlation analysis on the KES-FB data of the woven fabric and the drape coefficient, it was found that the correlation coefficient of (B/W)1/3 was the largest as shown in Table 6. (B/W)1/3 and (G/W)1/3 are commonly used data in KES-FB analysis that are related to the bending behavior and shearing behavior of the fabric respectively. By dividing the bending stiffness B and shear stiffness G by the weight of the specimen, the values can be normalized.
Correlation coefficient between KES-FB data and drape coefficient for woven fabric.

p < 0.05. **p < 0.01.
As a result of correlation analysis on the KES-FB data of knitted fabrics and the drape coefficient, it was also found that the correlation coefficient of (B/W)1/3 was the largest as shown in Table 7.
Correlation Coefficient between KES-FB data and Drape Coefficient for Knitted Fabric.

p < 0.05. **p < 0.01.
Search method for similar fabric
For the test, the CLO Kit Test was conducted for three types of fabrics, and the results were compared with the CLO data in the database using the Euclidean distance calculation formula to search for the most similar fabric. Then, the drape coefficient was predicted from the (B/W)1/3 value of KES-FB data of the corresponding fabric and compared with the actual drape coefficient. For this, CLO data with different units such as mass, thickness, shear strength, and bending stiffness were standardized. The Euclidean distance calculation formula is as shown in equation (2).

where, pi = CLO data in database
qi = CLO data of sample
Table 8 shows the similar fabrics searched by Euclidian distance calculation method using the weight-thickness-shear stiffness, weight-thickness-bending stiffness, weight-thickness-shear stiffness-bending stiffness data as the input respectively. In the case of woven fabric, the smallest difference was observed when weight-thickness-bending stiffness data was used.
The difference between (B/W)1/3 value of three sample and similar woven fabric.

Table 9 shows the results of the same test for three types of knitted fabric samples, which showed the smallest difference when using weight-thickness-shear stiffness data.
The difference between (B/W)1/3 value of three sample and similar knitted fabric.

Comparison results of drape coefficient
The drape coefficient was obtained by inputting the (B/W)1/3 value of the searched similar fabric into the regression equation (3) obtained through the correlation analysis between the drape coefficient and the KES-FB (B/W)1/3 factor. Then a paired sample t-test was performed to find out the difference between the actual and the predicted drape coefficient.

Table 10 shows the actual and predicted drape coefficients of woven and knitted sample fabrics.
Actual and predicted drape coefficient of sample fabrics.

Table 11 shows the results of paired sample t-test to find out the difference in drape coefficients. In the case of woven fabrics, t was −1.232 and p was 0.243, which was statistically insignificant with the significance level of 0.05. Therefore, it can be said that there is no difference between the actual and predicted drape coefficient. In the case of knitted fabric, t was 4.237 and p was 0.003, which was statistically significant with the significance level of 0.05. Therefore, it can be said that there is a difference between the actual and predicted drape coefficients of the knitted sample fabrics.
Difference between the actual and predicted drape coefficients of three sample fabrics.

**p < 0.01.
Twenty types of additional woven fabric samples were tested for the verification of the proposed method. The result of the paired sample t-test is as shown in Table 12.
Difference between the actual and predicted drape coefficients of additional woven fabrics.

As a result, t was 2.042 and p was 0.055, indicating that it was not statistically significant with the significance level of 0.05. Therefore, it can be said that there is no difference between the actual and predicted drape coefficients.
Conclusion
In this study, a fabric property database has been established using the data from the traditional KES-FB method and the CLO Fabric Kit method used in CLO 3D, a virtual clothing simulation system. An algorithm has also been developed to predict the drape coefficient, one of the most important emotional characteristics of the fabric, from CLO test data using the database. For this, a correlation analysis was performed on KES-DB and CLO test results, which showed a high correlation between them in weight, thickness, bending stiffness, and shear stiffness.
A multiple regression analysis between the drape coefficient and the KES-FB complex factors showed that that the (B/W) one-third factor of KES-FB had a major effect on the drape coefficient of both woven and knitted fabrics. A regression equation to estimate the drape coefficient has also been obtained. To find the most similar fabric from the database, a Euclidean distance calculation formula was developed. The drape coefficient of found fabric was predicted using its KES-FB (B/W)1/3 factor. A t-test was performed to compare the difference between the actual and the predicted drape coefficients of the sample fabrics, which showed that there was little difference between them for both woven and knitted fabrics.
Using the method developed in this study, it is expected to be possible to predict other complex properties of the fabric using a simple test method such as the CLO Fabric Kit beside the complex KES-FB test.
Footnotes
Declaration of conflicting interests
The author(s) declared no potential conflicts of interest with respect to the research, authorship, and/or publication of this article.
Funding
The author(s) received no financial support for the research, authorship, and/or publication of this article.