
Abstract
The level of thermal-moisture comfort experienced by an individual is strongly influenced by the clothing they wear and also influenced by the ease allowance of that clothing. This study aimed to investigate the impact of ease allowances of clothing on thermal-moisture comfort during exercise or movement. Seventeen female subjects were asked to wear sample clothing with different sizes during a designated 5-phase exercise in a climate chamber. Throughout the exercise phases, the temperature and humidity of the microclimate under the clothing were monitored while the subjects provided subjective evaluations of their comfort levels. To account for variation in ease allowances, the 32 experimental repetitions were grouped based on the ease allowance of the clothing worn. The FCE-CRITIC method was then used to determine the variable weights of factors and to compare the thermal-moisture status to the subjective evaluation. Results revealed that humidity was more strongly weighted during RS and RC (i.e., running and recovery phase after exercise) compared to other phases, means that moisture comfort was the main factor driving the clothing comfort sensation within the two phases. The ease allowance of clothing was found to have an impact on the sensations of thermal and moisture comfort during exercise, although this effect was not significant. Furthermore, the study identified the optimum range of ease allowance for thermal-moisture comfort during exercise to be between 6 and 10 cm.
Introduction
Thermal discomfort during exercise is mainly caused by the inability of the body to completely dissipate the large amount of heat it generates. 1 Heat stress affects several physiological functions of the body, including cardiovascular function, central nervous drive, skeletal muscle function, and metabolism, 2 which can ultimately hinder exercise performance and ability.3,4 Previous studies have identified high core temperature as a key factor leading to fatigue during exercise under heat stress. 5 Strategies such as wicking clothing and improving the convection of the microclimate can enhance the evaporation of sweat and heat transfer,6,7 thereby lowering the core temperature and improving thermal comfort. 8 However, clothing that absorbs moisture can cause discomfort due to feelings of stickiness and wetness. 9 Together, thermal and moisture sensations contribute to the overall thermal-moisture comfort of clothing during exercise, with their relative importance varying across different levels of exercise intensity.
Numerous factors affect the thermal-moisture comfort of clothing by influencing the ways in which heat transfers between the body and the environment, including conduction, convection, radiation, and evaporation. 10 Two important factors that influence the approaches to heat transfer are the thickness of the air gap between the skin and clothing and the microclimate within the air gap,11,12 both of which are directly determined by the ease allowance of the clothing. Accordingly, ease allowance is a crucial factor in clothing design as it affects the resistance of clothing to cold and heat.
Over the years, several scholars have studied the effect of ease allowances on thermal-moisture comfort. Atasağun et al. 13 found that undershirt fit significantly impacts the evaporative heat loss of the back region. Veselá et al. 14 reported that the local thermal resistance of clothing increases with the volume of ease allowances, especially for the upper arm, bust, back, front hip, and upper leg. The study by Manabe et al. 15 had similar findings. Additionally, Li et al. 16 observed that the thermal insulation of shirts begins to decrease as a result of natural convection when the air gap thickness is higher than 1 cm. Hu et al. 17 investigated the relationship between ease allowances and thermal insulation and found that sportswear with different ease allowances and sizes had varying insulation properties.
Previous research explored the relationship between the ease allowance of clothing and thermal-moisture comfort for static human bodies or thermal manikins, establishing foundational knowledge for the theory of heat and moisture transfer and providing an important reference for further study of thermal-moisture comfort. Moreover, the thermal-moisture comfort of the human body in motion is a complex scientific topic that is related to ease allowance and leads to the creation of varying microclimates. Further research should be conducted to investigate the effect of ease allowance on comfort for dynamically moving human bodies.
Wearing comfort refers to the psychological sensation that humans experience when dressed, typically evaluated subjectively. Recently, Zhao et al. 18 explored the preference of men and female for the finishing, fabric structure, and composition of summer-shirt fabric using a questionnaire investigation. Li et al. 19 compared the effect of various fabric properties, including heat transfer parameters, on the feeling of coolness. Moreover, Dang et al. 20 evaluated the effectiveness of three types of ventilated clothing in enhancing thermal comfort based on thermal sensation, moisture sensation, and thermal comfort. However, subjective feelings are frequently nebulous and difficult to quantify. Fuzzy comprehensive evaluation (FCE), a multivariable decision-making method based on fuzzy mathematics, is appropriate for quantitatively evaluating uncertain problems. In the field of clothing, FCE is frequently used for individualized product development, 21 evaluation, 22 and testing purposes. This includes the evaluation of the tactile performance and moisture permeability of fabrics, 23 as well as the design and evaluation of functional clothing, 24 among others. However, FCE is not yet extensively utilized for evaluating thermal-moisture comfort in clothing.
To investigate thermal-moisture comfort quantitatively during motion, this study introduced the FCE-CRITIC method to examine the relationship between ease allowance and dynamic thermal-moisture comfort during exercise. Four groups were established to cover the range of ease allowances, and the CRITIC weighting method was utilized to determine the variable weights associated with each factor. To quantitatively evaluate thermal-moisture comfort during exercise, FCE was conducted using the monitored temperature and relative humidity under the clothing. The goal was to uncover the optimal ease allowance range for facilitating dynamic thermal-moisture comfort during exercise.
Experiment
Experimental design
Cotton T-shirts in seven different sizes were chosen to serve as our sample clothing during indoor exercise. The fabric of the T-shirts is characterized by a thickness of 0.62 mm, areal density of 217.80 g/m2, air permeability of 55.28 mm/s, and thermal resistance of 0.1654clo. After washing, the key dimensions of each sample were measured as shown in Table 1.
Key dimensions of the sample clothing.

The experiment was conducted in a climate chamber with a wind velocity of less than 0.2 m/s and conditions set to 21 ± 2°C and 65% ± 5%RH. Seventeen female university students participated in the study, with detailed subject information provided in Table 2. To ensure optimal conditions, subjects were instructed to obtain sufficient rest, maintain normal sleeping hours, and refrain from consuming alcohol within 24 h before the experiment. The experiments were performed by the ethical standards of the Declaration of Helsinki (Association (WMA) 2013). Full explanation of procedures, discomforts, and potential risks of this study were given to all participants prior to obtaining informed consent.
Subjects’ measurement information.

Participants were instructed to acclimate to the indoor temperature and humidity by staying in the climate chamber for 30 min prior to the exercise. Subsequently, they wore clothing samples of varying sizes for the exercise protocol. Temperature and relative humidity in the air gap between the body and clothing during exercise were recorded using heat and humidity sensors (TR-3310, T&D Corporation, Nagano, Japan) with temperature accuracy of ±0.3°C, and relative humidity accuracy of ±5%. The laboratory’s temperature and humidity were regulated by an air-cooled thermo-hygrothermal unit (HF7NQ, Zhongyou Industry Co., Ltd, Shanghai, China).
The study simulated human movement scenarios using a treadmill. According to Gerrett et al. 25 , the middle regions of the anterior and posterior aspects of the torso showed higher sensitivity to thermal stimuli compared to the lateral regions. In addition, the discomfort of sweating in the armpit area during exercise was also took into account. Based on the above, five measurement points were selected to measure the temperature and relative humidity in the air gap between clothing and the body during exercise. Specifically, the measurement points were located at the back, waist, bust, abdomen, and left armpit of the body (Figure 1).

Five measurement points for temperature and relative humidity.
Table 3 presents the results which have been categorized into four groups based on the bust ease allowance for comparative analysis.
The range of ease allowances for each group.

Refer to John McGinnis’ thermal comfort scale, 26 subjective scales were established for thermal and moisture sensations. These scales are illustrated in Figure 2.

The sensation scale used in the experiments.
Experimental procedures
The overall experiment comprised five distinct phases, namely resting for 5 min before exercise (RB), walking briskly at a speed of 4 km/h for 5 min (WB), running slowly at a speed of 5 km/h for 10 min (RS), walking slowly at a speed of 2.5 km/h for 5 min (WS) and a 5-min recovery after the exercise (RC). It has been tested that the subjects could not sweat completely after 5 minutes of running, so the time for RS was set at 10 minutes. During the RB and RC phases, the human body remained static, so the temperature and humidity were only recorded once as the initial and final values. Conversely, within WB and WS, owing to minor fluctuations in temperature and humidity induced by bodily movement, two measurements were obtained, with subsequent averaging. During RS, the subjects’ skin temperature and humidity varied greatly, so three measurements were taken within 10 minutes. The experimental procedure is depicted in Figure 3, and each phase had the following specific guidelines:
(1) RB phase: recording the temperature and relative humidity at the fifth minute, along with the subjective evaluation;
(2) WB phase: recording the temperature and relative humidity at the second and fourth minute, along with the subjective evaluation at the fifth minute;
(3) RS phase: recording the temperature and relative humidity at the first, fifth, and ninth minute, along with the subjective evaluation at the tenth minute;
(4) WS phase: recording the temperature and relative humidity at the second and fourth minute, along with the subjective evaluation at the fifth minute;
(5) RC phase: recording the temperature and relative humidity at the fifth minute, along with the subjective evaluation.
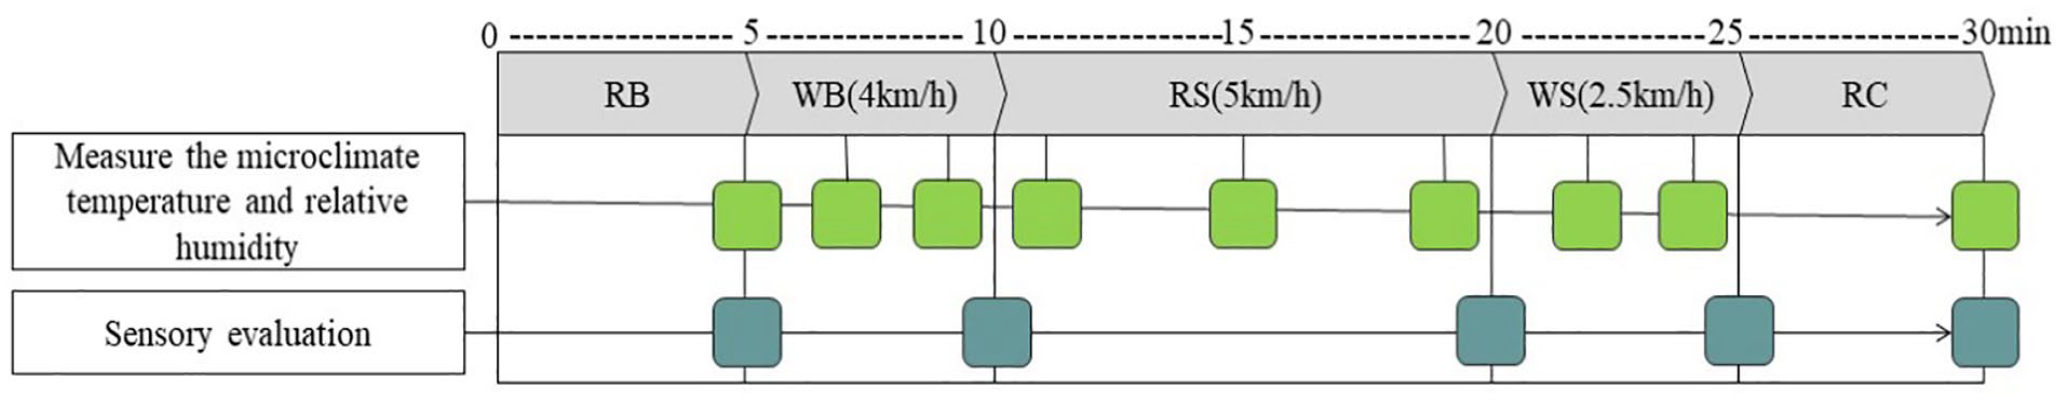
The procedures of the experiment.
Results and discussions
Changes in temperature and relative humidity
Values that deviated from the mean by more than twice the standard deviation were removed due to sensor displacement during movement or sweat penetration into the sensor. For all groups, the mean change in temperature (Figure 4) and relative humidity (Figure 5) were computed for the five measurement points over time.
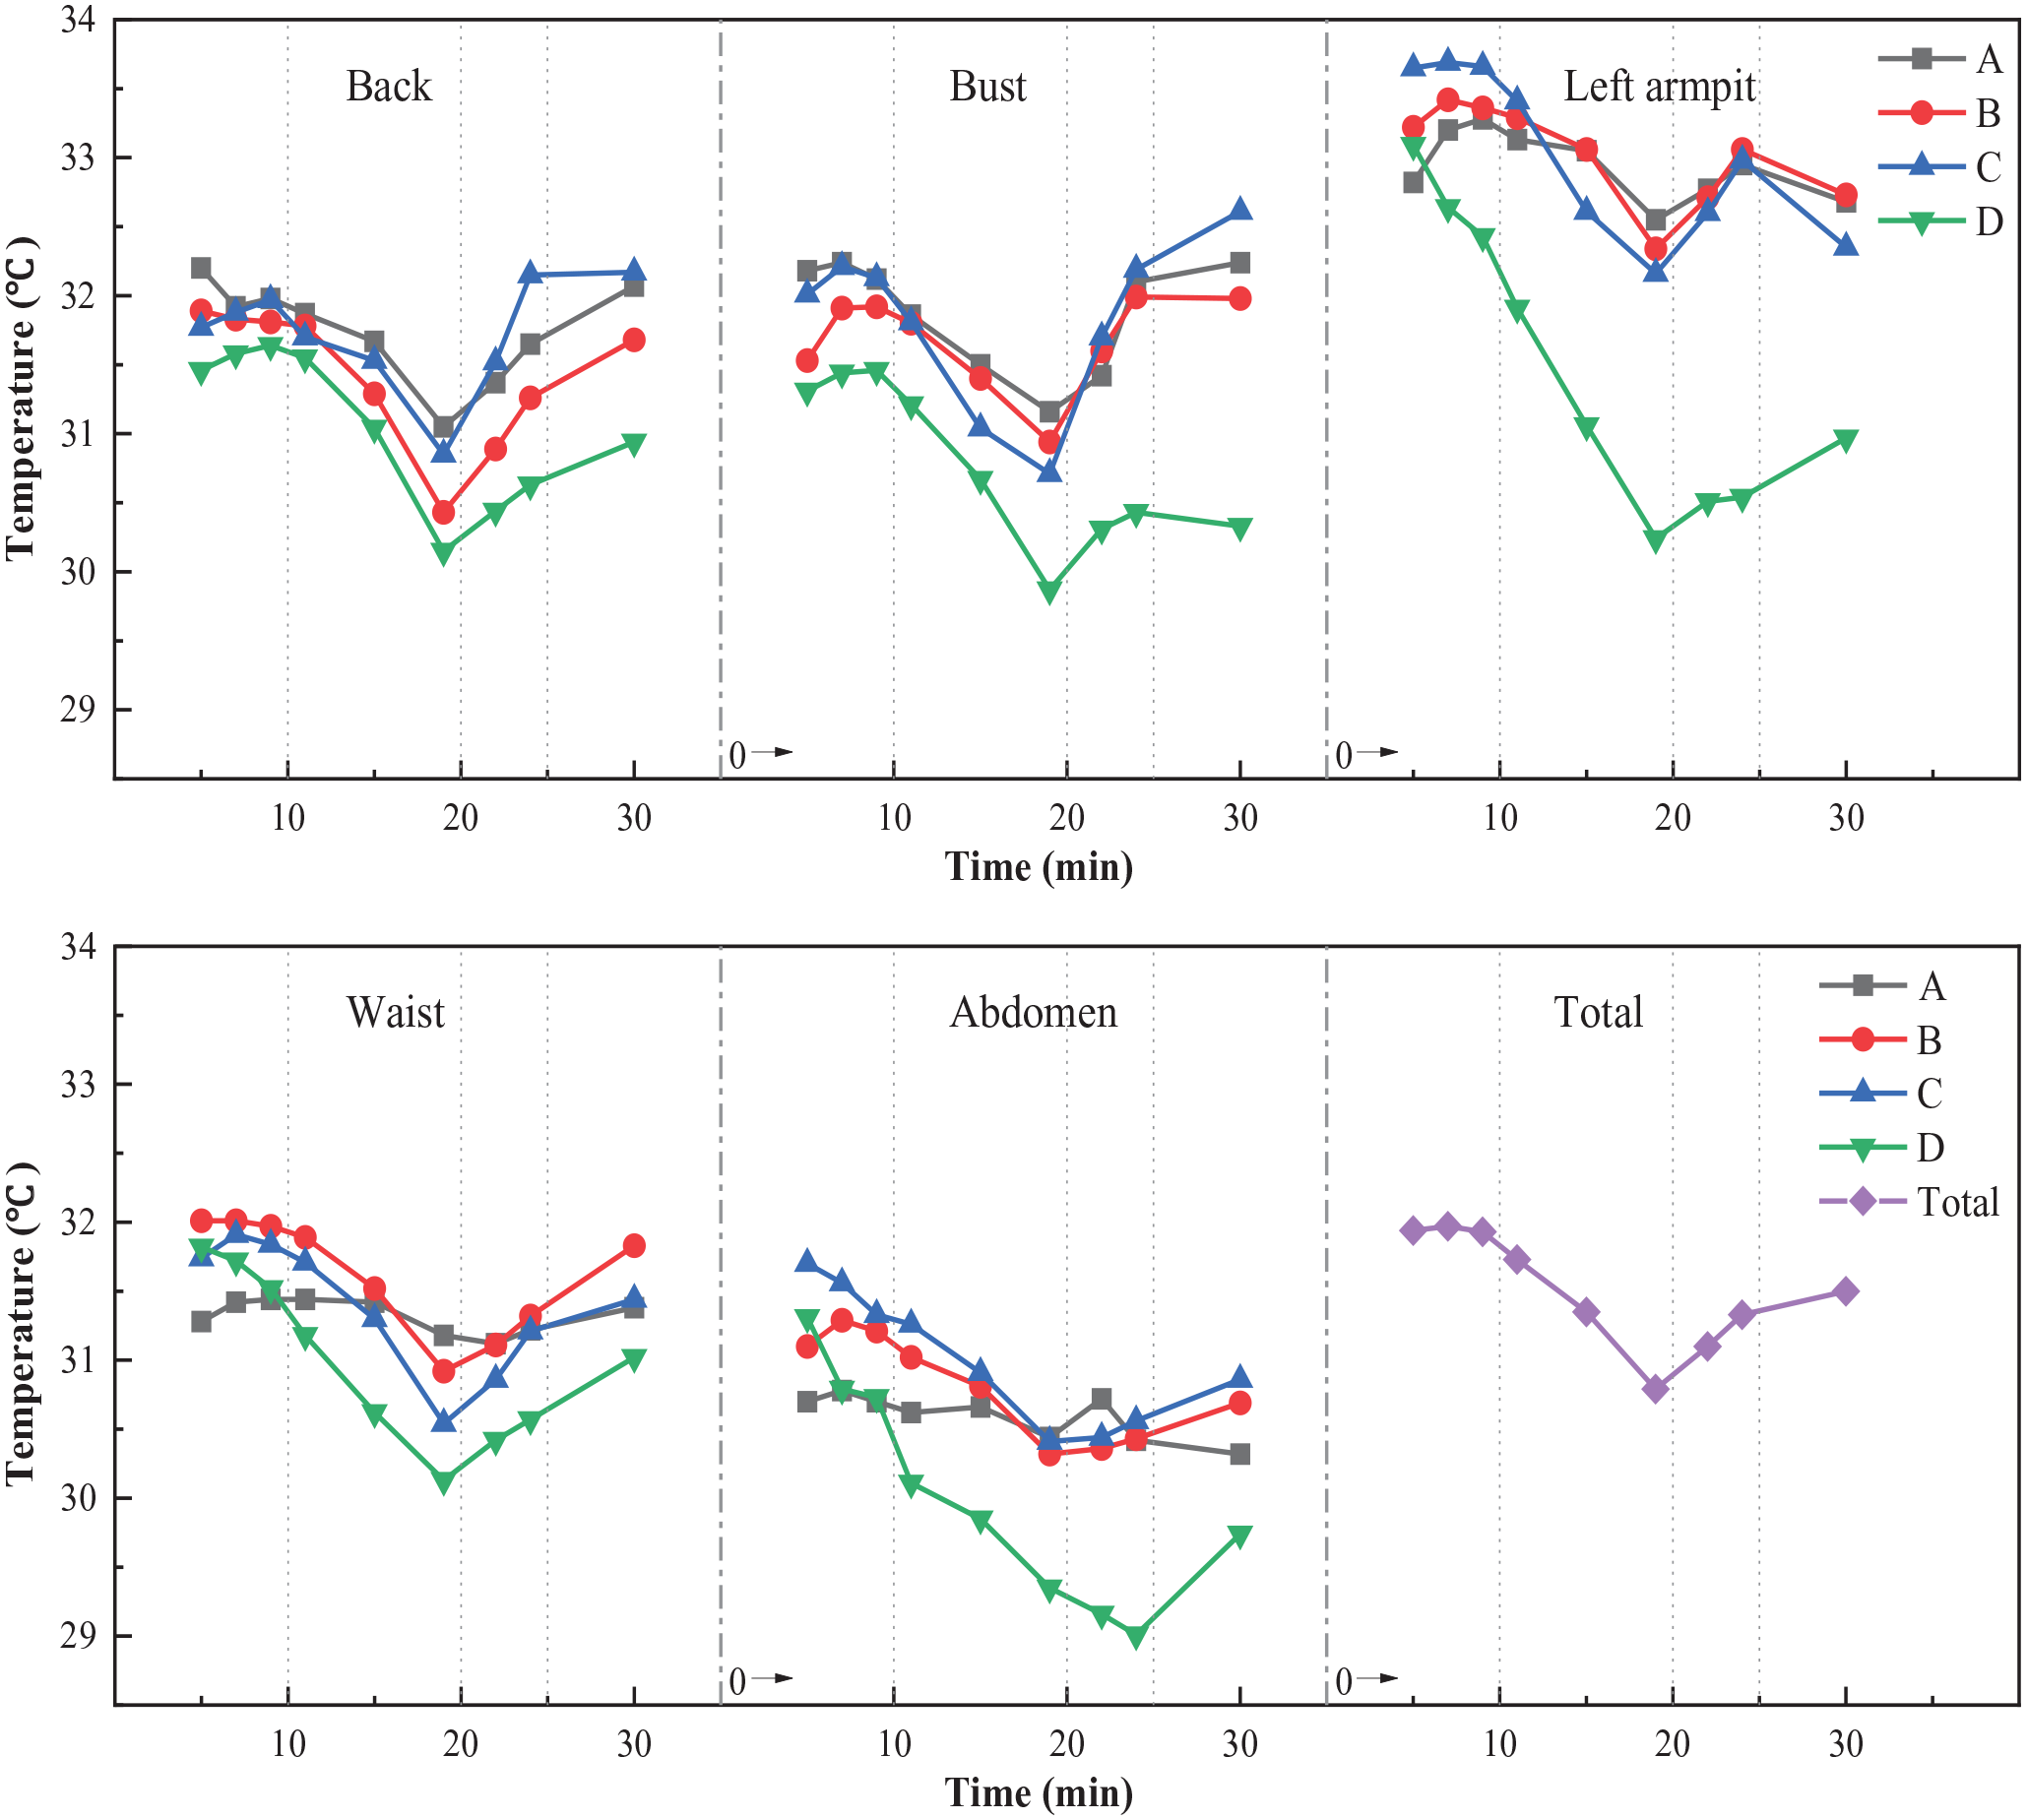
Temperature of microclimate in various locations of the body during exercise.
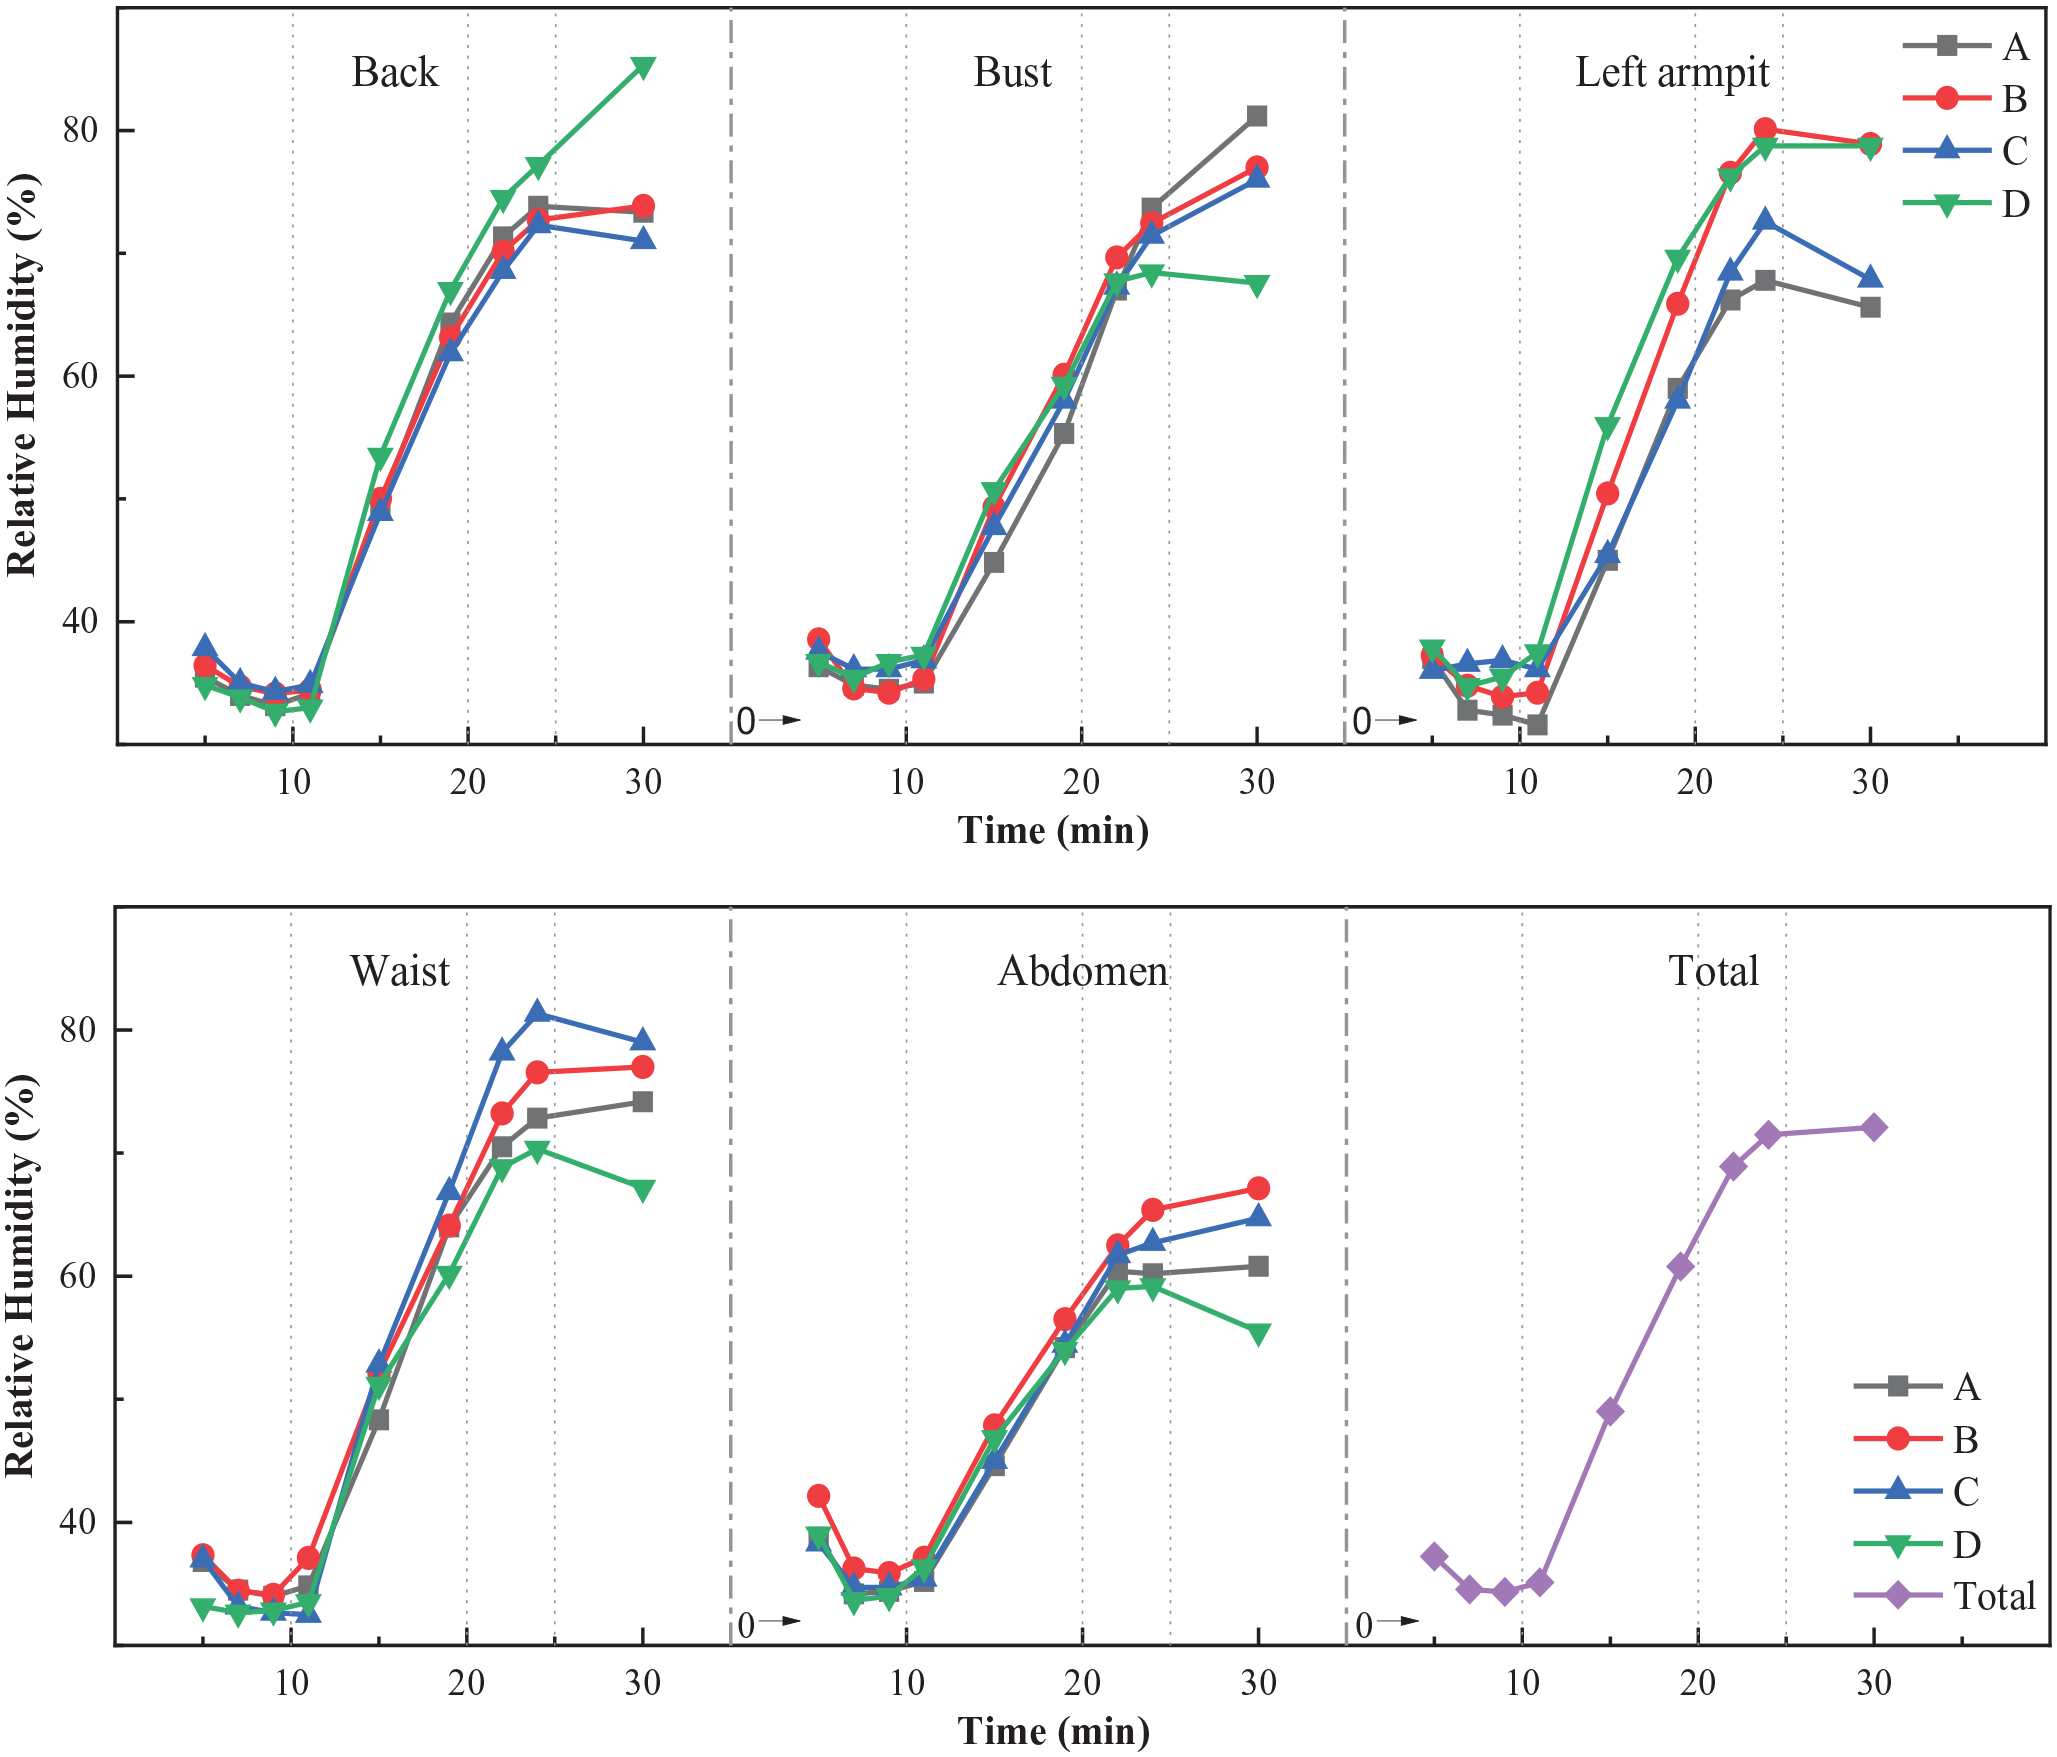
Relative humidity of microclimate in various locations of the body during exercise.
Variation of temperature and relative humidity with movement phases
As can be seen from the total temperature and relative humidity in Figures 4 and 5, the skin lost heat through vasodilation and sweating to avoid heat stress, which led to a decrease in skin temperature 27 and an increase in humidity. At the same time, the temperature of the microclimate under the clothing decreased and the relative humidity increased. 28 There were significant differences in both temperature and relative humidity of microclimate between different phases (p < 0.05). The changes in microclimate temperature and humidity in the four phases of exercise in this study and the reasons were analyzed in Table 4.
Changes in microclimate temperature and humidity and subjective evaluation during exercise.

Table 4 indicates that the temperature, relative humidity, and subjective evaluation changed during exercise. Despite the decrease in microclimate temperature, the heat sensation continued to rise. The sweating caused a reduction in temperature. However, heat production still increased and was not fully dispelled. This caused some of the heat to remain stored in the body, leading to a feeling of warmth. These findings align with the results of Wang and Hu. 29 High-intensity activities mainly affect thermal sensation through sweating instead of skin temperature because sweat evaporation cools both skin and microclimate temperature. 30
Comparison of temperature between groups in various locations
The temperature measurements differed across various points on the body. ANOVA on the different locations of the body revealed that the temperature of the armpit was significantly higher than other body parts, whereas the temperature of the abdomen was significantly lower (p < 0.05).
For each location, ANOVA on the temperature measurements of different groups revealed statistically significant differences between groups A, B, C, and D at the bust, abdomen, and armpit. However, there was no significant difference among the three groups (p > 0.05). Group D’s temperature was lower than the other groups at all measurement points. Sweating in the back and the armpit was higher in group D than in the other groups (Figure 5), resulting in lower temperatures. Furthermore, the ease allowance volume at the bust, abdomen, and waist was too large, leading to a more noticeable bellows effect when the body is in motion. This allowed for direct heat exchange between the air and the clothing with the environment. Except for group D, no significant difference in temperature was observed among the groups. This could be attributed to the body’s ability to thermoregulate.
Comparison of relative humidity between groups in various locations
The female body shape resulted in a higher volume of ease allowances and stronger air convection in the abdomen due to the bust serving as a support point for the clothing. This led to lower relative humidity in the abdomen compared to other locations. Nonetheless, no significant difference in relative humidity was observed among the five measurement points (p > 0.05).
ANOVA on the relative humidity measurements of all groups showed no significant differences observed at each measurement point. As depicted in Figure 5, Group D’s relative humidity was consistently higher than other groups in the back after the start of RS. This is because the subjects leaned forward during the run so the larger ease allowances in group D caused the fabric to stick to the body after absorbing sweat. At the bust, a higher volume of ease allowances led to lower relative humidity during RC. At the waist measurement point, relative humidity was highest in Group C followed by groups B, A, and D, respectively. The ease allowance volume at the back of the body was less distributed than at the front, 31 leading to less clothing swing during exercise at the back. Group C had a thicker air layer under the clothing due to larger ease allowances, resulting in higher thermal resistance. On the other hand, group D had stronger convection due to excessive ease allowances, leading to lower relative humidity. In the abdomen, relative humidity was highest in group B, followed by groups C, A, and D. Group A had significantly lower relative humidity than the other three groups at the armpit measurement point. Excess clothing accumulation under the armpits led to increased sweating and higher thermal resistance, leading to group D having the highest relative humidity.
Skin humidity, being a physiological variable of the body’s thermal equilibrium, is regulated by the body similar to temperature. The human body dissipates heat during exercise through sweating, but sweating is inhibited when the skin is wet. 32 This could explain the reason no significant difference was observed in the relative humidity under the clothing.
Results of subjective evaluation
Variation of thermal and moisture sensations with movement phases
Subjective evaluation results underwent reliability tests, with a Cronbach’s alpha of 0.777 indicating good internal consistency and reliability of the questionnaire. Figure 6 displays the thermal and moisture sensation evaluation results for each phase, with the raw data points concentrated during RB, indicating relatively consistent perceptions among selected subjects for both sensations.

The results of the subjective evaluation at each phase: (a) thermal sensation and (b) moisture sensation.
A one-way ANOVA revealed no significant difference between RB and WB phases in thermal sensation, likely due to the short 5-min walking period being insufficient to generate a significant thermal sensation. Additionally, convection caused by movement and swinging of clothing accelerated heat dissipation. RS and WS exhibited no significant difference in thermal sensation, as the body has a certain lag in heat dissipation, and the large amount of heat generated during running was not yet dissipated in the short time after the end of RS. However, all other phases displayed significant differences from each other, indicating that the exercise phase is an important factor influencing thermal sensation.
A one-way ANOVA was conducted on moisture sensation during different phases, revealing a significant difference in all phases except for RS and WS, demonstrating a significant effect of the exercise phase on moisture sensation.
Spearman correlation analysis of thermal and moisture sensations for all exercise phases yielded a significant positive correlation, with a correlation coefficient of 0.848 and a p-value of 0.000. However, Figure 6 depicts a lower thermal sensation than moisture sensation during RC, as the body gradually attained a balance between heat dissipation and production after exercise, leading to a decrease in thermal sensation. On the other hand, clothing sticking to the body when sitting due to slow evaporation and sweat on the surface of the body and within the fabric augmented the sensation of moisture.
Comparison of thermal and moisture sensations between groups
Table 4 displays the changes in subjective evaluations for each exercise phase. A one-way ANOVA was conducted on the subjective evaluation data of the four groups, and the results, illustrated in Table 5, revealed no significant differences in mean values between the groups. However, a comparison of mean values among groups identified a certain impact of ease allowances on thermal and moisture sensations.
The result of one-way ANOVA for the subjective evaluation of four groups (n is the sample size).

Results of the one-way ANOVA for subjective evaluations at different phases for each group can be seen in Figure 7. The distribution of points revealed that in general, the intensity of thermal and moisture sensations was group D>group C>group B>group A. Groups with larger ease allowances had negative thermal and moisture comfort, primarily during RS.

The results of one-way ANOVA for subjective evaluations at different phases for each group.
Thermal sensation trended upward only for group B during WS, while it slightly decreased for other groups, indicating that group B had the worst thermal comfort during WS. Group C was the only one without significant difference in thermal sensation between RC and WS, indicating the worst heat dissipation during RC.
Moisture sensation increased as ease allowances increased during RS, with group D exhibiting the highest moisture sensation. These results align with those of Filingeri et al., 33 who posited that clothing with larger ease allowances caused more swaying and mechanical interaction with the body, leading to stronger moisture sensation. Furthermore, the microclimate temperature in group D was significantly lower than in other groups, causing a greater rate of skin cooling and stronger moisture sensation. 34 In the two phases following the end of running, group D experienced the greatest decrease in moisture sensation, likely due to a slower movement speed, which reduced mechanical stimulation of clothing in contact with the skin, and excess ease allowances that produced stronger convection.
FCE-CRITIC method for thermal-moisture comfort
Using the CRITIC weighting method, variable weights were calculated based on microclimate temperature and humidity, followed by conducting a multi-level FCE of thermal-moisture comfort during exercise. The results of this evaluation were compared to the subjective evaluation results. The technology roadmap for this research is depicted in Figure 8.

The technology roadmap of this research.
Fuzziness in the evaluation of thermal-moisture comfort of clothing
To achieve an objective evaluation of clothing’s thermal-moisture comfort during exercise, one must consider temperature, humidity, and different exercise phases in a multi-level, multi-index, comprehensive process. People’s subjective evaluation is commonly used, supplemented by objective data. However, emotions, environment, and experience greatly affect subjective evaluation, making it challenging to combine different exercise phases and obtain accurate results. Therefore, the FCE theory was applied to establish a comprehensive evaluation system with multi-level evaluation indexes, achieving objective evaluation of thermal-moisture comfort.
Comprehensive evaluation model for thermal-moisture comfort experiments
To evaluate and analyze the post-wear thermal-moisture comfort of the human body, a comprehensive evaluation index system must be established that considers variable weights of factors at all levels. FCE of all levels can determine the optimal range of ease allowances.
Established evaluation factor sets for clothing comfort
The exercise process was divided into four phases: WB, RS, WS, and RC. Due to significant differences among the three data recordings during RS, they were calculated separately. Thermal-moisture comfort in each phase is influenced by microclimate temperature and relative humidity, while body location temperature and relative humidity affect overall comfort. 35 As the armpit sweats more during exercise and sweat can saturate sensors, leading to larger measurement errors, the back, waist, bust, and abdomen were selected as evaluation factors. Based on these factors, an evaluation index system was established.
The evaluation index system for thermal-moisture comfort in this study was organized into three hierarchical levels as depicted in Figure 9. The target layer was thermal-moisture comfort U. The first criterion layer comprised of WB U1, RS

The evaluation index system of thermal-moisture comfort.
Establish the grouping set of ease allowances
Based on the grouping of ease allowances outlined in the analysis of the objective data above, we established the set
Determine the membership function
Based on the subjective evaluation results, 93.8% of the sample (30 times) rated their thermal sensation as 1 (neutral) at the end of RB, indicating comfort. Therefore, to determine the comfortable temperature for different body locations, we selected the mean of the initial temperature measured during RB. When the temperature closely approximates the initial mean value, comfort levels remain stable and the absolute value of the function slope is smaller. Using ridge distribution as a basis, the membership function of temperature was constructed (Figure 10), denoted by equation (1).

Where,
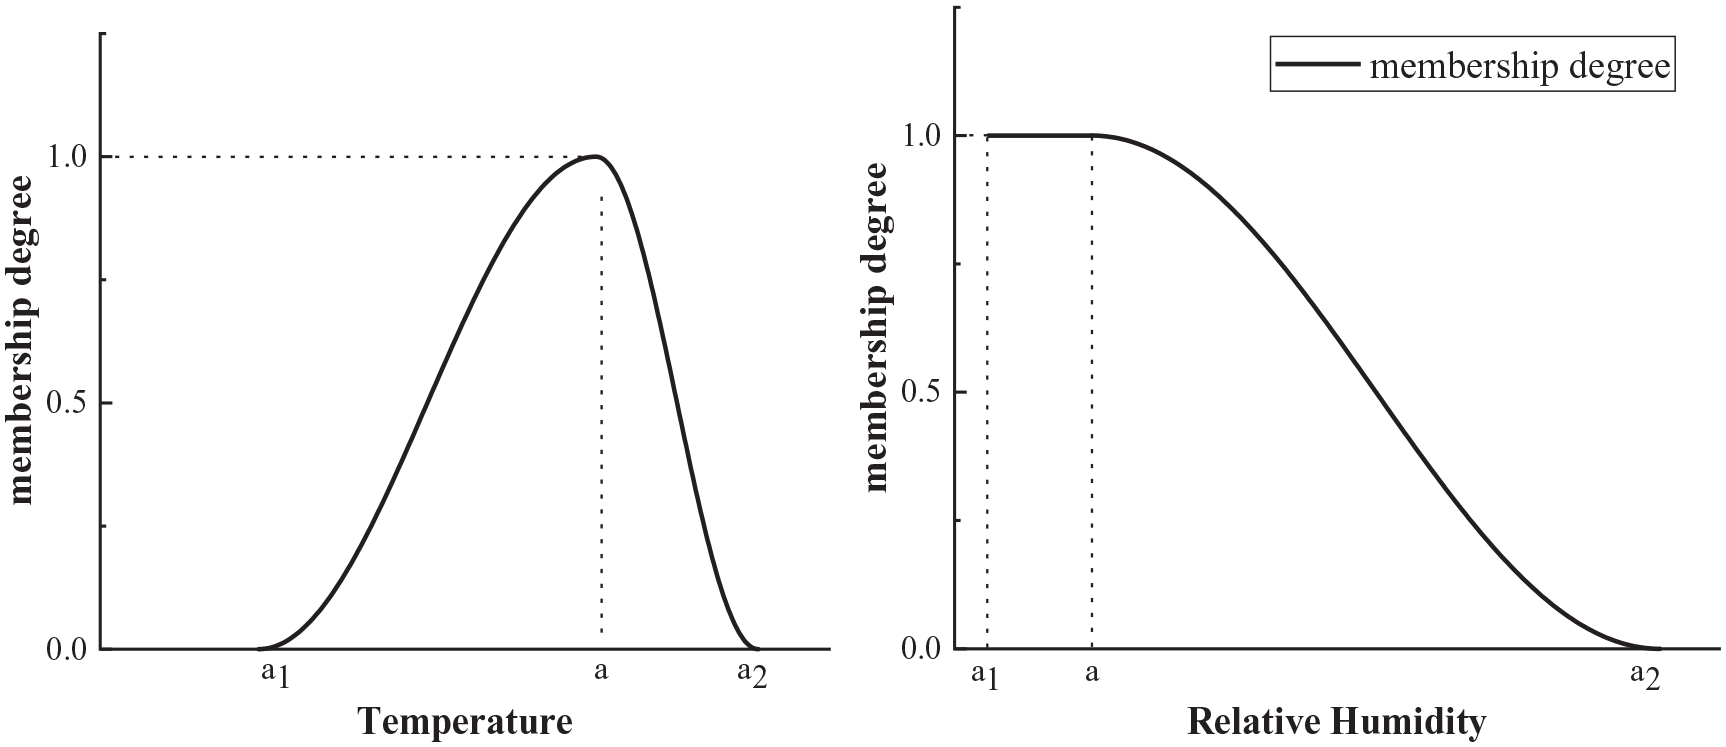
Membership functions of comfort for temperature and humidity.
Based on the subjective evaluation results, 90.6% of the sample (29 times) rated their moisture sensation as 1 (neutral) at the end of RB. Subjects did not experience discomfort within the range of relative humidity used in this experiment, as long as the relative humidity was below the initial mean for each location. Therefore, for relative humidity, the membership degree is 1 for values below the initial mean. The variation in moisture sensation is smaller when the relative humidity is close to the initial mean or very large, resulting in a smaller absolute value of the function slope. Hence, the membership function for relative humidity is a small partial size based on the ridge distribution, presented as equation (2) in Figure 10.

Where,
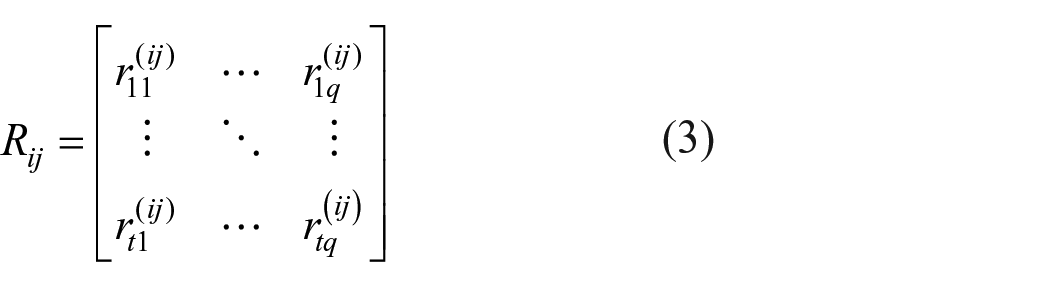
Each third-level comprehensive evaluation matrix
Establishing weight sets for each level based on the CRITIC weighting method
A correlation exists between the overall and local thermal sensations of the human body. 36 The local thermal sensation evaluation of the four locations was influenced by the synergistic effect of temperature and humidity, and the four locations had a mutually causal relationship. The CRITIC method considers not only the volatility (contrast intensity) of the data but also the correlation (conflict) between indexes. 37 Furthermore, the weights of the factors differ at different phases, with variable weights calculated based on the CRITIC weighting method.
Construct the calculation matrix of weight with the membership degree:

Calculate the standard deviation of each index:

Where
Calculate the conflict of indexes:

Where
Then the amount of information carried by the index is:

The weight of index j is:

Conduct a fuzzy comprehensive evaluation
If the weight is given to
The weights of the temperature and the relative humidity
Each phase’s comfort level was affected differently by temperature and relative humidity, as depicted in Figure 11, which presents the variable weights. Temperature had a higher weight than humidity in each phase. During WS and the first recording of RS, the membership degree of relative humidity was 1, resulting in zero weights. Humidity weight increased during RS, reached its peak and then decreased during WS. As exercise intensity increased, the body began to sweat, and sweating differences between groups grew, resulting in increased humidity weights. Despite reduced exercise intensity during WS, the human body continued to sweat, leading to maximum humidity, distinct moisture sensations for all groups, and drops in humidity weights. During RC, varying sweating and moisture absorption by clothing among groups increased the weight of relative humidity. As previously reported, 38 relative humidity had higher weights for RS and RC.
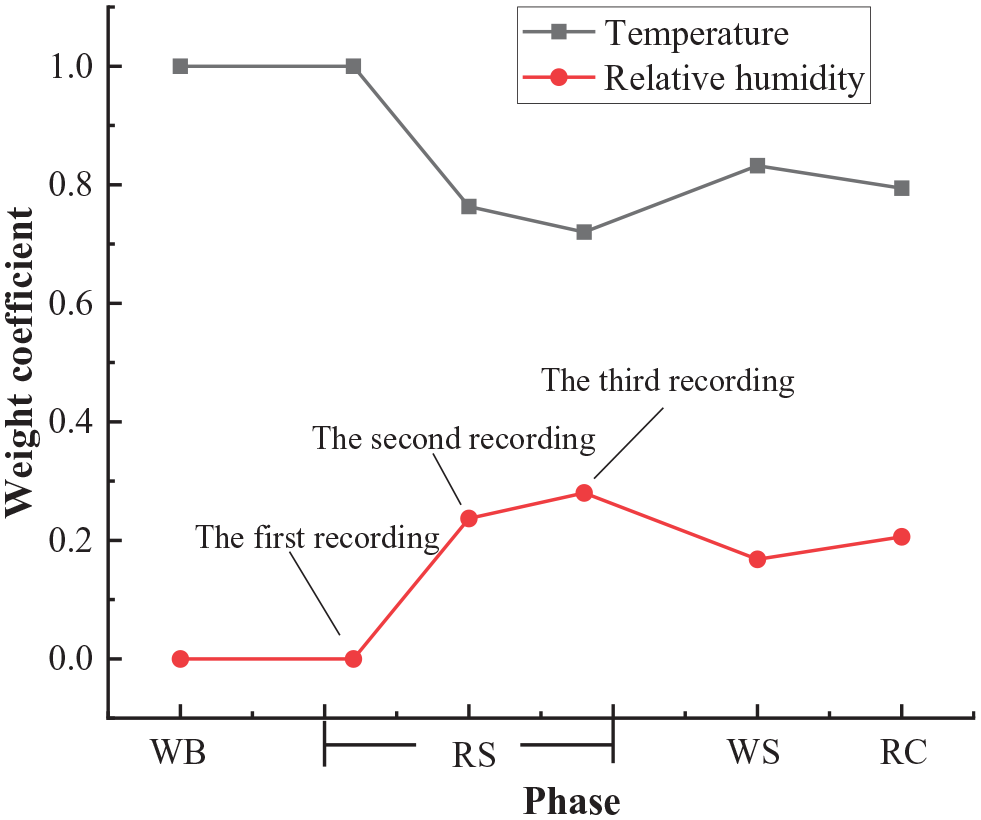
The weights of the temperature and the relative humidity for different phases.
Results of the fuzzy comprehensive evaluation
The thermal-moisture comfort evaluation results for each exercise phase were determined based on the membership function and weight vector using the three-level FCE method. The results are presented in Tables 6 and 7.
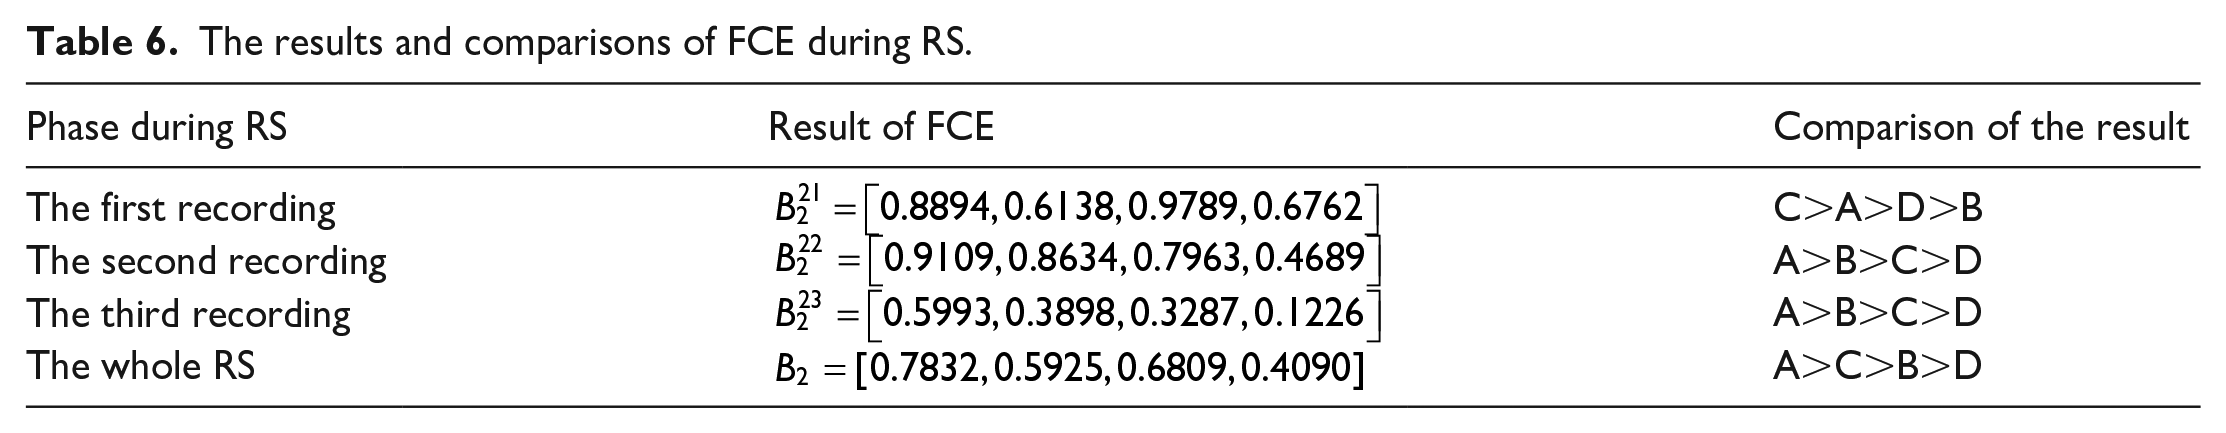
The results and comparisons of FCE during RS.
The results and comparisons of FCE throughout the exercise.

Table 6 presents the results and comparisons of FCE for the three recordings of RS. The first recording of running had the same humidity membership degree of 1 as WB. Temperature was the only factor that affected the evaluation results, with higher weights in the waist and abdomen. The results of the second recording were the same as that of the third, which was consistent with the subjective evaluation of RS. It indicates that there is better thermal-moisture comfort when the volume of ease allowances is smaller during exercise and sweating. By conducting a comprehensive evaluation of the three recordings, the degree of comfort for each group in RS was determined as follows: group A > group C > group B > group D.
Table 7 presents the FCEs results and comparisons regarding the comfort experienced during each phase of exercise. During WB, the evaluation results were exclusively impacted by temperature since the membership degree of relative humidity was 1. The study found higher weights for the waist and abdomen. As presented in Figure 4, groups B and C experienced more discomfort due to the air layer beneath their clothing causing higher thermal resistance and higher temperature increase. In contrast, group D presented improved air convection under their clothing, therefore experiencing less temperature increase or even a decrease. This finding was consistent with the perception of moisture presented in Figure 7, where group B experienced a slight wet sensation during WB, indicating poorer thermal-moisture comfort in group B.
The evaluation results of RS were consistent with the WS ones. During RS, the area with the highest weighting for both temperature and humidity was the back. As shown in Figures 4 and 5, group D had the lowest back temperature and the highest relative humidity, causing more discomfort. Compared to group B, group C had lower relative humidity beneath their back clothing, whereas group A and group C had similar humidity levels. However, group A experienced lower relative humidity in other locations, making it more comfortable. The FCE result for WS was consistent with the subjective evaluation results presented in Figure 7.
During RC, the temperature rebounded, with the highest weighting for both temperature and relative humidity at the back areas. Although the temperatures of all groups were similar at the waist and abdomen, group B had the temperature closest to the initial temperature at the back and bust (Figure 4). Group C experienced higher thermal resistance due to the larger air layer volume beneath the clothing, resulting in higher temperature than the initial mean. In contrast, group D had lower relative humidity levels in the waist, bust, and abdomen compared to group C (Figure 5), which provided better comfort. Group C showed the least comfortable sensation during RC, which was consistent with the results shown in Figure 7.
As demonstrated in Table 7, the overall evaluation of thermal-moisture comfort throughout the exercise showed that group A had the best comfort allowance within the range of 6–10 cm.
Conclusion
This study combined objective and subjective evaluation methods to investigate the effect of clothing ease allowances on thermal-moisture comfort during exercise. FCE-CRITIC method was applied to dealing with monitored temperature and relative humidity of microclimate. The study obtained the optimum range of clothing allowances during exercise. The main results of the study are as follows:
(a) Significant differences were observed in both microclimate temperature and relative humidity across the different exercise phases. During the 4 km/h walking phase, the temperature increased, and the relative humidity decreased. During the 5 km/h running phase, the temperature decreased to the lowest value, and relative humidity increased. During the 2.5 km/h walking phase, both the temperature and the relative humidity increased. During the recovery after exercise, body heat production and dissipation reached equilibrium, resulting in a stable temperature and relative humidity. However, the relative humidity at the bust continued to rise.
(b) Variances were observed in temperature and humidity levels at different locations and different clothing ease allowances. Of the five locations examined, the temperature was highest in the left armpit and lowest in the waist and abdomen. Temperature of group A was relatively stable, while group D was the lowest at the five locations. The relative humidity levels beneath the clothing did not differ significantly among the four groups, except for group D where it was higher at the back.
(c) The phase of exercise significantly affected thermal-moisture comfort levels, but there were no significant differences between the different clothing ease allowances. However, adjusting clothing ease allowances improved thermal-moisture comfort to some extent. The group with the lowest clothing ease allowances reported the lowest thermal and moisture discomfort levels. Furthermore, the human body had a noticeable sensation of thermal and moisture discomfort even after a certain duration of running due to the lag in heat production and dissipation.
(d) The FCE-CRITIC method was effective in evaluating thermal-moisture comfort during exercise. The optimal range for thermal-moisture comfort throughout the exercise phases was 6–10 cm when clothing allowances were in the range of 6–26 cm.
In this study, only female participants were included, it may lead to a limitation of the application of the results. Therefore, future studies should include male participants to make the conclusions more universal.
Footnotes
Acknowledgements
The authors would like to thank those participants who have participated in the experiments and those who have given valuable advice in preparing the experiments.
Author contributions
Jun Zhang: Resources, Data curation, Writing – Review & Editing, Mengxia Tong: Investigation, Data curation, Writing – Original draft preparation. Mengyun Zhang: Writing – Review & Editing, Validation. Yating Zhang: Investigation, Data curation. Xuewei Jiang: Writing – Review & Editing, Xiaoxiao Zhu: Writing – Review & Editing. Mengna Guo: Writing – Review & Editing, Funding acquisition.
Data availability
The datasets used and/or analyzed during the current study are available from the corresponding author on reasonable request.
Declaration of conflicting interests
The author(s) declared no potential conflicts of interest with respect to the research, authorship, and/or publication of this article.
Funding
The author(s) disclosed receipt of the following financial support for the research, authorship, and/or publication of this article: This work was supported by the Wuhan Textile and Apparel Digital Engineering Technology Research Center; the Hubei Key Laboratory of Digital Textile Equipment, Wuhan Textile University (Grant No. DTL2022014); and the R&D Program of Beijing Municipal Education Commission (Grant No. KM202110012010).