
Abstract
The breathability and thermal comfort of footwear, which are essential in everyday life, have a significant impact on user satisfaction. Despite their importance, there is currently no standardised device or procedure to directly test these aspects. The aim of this study is to develop a system and method for evaluating the breathability and thermal comfort of footwear using a foot model that mimics human perspiration and temperature. The model takes into account the distribution of eccrine glands, sweating rate, sweat release areas and foot temperature. Two test principles were applied: (i)measurement of internal temperature and humidity using sensors to assess comfort and (ii)evaluation of moisture management by monitoring the weight gain of footwear, socks and footbed during an 8-h sitting simulation. The system was tested on three full leather military boots, with data collected by sensors and weight measurements. The results showed that 65% of the sweat released was absorbed by the system, with 36% absorbed by the boot, 12% by the footbed and 52% by the sock. The Foot Comfort Logical Scale (FCLS) indicated no temperature discomfort during the trials, but moisture-related discomfort occured after about 240 min and worsened after 300 min when humidity reached 80%. The study demonstrated the effectiveness of the system in simulating the breathability and thermal comfort of footwear, with the results agreeing well with established standards and the literature. Future research will focus on testing different footwear types, incorporating dynamic motion systems and refining the FCLS to improve the accuracy of comfort assessment.
Keywords
Introduction
Footwear has been an important tool for protecting feet since historical times. Over time, consumer expectations have expanded to include properties such as ergonomics, waterproofness, breathability, hygiene, sweat absorption, shock absorption, slip resistance and pressure distribution.1–5 In addition to these properties, the breathability of footwear plays an important role in users’ preferences for footwear comfort.
Breathability refers to the efficient transport of perspiration from the foot to the outside.2,6,7 Temperature and moisture in footwear influence thermal (thermophysiological) comfort.7–9 Humans can easily recognise the level of comfort or discomfort in footwear, but testing is challenging and there are no single or direct tests to measure the comfort of footwear.5,8 In terms of comfort, users should not feel hot, cold, sweaty or wet in their footwear.4,6,7
Thermal comfort means the absence of a positive or negative brain response.4,9 This mechanism balances body temperature through vital activities: the transfer of the sweat produced to the sock and its subsequent evacuation through the footwear lining, the internal support elements or the upper.10,11 If the footwear cannot perform these processes correctly, the sweat condenses in the inner gap between the foot and the footwear, which means that energy must be expended to maintain the heat balance. It is stated that a 1°C rise in foot skin corresponds to an energy loss of 16 W and 404 Wm-2 of energy-expressed as energy loss. 12 In this environment, the user is disturbed and discomfort occurs, such as sensory neuromotor discomfort, risk of microorganism activity due to foot temperature, unwanted wetness, wear of the lining and socks due to wetness between the foot and footwear and unwanted friction on the skin.12–14
The thermal comfort properties and breathability of upper materials such as leather, textiles and support materials are tested in 2D sheet form or by removing a piece from the final product as a sheet material in accordance with EN, ISO, ASTM, etc. standards. Although there are many different test standards for the breathability and thermal comfort of upper materials, the footwear industry favours ISO 14,268 (g/m2.24h) 15 for the breathability of leather, ISO 11,092 (Pa.m2/W)5,16 for the breathability of textiles, and 11,092 16 for the thermal insulation of non-woven, foam and lining.8,17,18 The manufacturers of leather, textile and foam upper materials organise their production according to these specifications.14,19–21 These test methods used by the industry do not fully simulate the thermal comfort properties of the final product.4,22 This is because the materials used in footwear production are layered and various chemicals such as adhesives, abrasives or pre-treatment chemicals, especially during sewing, molding, sole and finishing, alter the breathability and thermal properties.
There are no test standards recognised in EN/ISO or other norms for the breathability or thermal comfort of the final footwear product. In the market, manufacturers of technical footwear, such as military, safety footwear, outdoor and industry leaders, test their products using their own methods. These footwear are tested for breathability using in-house methods and patented systems from companies such as Gore-Tex, GEOX17,23–25 or in-house test set-ups in laboratories such as Satra26,27 and Hohenstein. 28 These tests are more suitable for footwear constructions that contain a membrane lining and do not have suitable structures for testing hollow textile materials. Therefore, there is no generally recognized test standard.11,29 For this reason, some test equipment developers are endeavoring to develop a test method that corresponds to their own commercial activities.
The concept of comfort tests for footwear performed on the final product mentioned above has been divided into two groups: dynamic and static tests. The general principle of dynamic test equipment is that a foot model, prepared to be worn in a shoe, moves in a walking motion. The foot model is divided into different zones, its heat balance is ensured to maintain the actual foot temperature, and the comfort parameter is calculated based on the amount of energy consumed. In some static test systems, the transfer of the fluid contained in the footwear was observed,22,25 while in some studies, e.g. dynamic systems, the energy required by the released fluid to maintain thermal equilibrium 30 and the weight gain in the footwear were calculated.14,31 When considering breathability, the difference between the static and dynamic test systems is that the contact between the foot and the footbed is interrupted during walking simulation and ventilation occurs from the sole to the footwear collar; during the compression movement, the moisture-saturated air is pushed towards the footwear collar by a pumping effect.19,22,32,33 Therefore, the inside of the footwear is exposed to active ventilation (dynamic test) in moving systems and passive ventilation (static test) in stationary systems. 34 In addition, some studies have been carried out directly on end users to investigate the comfort of footwear.Both subjective tests and the perception of internal moisture measured with sensor capsules were compared.32,34
The aim of our study was to develop a system that simulates real human behaviour as accurately as possible to measure the breathability of footwear, which is an important parameter for the thermal comfort and breathability of footwear. This study focuses on observing the phenomenon of breathability and thermal comfort of footwear by inserting the developed foot model into all types of footwear. The system was developed as a test device with two principles that can be observed by the sensory comfort while wearing footwear (i) and the moisture transfer mechanism of the footwear with increasing weight (ii). In addition, the moisture and temperature data inside the footwear were compared with the water vapour permeability data of the upper material, which is made of single layer leather. These data were correlated with the weight gain of the footwear.
Experimental
The aim of the study was to develop a system to evaluate the breathability of footwear and its thermal comfort. This system was developed to simulate the user’s experience in an 8-h seated position and to investigate the behaviour of footwear materials. Two main approaches were used: • Simulation of Sensory Comfort (i): Measurement of humidity and temperature inside the footwear using sensors to observe changes during wear. • Evaluation of Moisture Management (ii): Calculation of the weight change due to simulated sweating when wearing the footwear and comparison of the footwear materials with the moisture management test results.
According to these two main approaches, the measurement systems of the test device were developed as follows. The developed device was tested on a boot with an upper made exclusively of full-grain leather.
Critical design of the test device
Design of the heating system
Previous studies have shown that the neutral foot temperature is between 31 and 33°C,34,35 with 32°C chosen for this system. The blood that warms the foot enters from the posterior part of the malleus bone and is distributed in the foot.
12
For this reason, this problem was taken into account in the design. An aluminium heating block was placed inside the foot model, from the area between the malleus bones and the heel bones to the anterior extension of the conical bones. By adding aluminium sheet heat carriers to the block, a vein-like heat conduction up to the metatarsal heads and a homogeneous heating system inside the foot model was created (Figure 1). The system consists of a heat block and aluminium sheets, a thermostat for heating the heat block and a thermistor for sensitivity control, a thermostat, a control card and a 12V power supply. The sensitivity of the system is ± 0.1°C. Foot model and design of the heating system inside the foot model.
Design of the sweating simulation system
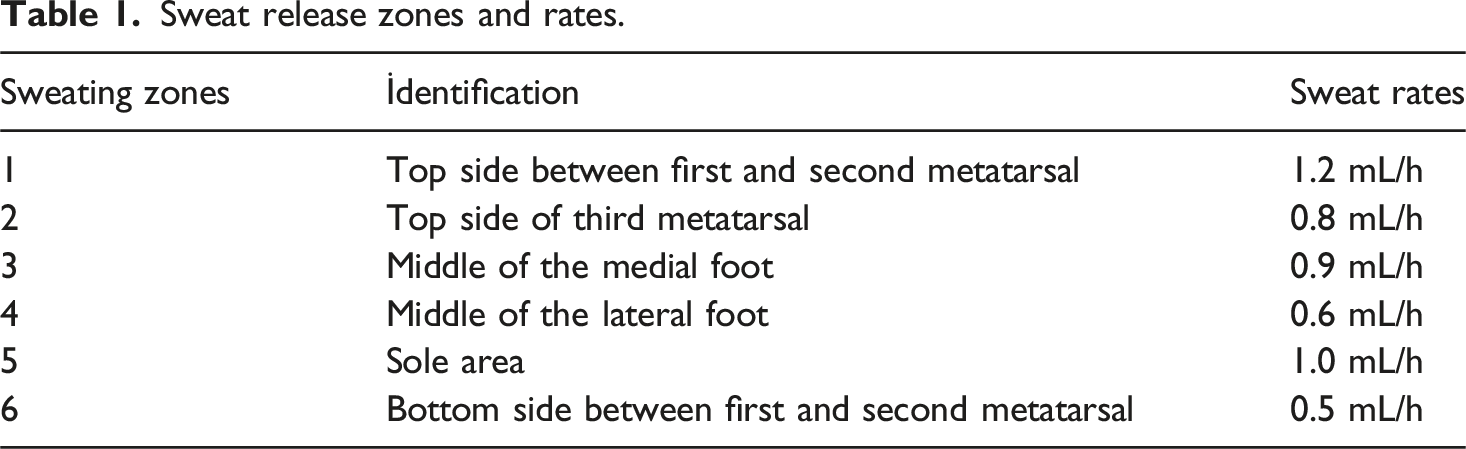
Sweat release zones and rates.

Sweating zones and sensor areas on the foot model.
Design of the sensor system
The moisture and temperature sensors were placed at strategic points on the foot model: on the upper sides of the 1st and 3rd metatarsal bones and in the area of the medial and lateral metatarsal bones (Figure 2). A cable system was attached to the inside of the foot model so that the sensors did not interfere with the interior. At the indicated locations, 50 mm2 rectangular windows were opened from the foot skin to the outside. The backs of the windows were insulated to prevent direct temperature measurement by the heat block inside the foot model. The sensor was prepared by mounting AHT 41 sensors on a 10 mm × 7 mm PCB (printed circuit board). The sensitivity of the sensors was 0.2°C for temperature and 1.8% for humidity. The sensors were connected to the main board, the control unit, with 50 cm cables and the data was recorded as averages of 15-s data at 3-min intervals using an I2C microprocessor. The sensors were tested at room temperature for 6 h after production for calibration purposes and verified by three single point measurements.
Construction of the test device and design of the foot model
The foot model, based on size 42, contained integrated hoses and sensor areas.10,38 Cables and mechanical components were placed in the internal areas without changing the external design of the model. An internal structure was created to safely house the cables and mechanical parts of the test device inside. The base model was flexibly manufactured using an FDM printer with a hardness of 65 Shore A (Figure 2).
The breathability test device was manufactured as a system to which microperistaltic pumps, sensor system and power supply, scale system for measuring weight gain, heat block control and power supply system, perspiration or fluid container for delivery, other power supplies and the foot model can be connected, as shown in Figure 3. Foot model and heating system design.
Footwear and material testing procedure
Three full leather military boots (Boot A, Boot B and Boot C) with similar designs (Figure 4) and materials were tested. The boots were made of 1.8 mm thick, chrome-tanned, waterproof, breathable and hydrophobic leather used for military purposes. The toe puff and counter of the boots were manufactured with as little surface area as possible so as not to impair breathability. The boot design used for the tests and its patterns.
Foot Comfort Logic Scale (FCLS)
Foot Comfort Logical Scale (FCLS) for the feeling of foot comfort due to temperature and humidity in the footwear.

Experimental protocol
• Initial Preparation: The boots, the footbed laminated with polyester textiles and the 100% cotton socks were weighed under controlled conditions (23 ± 2°C, 50 ± 3% relative humidity). • Preheating: The sock was placed on the foot model and then preheated for 5 min to achieve temperature equilibrium. Once a stable humidity and temperature were reached, the boot was put on the foot model and the laces were tied. • Sweating Simulation: Pure water was dispensed in the amounts indicated in Table 1 over a period of 8 h.33,39 Preliminary tests showed no significant difference in weight gain between pure water and the artificial sweat solution according to EN/ISO 11,641.
40
As the corrosive properties of the perspiration solution were not the focus of this study, pure water was used instead. The tests were conducted over a period of 8 h for perspiration simulation, in accordance with the EN/ISO 14,268 test protocol. Similar test durations have been observed in previous studies.12,32,41 • Post-Test Processing: The boots, footbed and socks were weighed after the test. The boots and footbed were then dried for 24 h under controlled conditions. Each boot was subjected to three tests without lining.
Results of the water vapour permeability of boots and leather uppers.

Results
Results of the characterization of footwear materials
Figure 4 illustrates the details of the boot patterns used for the test. The water vapour permeability of the boot uppers was calculated according to ISO 14,268 (ISO 14,268:2023. Determination of water vapour permeability). The results obtained are shown in Table 3. In the table, the amount of water vapour that is expected to penetrate through the upper of the boot is calculated per unit area for the duration of the test.
In addition, the water absorption and desorption values of the footbed used in the boots were calculated in accordance with ISO 22,649. The water absorption was measured at 68.5 g/m2 and the water desorption was 96%. Based on the data obtained, it was calculated that the footbed used in the test could absorb a maximum of 21.92 g of water during the test period. 39
Results of weight difference
Results of the weight of boots, footbed and socks.
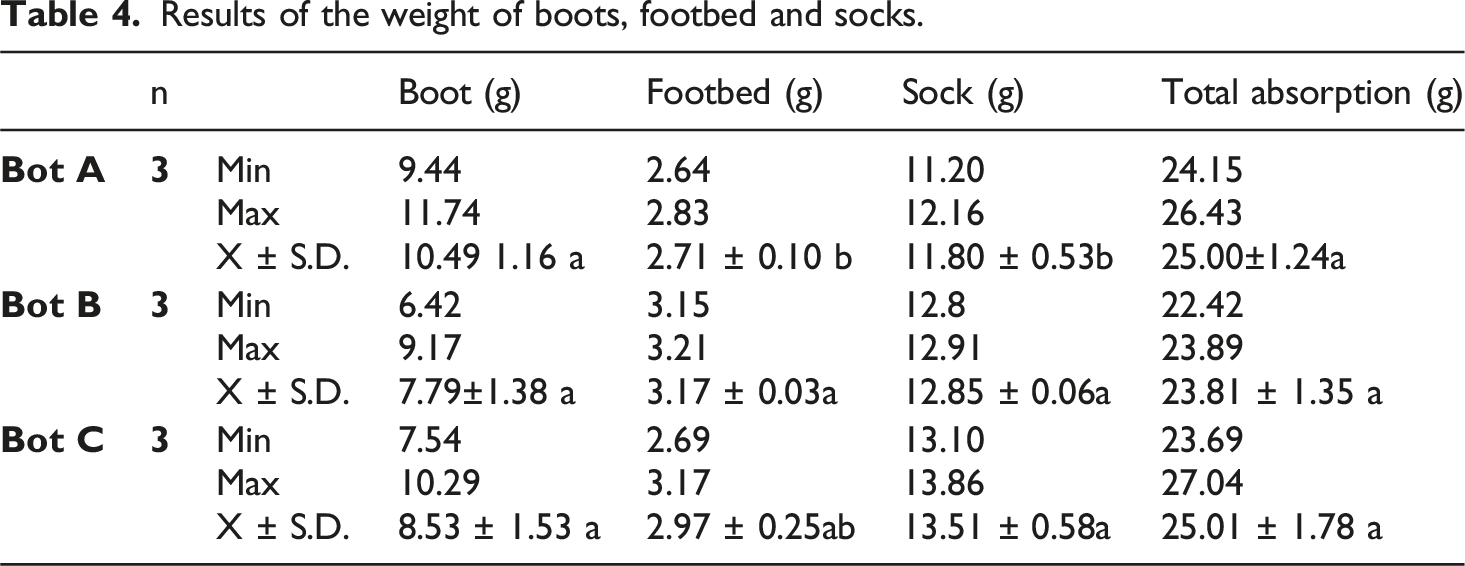
According to Table 4, when the total and boot absorption were analysed at the end of 8 h, it was found that the values obtained were statistically insignificant (p > 0.05). On the other hand, it was found that the values of weight gain with moisture absorption of Boot A in the footbed and socks were only slightly different from the absorption values of Boot B and Boot C, and this difference was also statistically significant (p < 0.05). It is understood that this difference did not create a change in the weight gain regime.
After the release in the 8-h test, an average of 26.61 g or 66.5% of the total fluid released was absorbed by the boots, footbed and sock. Looking at the weight gain in the boots, Boot A absorbed 42%, Boot B 33% and Boot C 34% of the total liquid. The weight gain in the boots proved to be significant. On average, 36% of the total amount absorbed by the boots, footbed and socks was attributed to the boots. In previous studies, this value was reported as 27% for 1 h. 37
According to Tables 3, it was calculated that an average of 0.23 g/h of sweat should pass through the upper leather, and this value corresponds to 4.6% of the sweat released. It has already been reported that 7% is the maximum evaporation in boots. 33 According to these values, the reason for the removal of more than the expected amount of liquid from the full leather boot calculated in Table 3 is that sweat evaporates not only from the upper part of the footwear, but also from the sock and the collar opening of the boot with osmotic pressure and transport. It is also known that the reason for the different reactions to the footwear in the test results of the upper materials before production is the change in moisture transfer due to the hydrophilic-hydrophobic structures in the complex structure between the fibres and the changes during lasting. 35
In nine wear tests with three boots, an average weight gain of 2.95 g was determined for the footbed used. When analysing the water absorption capacity of the footbed, it was found that it had a maximum fluid absorption capacity of 21.92 g over a period of 8 h. This value was converted to an average of 2.95 g according to Table 4. According to this result, the footbed absorbed approximately 10% of its water absorption capacity. In addition, it was found that during 8 h of wearing the footwear, a value of almost 96% water desorption was achieved, as determined by the desorption test according to ISO 22,649. 42 Overall, approximately 12% of the total sweat absorbed by the boot was attributed to the footbed.
Similar to the footbed, the average liquid absorption of the sock was 12.72 g (31.8% of the total liquid absorbed) of the 40 grammes of liquid released in each test according to the procedure. A comparison with the results of Kuklane et al. (1999 and 2016) showed that the values are very similar.33,35 The sock absorbed 51.84% of the total sweat absorbed. Similar results have been reported in previous studies in which it was found that the liquid caused by perspiration was first transferred to the cotton sock and did not come into contact with the next layer, the inside of the footwear, over the entire surface. In other words, due to the interior space, the absorbed liquid was transferred along the surface of the sock instead of reaching the next layer and tended to spread in the layer closest to the source of wetting.
Sensor results
The initial and average values at which the temperature and humidity limits were reached in different regions.

As far as humidity is concerned, the symptoms of discomfort began after 240 min at a humidity of around 70%. Up to this point, the humidity in the interior gap and caused increasing heat loss. The increasing humidity reached 80% humidity after 300 min. This indicates that discomfort and the feeling of wetness occurred during the initial period. When examining the sensor data regime, the sensor ranges and humidity temperature parameters moved in groups of two, as also mentioned in the study by Shimazaki (2016).34,35 The reason why the temperature in the lateral areas does not match the temperature in the dorsal area is that the air inside the boot sinks downward as the humidity rises and settles in the lateral areas, resulting in a temperature drop in these areas. A look at the humidity values in Table 5 shows that the air inside the boot reached a humidity of 65% in different regions after 300 min of the test and 80% at the 300-min mark. From this it can be deduced that after 180 min, comfort decreases and discomfort sets in due to changes in humidity inside the tested boot. After 300 min, an environment with 80% humidity is created, which leads to discomfort. 32
Temperature and humidity values are opposite and complement each other, but the change in temperature is faster than the change in humidity over time. Furthermore, the fact that the lowest and highest temperature and humidity values for all boots are measured in the medial and 1st metatarsal region shows that the inner part of the boot provides more preliminary results in terms of discomfort than the outer part. Using the developed test device and method, it was found that the temperature changes within the first half hour are noticeable in terms of sensory comfort of the tested boot, similar to other studies.36,44 However, this temperature change does not directly reach the discomfort threshold of 38°C reported in the literature. 35 When interpreting the effect of moisture on boot comfort, the sensor data show that the boots experience a moisture-related change in comfort after 180 min of standing. After 300 min of wear, the humidity in the interior reaches 80%, which leads to moisture-related discomfort. 32
Table 5 shows that the limit values for comfort in terms of temperature in the seated position in the forefoot area are reached within the first 30 min. However, no temperatures that would cause discomfort were observed in the entire boot during the 8-h period. If you look at comfort in relation to humidity in Table 5, the humidity remains within the comfort zones for the first 180 min according to the scale (FCLS). However, as the test approaches 300 min, discomfort begins in all four-sensor regions. According to the results of the sensors, the temperature in the seated position reaches equilibrium within the first half hour of wearing the boots, but no discomfort is felt due to the temperature. 44 Humidity reaches the comfort limit within 180 min and after 300 min the discomfort starts, especially on the lateral of the foot. The results obtained for the seated position during the 8-h period are likely to be similar to real sitting conditions. In the future, it is important to compare the FCLS with the actual feelings and improve it accordingly.
Conclusion
The aim of the study was to develop a test device and method to evaluate the breathability and thermal comfort of footwear. In addition, a test method simulating an 8-h seated position was developed, taking into account previous studies, and applied to boots using the developed breathability test device. For this reason, the device was evaluated using a case study with three full leather boots, a footbed and a sock. During the test, the sensory comfort of the footwear during wear and the weight gain due to perspiration were recorded.
The objective of the study was to develop a test system that could be used to measure both breathability and thermal comfort. This system focussed on the observation of comfort-relevant humidity and temperature parameters as well as the parameters that can be felt on the skin. A comfort scale was also developed for this purpose. In addition, the study compared the degree of sweat wicking from the footwear with tests on the upper material and assessed the breathability of the footwear. For this purpose, sensor data and weight gain were monitored on a full leather boot.
Using the developed method , the amount of liquid absorbed by the footbed and the EN/ISO 12,746 test result showed similar results. • According to the EN/ISO 14,268 test result, more water was removed from the system (boot, sock and footbed) than the amount of water vapour that passed through the upper cross-section of the leather. • The amount of sweat released from the boot collar through transfer and evaporation was higher than the amount released from the cross-section of the leather. • During the test, 40% of the sweat was released into the system from the dorsal foot, 30% from the lateral-medial area and 30% from the sole. The release rates at six points were considered appropriate to simulate the seated position. • 65% of the total 40 g of sweat released was absorbed by the system, with 36% absorbed by the boot, 12% by the footbed and 52% by the sock. • The temperature in the boots increased during the first 30 min, but the initial temperature values were not recorded during the test when the boots were not moved. • The FCLS scale can be used to assess foot comfort based on temperature and moisture parameters. • The dorsal foot showed relatively higher temperatures compared to the lateral areas. • The threshold for moisture-induced discomfort in the boot is reached after 240 min, and discomfort starts after 300 min when the humidity reaches 80%.
The study provides a basis for research and development in the field of footwear breathability and thermal comfort testing. To achieve this, the performance of the system was evaluated using a customised full leather boot to assess repeatability. However, the device and method should be tested on different types of footwear to ensure wider applicability.
The study offers footwear designers, developers, researchers, manufacturers, suppliers and material producers the opportunity to add value to footwear production by simulating real footwear conditions in terms of design, material selection and production processes.
Future studies should include a comparison of wear tests focussing on the sensory comfort of the developed breathability test. In addition, further tests should be carried out to characterise footwear and materials, especially with regard to the weight gain caused by the addition of the lining variables.
Furthermore, the study on the breathability of footwear should be improved by integrating a walking system into the test device to observe active ventilation. The next phase of the study is planned accordingly.
Footnotes
Acknowledgements
We would like to thank Aerofoot Inc, a company active in the shoe industry, for the use of some of their equipment in this research article.
Funding
The authors received no financial support for the research, authorship, and/or publication of this article.
Declaration of conflicting interests
The authors declared no potential conflicts of interest with respect to the research, authorship, and/or publication of this article.