
Abstract
In this contribution, an epoxy resin based composites which synergistically modified by carbon fiber (MCF) and silicon carbide (SiC) particles were prepared. The chemical structure of MCF and SiC before and after surface treated using silane coupling agent were analyzed by Fourier transform infrared spectroscopy and X-ray diffraction, respectively. The mechanical properties including tensile, flexural, and compression of the composites were investigated. Moreover, the friction and wear performances were studied on a ball-on-ring wear tester. The results indicated that the best tensile, compressive, and friction and wear properties of composites were obtained when SiC particles content is 3.0 wt.%. Compared to the pure epoxy resin, when the SiC particles content is 4.0 wt.%, the best flexural strength and modulus were obtained, which increased by 8.7% and 52.97%, respectively. Both the average coefficient of friction (COF) and the wear mass losses of the composites decreased significantly with the addition of the modified SiC particles. In addition, the main wear mechanism of pure EP is adhesive and fatigue wear, while the SiC/MCF/EP composites exhibit abrasive and fatigue wear.
Introduction
Epoxy resin (EP) based composites have been widely used in many fields, such as aerospace, automobiles, wind power, machinery, and construction, due to their excellent electrical insulation properties, corrosion resistance, physical and mechanical properties, and chemical stability. 1 However, as a matrix resin for composites, epoxy resin has been limited its application fields and scope due to its low fracture toughness and deformation resistance. Extensive researches have been conducted by many researchers to enhance their performances. Currently, methods for toughening EP including incorporation various fibers, elastomers, thermoplastic resins, and second phases such as nano/micron rigid particles, which not only improve the mechanical properties of EP but also enhance its wear resistance, corrosion resistance, and heat resistance. 2 It is an effective way to modify brittle polymers and obtain high-strength and high-toughness polymers by incorporating surface treated rigid particles in resin matrix.
SiC particles are one of the semiconductor materials with many advantages such as high modulus of elasticity, hardness, strength, high-temperature oxidation resistance, impact resistance, corrosion resistance, as well as excellent wear resistance. 3 So they are widely used in high-temperature-resistant ceramics and have a wide range of applications in the aerospace and energy fields due to their excellent self-passivation properties in oxidizing environments. 4 Therefore, SiC particles are also one of the ideal resin fillers. Mohammadreza et al. 5 studied the different mass fractions of nano-scale SiC particles and SiC whiskers reinforced EP composites, and the results showed that the friction and wear properties of the composites were significantly improved. Kychkin et al. 6 obtained the best compressive performance of the composites by adding 0.75 wt.% ultrafine SiC particles to EP.
Carbon fiber (CF) is widely used in various industrial fields due to its excellent properties of high strength, high modulus, creep resistance, and corrosion resistance. 7 As a reinforcing phase in composites, CF also has some disadvantages, such as high surface inertia, a smooth surface, and a weak bonding ability with resins, which makes it more challenging to combine with resins to prepare higher-performance composites. Therefore, it is necessary to increase interfacial adhesion between fibers and EP by the modification of silane coupling agent on CF, and then prepare high-performance composites.8 –10 Capela et al. 11 reported that tensile strength and modulus of CF reinforced EP composites increased by about 52% and 400%, respectively, when the volume fraction of CF was 17.5%. Wang et al. 12 used a method of surface green grafting polyether amines, and it was found that the grafting significantly changed the surface polarity, wettability, and roughness of CF and the interfacial bonding properties between CF and EP were improved effectively.
In this paper, the CF was oxidized by hydrogen peroxide, then the oxidized carbon fiber (OCF) was modified by silane coupling agent KH580. KH550 was used to modify the surface of SiC particles. An epoxy resin based composites which were reinforce by surface modified CFs and SiC particles were prepared. At the same time, the tensile, flexural and compression mechanical properties were investigated. In addition, the friction and wear properties of SiC/MCF/EP composites were studied.
Experimental parts
Experimental materials
Bisphenol A epoxy resin E-51 was supplied from Hangzhou Wuhuigang Adhesive Co., Ltd. Carbon fiber (CF, T700, 12K, Standard length: 1 mm) were provided by Yixing Bangrui High Performance Carbon Fiber Products Co., Ltd. Silicon carbide (SiC, particle size: 5 µm) were purchased from Zhonghang Zhongmai Metal Materials Co., Ltd Hebei, China. γ-Mercaptopropyltriethoxysilane (KH580, purity >99%) was supplied by Guangzhou Shengzhipeng Trading Co., Ltd, structural formula was shown in Figure 1(a). γ-Aminopropyltriethoxysilane (KH550, purity>99%) was purchased from Jinan Xingfeilong Chemical Co., Ltd, structural formula was shown in Figure 1(b). Polyetheramine D230 (PEA D230) with density of 0.948 g.ml−1, which was supplied from Kunshan Jiulimei Electronic Materials Co., Ltd. Anhydrous ethanol (AR) courtesy of Guangdong Linshi Chemical Reagent Co., Ltd Guangdong, China. Hydrochloric acid (AR), manufactured by Guangzhou Chemical Reagent Factory. Hydrogen peroxide was provided from Foshan Furuixi Biotechnology Co., Ltd. Acetone (AR) was purchased from Shandong Aisha Technology Co., Ltd. deionized water was purchased from Hangzhou Distilled Water Factory. All the chemicals were used without further purification.

(a) Structural formulas of KH580, (b) structural formulas of KH550, (c) modification mechanism of CF, and (d) modification mechanism of silicon carbide.
Materials preparation
Preparations of KH580 modified carbon fiber (MCF)
The appropriate number of CF was wrapped with filter paper, placed in a Soxhlet extractor, acetone was added, and the mixture was heated to reflux for 24 h. Then, the above fibers were washed in deionized water 2–3 times and dried in a vacuum to obtain a degummed CF. 30 wt.% hydrogen peroxide solution was used to oxidize the above CF for 12 h, washed 2–3 times with deionized water, and vacuum dried to obtain desiccated OCF. 0.6 g OCF was added into a beaker, 40 g anhydrous ethanol was added, and 0.3 g KH580 was dropped to ensure that the mass ratio of OCF to KH580 was 2:1, then stirred ultrasonically for 15 min, then adjusted the pH to about 4 by adding hydrochloric acid solution, and react at 70°C for 4–6 h until the alcohol was completely volatilized. During the reaction process, ultrasonic dispersion was performed every 10 min for 30 min to maintain the dispersion of OCF in the reaction system and prevent OCF deposition. The OCF was washed to neutrality with anhydrous ethanol and vacuum-dried at 85°C for 10 h. The KH580-modified CF was obtained. The principle of CF modification is shown in Figure 1(c).
Preparation of KH550 modified silicon carbide
Appropriate amount of SiC particles were washed 2–3 times by deionized water until neutral, and dried at 100°C for 8 h. The dried SiC particles were placed in a beaker, 60 g anhydrous ethanol solution was added, and then KH550 was added to ensure that the mass ratio of SiC particles to KH550 was 9:1. Then dispersed and stirred ultrasonically for 30 min, adjust the pH to about 4 by adding hydrochloric acid solution, then heated and stirred ultrasonically at 70°C for 4–6 h until the anhydrous ethanol was completely volatilized. Finally, the anhydrous ethanol was used to wash 2–3 times until neutral, vacuum dried at 100°C for 8 h, grind it into fine powder, wait for use. The principle of SiC modification was shown in Figure 1(d).
Preparations of SiC/MCF/EP composites
Before the experiment, the surface modified CF and SiC particles were added into the acetone solution mixed mechanically. Next, the above solution was added into the epoxy resin, stirred immediately. After the mixture was evenly dispersed, it was placed in a water bath at 80°C to perform ultrasonic operation for 3 h to remove solvent. After cooling to room temperature, the curing agent D230 was added into the organic solvent, stirring and degassing. The mass ratio of EP resin to curing agent D230 is 10:3. The mixture resin was vacuumed at 25°C for 3 h, poured into a preheated mold, and vacuumed at 35°C for 1 h. Subsequently, they were cured at 80°C for 2 h, 130°C for 3 h, and demolding. The designation and composition of the composite samples are listed in Table 1. The preparation process is shown in Figure 2.
Designation and composition of the composite samples.


Preparation process of SiC/MCF/EP composites.
Characterization of composites
The fracture morphologies and the worn surfaces of the composites were observed by a scanning electron microscope (Flex SEM1000, Hitachi Corporation, Japan). The functional group changes on CF surfaces were characterized by Fourier transform infrared spectrometer (Nicolet iS50, Thermo Fisher Scientific). Physical phase of the SiC particles before and after modification was analyzed by X-ray diffractometer (Smartlab SE, RIKEN, Japan). The tensile properties, flexural properties, and quasi-static compressive properties of the composites were determined by using a microcomputer-controlled electronic universal material testing machine (CTM8050, Xieqiang Instrument Manufacturing Co., Ltd., Shanghai) according to the GB/T 1040.1-2018, GB/T 9341-2008, and GB/T 1041-2008, respectively. Among them, the shape of the compression specimen is in the shape of a cylinder with a diameter of 22 mm and a height of 18 mm. Figure 3(a) shows the size of the tensile specimen and Figure 3(c) shows the size of the flexural specimen. The friction and wear performances of the composites were determined by the microcomputer control universal vertical friction and wear tester (MMW-1) at room temperature (RT, ∼25°C) and the relative humidity is 60% according to the GB/T3960-2016. Figure 3(b) shows the size of the friction wear specimen. The spindle speed of the thrust ring friction pair (outer diameter: 50 mm, inner diameter: 42 mm) was set at 200 r·min−1, and the load was 40N. Before the test, the surface of the friction and wear specimen was polished with 1000 mesh sandpaper to ensure that the surface roughness of the specimen was the same for every test. The tests were conducted at intervals of 10, 20, 30, and 40 min, respectively. An electronic balance with a sensitivity of 0.1 mg (JJ224BC, Changshu Shuangjie Testing Instrument Factory) was used to record the mass before and after the tests. Three independent friction and wear tests were carried out for each specimen, and the average values were calculated.

Size of (a) tensile specimen, (b) friction specimen, and (c) the bending specimen.
Results and discussion
FTIR of modified carbon fibers
Figure 4 shows the infrared spectra of CF, OCF, and MCF. It can be seen that the peak at 1632 and 3440 cm−1 are the characteristic peaks of -OH bending and stretching vibration. The peak around 2926 cm−1 is the stretching vibration of methyl and methylene. 13 The symmetrical C-H extension of the Si-O-CH2CH3 group becomes smaller around 2850 cm−1. 14 A sharp peak for -OH flexural frequency of the Si-O-CH2CH3 bond at 1400 cm−1 after being hydrolyzed. 15 The peak at 1040 cm−1 corresponds to the vibration characteristic of Si-O-C.16,17 A peak at 1192 cm−1 corresponds to the Si-O-Si bond,18 –20 which is formed due to the hydrolysis-condensation reaction of the Si-O-CH2CH3 bond in KH580, but this has no significant effect on the adhesion of the coupling agent. 14 The hydrolysis-condensation reaction equation is shown in Figure 5. In addition, the C-S bond was observed around 1070–1100 cm−1 and the S-H bond around 2550–2600 cm−1. 14 Due to the weak absorption peaks of these two groups, infrared spectroscopy is difficult to detect. The presence of two chemical bond characteristic peaks, Si-O-CH2CH3 and S-H, indicate that the silane coupling agent had been successfully grafted on the surface of the carbon fibers.
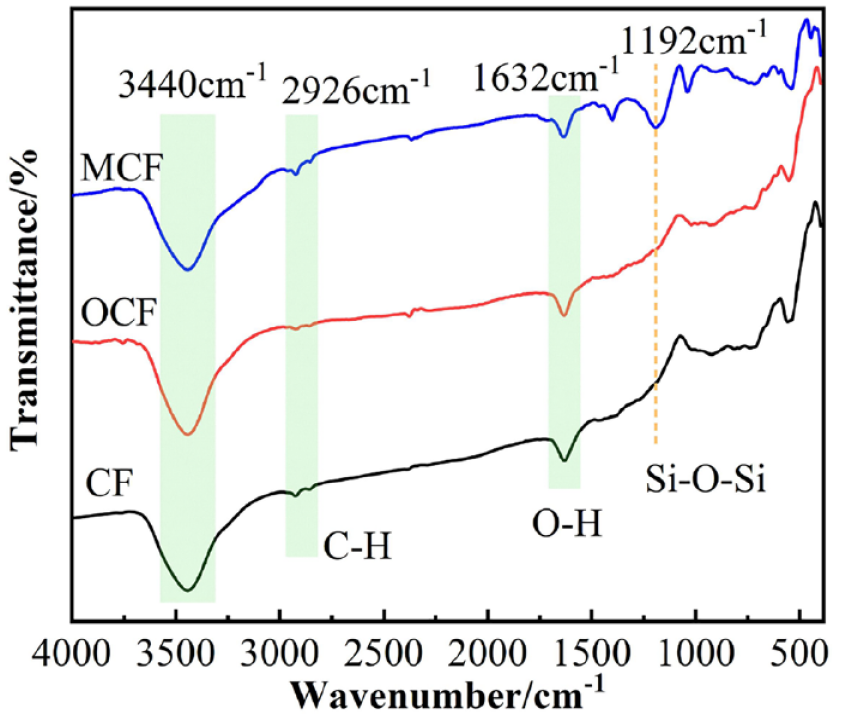
Infrared spectra of CF, OCF and MCF.

Hydrolysis-condensation reaction equation of KH580.
The SEM images of CF, OCF, and MCF are shown in Figure 6. It can be observed that the surface of the CF was relatively smooth and clean, and the grooves were not prominent, as depicted in Figure 6(b), while many pronounced grooves occurred on the surface of the OCF, and the roughness was also increased. In Figure 6(c), the surface of MCF was wrapped with the modifier, so the surface has a more significant roughness, which is also the main reason why MCF can be tightly combined with resin matrix.

SEM images of (a) CF, (b) OCF, and (c) MCF.
XRD analysis of modified silicon carbide
The composition and organizational structure of materials are important factors in determining the properties of materials. XRD analysis can provide the physical structure and elemental analysis of materials. Figure 7 shows the XRD spectra of SiC before and after surface modification. It can be seen that the XRD spectra of SiC particles have characteristic diffraction peaks, among which the more apparent peaks appear at the five positions of 34.1°, 35.7°, 38.1°, 60.1°, and 71.8°. The corresponding crystal planes are (101), (102), (103), (110), and (116), which are characterized by the same five peaks positions, the exact distance between the peak positions, and no significant changes in the number and peak width, which shows that the modification of SiC particles by KH550 did not change the internal structure of SiC. 21 However, the intensity of the SiC diffraction peaks modified by KH550 is higher and the peak shapes are sharper, which indicates that KH550 has successfully coated the surface of the particles, which results in larger particle sizes and better crystallization levels. Therefore, the internal structure of modified SiC remains unchanged and the particle size becomes wider, which is more conducive for the dispersion and combination of particles in EP matrix.

XRD spectra of SiC before and after surface modification.
Mechanical properties of SiC/MCF/EP composites
Tensile performance
Figure 8(a) shows the tensile stress-strain curves of the SiC/MCF/EP composites. It can be seen that all samples have obvious yield phenomena during the tensile process. When the content of MCF is 0.1 wt.%, as the strain rate increases, the stress gradually increases to the maximum value, and then the specimen fractures. The maximum stress of S3 is the highest, which is 15.66% higher than that of the unmodified EP sample. The upper and lower yield stresses of the SiC/MCF/EP composites are shown in Figure 8(b). It can be seen that both the upper yield stress and the lower yield stress show the same trend.

(a) Tensile stress-strain curves and (b) yield stress diagram of SiC/MCF/EP composites.
Figure 9 illustrates the difference in the tensile strength of the SiC/MCF/EP composites. It can be seen that the tensile strength of the composites increased first and then decreased. When 0.1 wt.% MCF was added, the tensile strength of S0 is increased by 1.5%. This mainly due to the surface grafting treatment of OCF through the KH580, and the fibers surface become uneven due to the fibers were wrapped by the silicon coupling agent. Therefore, the interface compatibility between MCF and EP has been increased and the interface effect was enhanced. 22 When the content of SiC particles up to 3.0 wt.%, and the tensile strength of composites were the highest, showing 15.66% increment than that of the S specimen and 13.96% than that of the S0 sample. This is mainly due to the interface compatibility between the surface modified SiC particles and EP resin matrix was improved. So the stress can be transferred by SiC particles, the propagation and passivation of cracks were prevented, thereby the tensile strength of the composites were improved accordingly. 23 When the SiC particles content further increased, the attraction of the SiC molecules increased, and agglomeration occurred in the MCF/EP system, which makes the dispersion of SiC particles worse. This will destroy the continuity of the epoxy resin matrix, thereby the tensile properties of the composites were reduced. 5 As shown in Figure 9, the tensile strength of S4 and S5 samples showed a significant decrease of 8.25% and 12.31%, respectively.
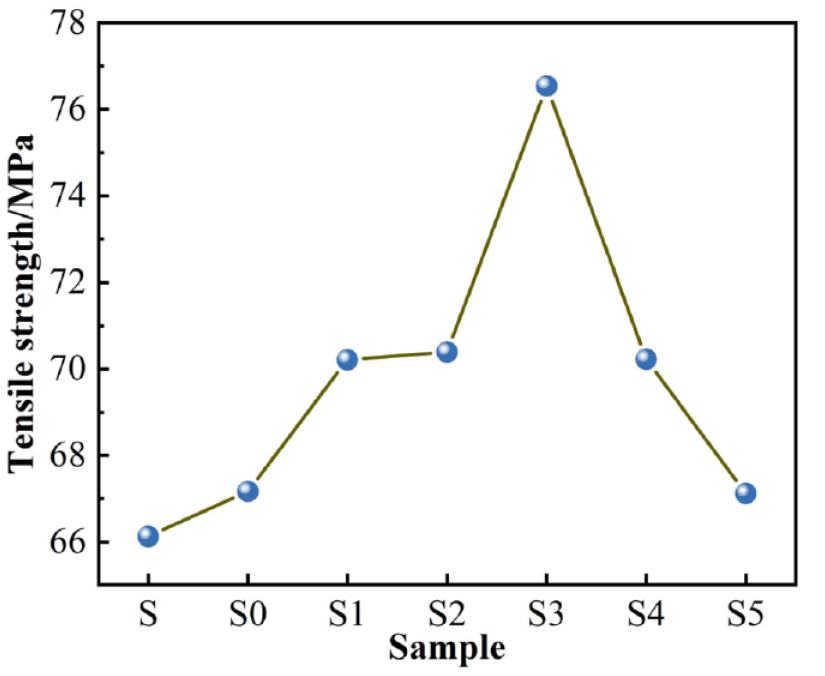
Tensile strength variation curves of SiC/MCF/EP composites.
Flexural performances
Figure 10(a) illustrates the flexural stress-strain curves of the SiC/MCF/EP composites. It can be seen that all the samples showed obvious yield phenomena during the flexural process. When the content of MCF is 0.1 wt.%, with the increase of the strain rate of the specimen, the stress gradually increased to the maximum value, and then the specimen fractured. The maximum stress of S4 is the highest when it breaks, which is 8.7% higher than that of the unmodified EP.

(a) Flexural stress-strain curves of SiC/MCF/EP composites, (b) variation curves of flexural strength and flexural modulus of SiC/MCF/EP composites.
Figure 10(b) displays the flexural strength and flexural modulus curves of SiC/MCF/EP composites. It is observed that the flexural strength and flexural modulus of the composites increased continuously with the increase of particle content. 24 In contrast, the flexural strength showed a trend of increasing firstly and then decreased. The flexural strength of the composites was improved with the addition of the MCF. Compared with S0, when the 1.0 wt.% and 2.0 wt.% SiC particles blending with 0.1 wt.% MCF were added, the flexural strength decreased by 3.67% and 5.45%, respectively. This indicates a weak bond between the EP and the particles, and the uneven density distribution inside the composites, more stress concentration areas were formed, resulting in poor flexural strength. 25 As the SiC content increased to 4.0 wt.%, the flexural strength of the composites reached the maximum, an increase of 8.7% compared with the pure EP. However, as the SiC content increased to 5.0 wt.%, the flexural strength of the composites was the lowest, but the flexural modulus reached the maximum, which increased by 52.97% compared to pure EP.
Quasi-static compression performances
Figure 11 presents the quasi-static compressive stress-strain curves of the SiC/MCF/EP composites. The compressive surfaces of all the samples are similar, independent of the MCF and SiC content. It can be seen that the compressive curves of composites can be divided into three stages, the regions were: (i) initial elastic stage, (ii) subsequent nonlinear yielding and (iii) followed by plastic deformation region with higher and increasing slope that appears after densification, resulting in the unloading of the samples. 26 In the elastic stage, stress increased with increasing strain. In the yield stage, the plastic deformation occurred. When the stress reaches the peak value, the composites gradually lose their ability to resist deformation. It should be noted that the compressive strength of S3 specimen is highest, which indicating that S3 has the most capability to resist compressive deformation. The yielding stage is followed by the strengthening stage, where the stress gradually increases until it reaches the maximum value. No brittle fracture occurred in the whole compression process. Figure 12(a) and (b) display the variation of height and diameter of the specimens before and after compression, respectively. It can be seen that the specimens become drum-shaped after being compressed.

Compressive stress-strain curves of SiC/MCF/EP composites.

Variations in (a) height and (b) bottom diameter of the specimen before and after compression.
Figure 13 plots the variation of compressive strength and compressive modulus of SiC/MCF/EP composites. It can be found that both the compressive strength and compressive modulus showed first increase and then decrease trends. The difference in compressive yield strength of S and S0 was insignificant, and the compressive strength decreases slightly after a small amount of 0.1 wt.% MCF were added, compressive modulus increased slightly, but the variation of modulus was not significantly. When the carbon fiber content remains unchanged and 1.0 wt.% SiC continues to be added, the strength and compressive modulus show a decreasing trend. When 2.0 wt.% content of SiC particles was added, the strength and modulus increased, which was attributed to the gradual better dispersion of the reinforcing phase in the resin matrix, resulting in the enhancement of the compressive properties of the matrix. When the 3.0 wt.% SiC was added, and the compressive yield strength and compressive modulus of the composites reached the optimum condition, which increased by 8.73% and 25.73%, compared with the pure EP. A small amount of SiC particles were added can disperse more uniformly in the MCF/EP system, increasing the contact area between the SiC particles and EP matrix. At the same time, the interfacial binding force between the modified SiC particles and EP becomes more robust, which is beneficial to the stress transfer between the particles and the matrix 27 ; thereby, the ability of the composites to resist compression deformation was increased. When the addition amount of SiC particles exceeded 3.0 wt.%, SiC particles were easily aggregated in the MCF/EP system, and the aggregated particles and fibers would sink to the bottom of the mixture due to gravity, which resulted in lower dispersion within the resin system, leading to a decrease in the compression properties of the composites.

Variation curves of compressive yield strength and compressive modulus of SiC/MCF/EP composites.
Fracture surface morphologies of SiC/MCF/EP composites
Figure 14 shows the fracture surfaces of the pure EP and SiC/MCF/EP composites. The fracture surface of pure EP was smooth, some steps, river cracks, and stress concentration areas occurred, indicating that the pure EP has brittle fracture, as shown in Figure 14(a). 28 In contrast, the fracture surface of the MCF/EP composite was rougher than that of the SiC/MCF/EP composite due to the stress distribution was affected by the CF in the MCF/EP composites (Figure 14(b)). MCF is uniformly and anisotropically distributed in the resin, and excellent interfacial contact between MCF and the resin was formed. The sulfhydryl groups on the surface of the CF grafted by KH580 can click with the carbon-carbon double bond of the resin and bond more tightly with the resin. 29 As shown in Figure 14(b), holes were formed on the fracture surfaces of the MCF/EP composites due to the extracted and the pulled out of fibers.

SEM images of fracture surfaces of pure EP and composites: (a) S, (b) S0, (c) S1, (d) S2, (e) S3, (f) S4, and (g) S5.
Figure 14(c) and (d) present the fracture surfaces of S1 and S2 samples. It can be found that the plastic deformation occurred on the fracture surface, both SiC particles and fibers were embedded in the EP matrix. The fibers pulled out occurred and stress concentration area was also formed. It is because the modifier wraps the surface of SiC and CF, and the interfacial compatibility with EP was improved when the composite undergoes tensile fracture. Therefore, the addition of modified SiC and CF can withstand more loads and block the extension of microcracks, more energy from the crack edge was consumed, and the mechanical properties of the composites were improved. As shown in Figure 14(e), many relatively uniform microcracks and micro pits were formed on the fracture surface due to the pull-out of SiC particles. Compared to Figure 14(e), the micropores in Figure 14(f) are significantly less and the microcracks become more inhomogeneous, therefore the performance decreases compared to S3. Figure 14(g) indicates the fracture surface of the composites with 5.0 wt.% SiC particles, where the SiC particles were agglomerated in the resin, and the resin and fibers were adhered by the partially aggregated particles into piles, which is a fundamental reason for the decline in material performance. Therefore, the best performance was achieved when 3.0 wt.% of SiC particles were added.
Tribological properties of SiC/MCF/EP composites
The friction and wear characteristics of SiC/MCF/EP composites were studied on a friction and wear tester. The schematic diagram of the tester is illustrated in Figure 15(a). Figure 15(b) shows the photograph of the friction and wear tester, it can be seen that the thrust ring is rotating clockwise at high speeds.

(a) Schematic diagram of the thrust collar model friction and wear tester, (b) tester real time test photo.
Figure 16 shows the variations of average COF and wear mass losses of the SiC/MCF/EP composites. It can be seen that when 0.1 wt.% MCF were added, and the COF of the composites decreased gradually. The average COF of the composites decreased between 0 and 3 wt.% with an increase in the content of modified SiC particles. This may be because the bonding of the particles in the epoxy matrix was good enough, which producing a thin and uniform transfer film on the counterpart surface of the disk. The COF would be expected to change with the addition of SiC because fillers affect the formation of transfer film. 30 When 3.0 wt.% of SiC particles were added, the average COF of the composites reached the lowest, which is 38.51% lower than that of pure EP. When the content of SiC particles was added to 5.0 wt.%, the COF increased slightly, nevertheless, it is still 30.65% less than that of pure EP. In this case, the transfer film did not completely cover the counter face and since SiC particles were hard, they plowed the counter face, which resulted in an increase in the friction.

Variations of average COF and wear mass losses of SiC/MCF/EP composites.
It can be seen from Figure 16 that the wear mass losses of SiC/MCF/EP composites present a decrease first and then increase trend. When the filler is less, the wear mass losses of the composites decreased with increasing of SiC particles between samples S and S3. This is due to the increase in SiC content and the number of filled particles in the transfer film, and as friction proceeds, the separated particles may also act as a solid lubricant, leading to a reduction in the wear mass losses of the composites. When 3.0 wt.% of SiC particles were added, the wear mass losses of the composites are the lowest, 59.7% less than that of pure EP. The wear mass losses increased again when 4.0 wt.% and 5.0 wt.% SiC particles were added. This is due to the fact that the SiC particles agglomerates in the resin matrix, thus destroying the formation of the transfer film. 31 In addition, the load was shared by the hard SiC particles, the resin is a soft polymer and carries a lower load, and the agglomerated SiC particles are more likely to carry the resin with them as they peel away from the wear surface. 5
Figure 17 shows the variations of wear mass losses of SiC/MCF/EP composites with sliding time. It can be found that the wear mass losses of all the samples increased with the increase of the sliding times. At the different wear times, the wear mass losses of the composites showed a trend of decreasing first and then increasing. The wear mass losses of the MCF/EP composites reached the minimum when 3.0 wt.% SiC particles were added. Compared with pure EP, the wear mass losses of the S3 samples were reduced by 59.72%, 43.16%, 31.56%, and 26.09%, respectively.
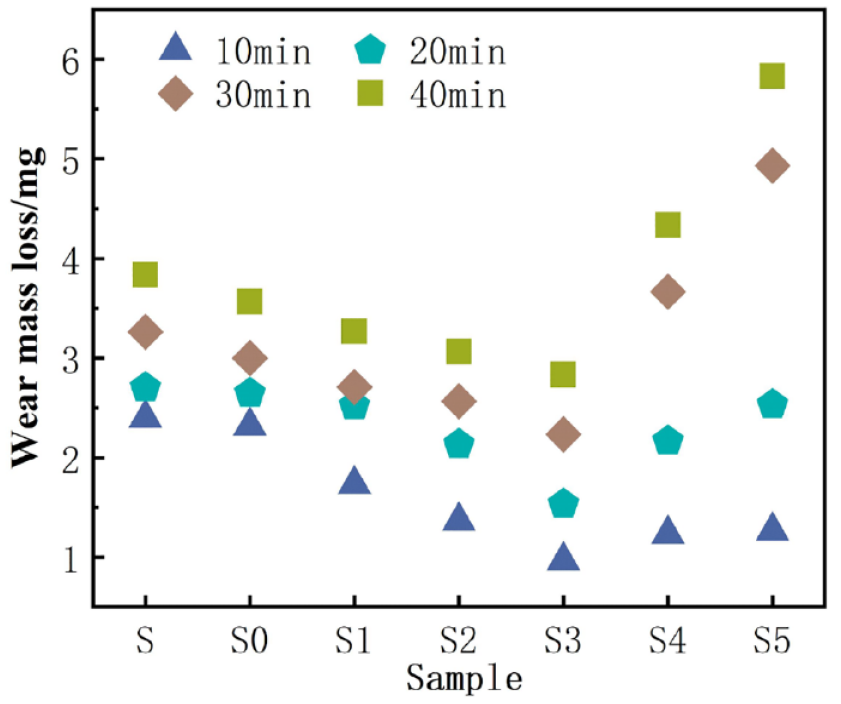
Variations of wear mass losses of SiC/MCF/EP composites with different sliding time.
Figure 18 presents the variations of the COF of SiC/MCF/EP composites with sliding time. It was obvious that in the early stage of the running-in period, the COF of all samples increased rapidly with the progress of friction. Compared with pure EP, the COF of the composites with SiC and MCF added had relatively minor fluctuations in the stable period. In addition, the COF of pure EP still fluctuated wildly after the stable period. The reason was that, compared with the EP composites, the hardness of pure EP was the lowest, 32 and the plastic deformation of the EP worn surface was more severe during the friction process, which resulted in serious fatigue wear and which led to a significant fluctuation of friction coefficient after the stable period. 33 It was found that the friction coefficients of S2, S4, and S5 decreased and stabilized when the content of modified SiC was increased to 2.0 wt.%, 4.0 wt.%, and 5.0 wt.%. It shows that the modified SiC particles can be well combined with the EP matrix. The higher the content of SiC particles, the better the stress transfer of the matrix, and it can withstand higher normal loads. 34 At the same time, many SiC particles were distributed on the friction surface, which can reduce the tearing and groove formation on the surface of EP composites; thereby, the friction coefficient was reduced. 35 The coefficient of friction curve for specimen S3 with 3.0 wt.% SiC added is at the bottom of the graph and has the lowest coefficient of friction, and it is because an appropriate content of SiC particles acts as a stress transfer medium, which can take part of the load to directly release the stress in the epoxy matrix, secondly, due to the strong hardness of the particles, defects in the wear interface were filled with SiC particles and surface fatigue resistance was improved. 36 Therefore, the composites with 3.0 wt.% SiC added has the best frictional wear performance.

Variation curves of friction coefficient of SiC/MCF/EP composites with sliding time.
Figure 19 shows the worn surfaces of the composites. As shown in Figure 19(a), a number of distinct undulating ripples and cracks appeared on the worn surface of the pure EP, which were the result of the stripping of the resin. In addition, some wear debris accumulated on the worn surface, which indicating that adhesive wear and fatigue wear are the main wear mechanisms. 33 As illustrated in Figure 19(b), obvious grooves appeared on the worn surface of the MCF/EP composite, which were the result of resin detachment during the friction process, in addition to some cracks and linear craters left by the detachment of carbon fiber. Figure 19(c) and (d) show the worn surfaces of S1 and S2 samples. It can be seen that more pronounced craters and grooves occurred, which is attributed to the high-speed rotation of the friction pair, which strips out the resin as well as the fiber and particles, forming craters that are offset in the same direction. The protruding part can be seen in Figure 19(c) as a phenomenon after the resin has been extruded. Figure 19(e) shows the worn surface of S3, which still appears to be relatively flat under prolonged friction, with no cracks produced, and with less wear debris, there is resin stripping, but the craters are relatively shallow, and the wear track and direction of wear can be clearly seen. It is due to the good physical adsorption between modified SiC and EP, the alkoxy group in the coupling agent can react with the end hydroxyl group of the EP, improving the compatibility of SiC and EP, thus avoiding the generation and expansion of cracks. 37 Figure 19(f) and (g) show the worn surfaces of S4 and S5 specimen. Compared with the previous samples, there are more cracks on the surface of S5, but the cracks are extremely shallow. In addition, many small pits appeared on the worn surface of S5 sample, which is caused by the shedding of SiC particles, manifested as abrasive wear and fatigue wear. 38 Appropriate SiC particles addition could be better dispersed in the resin matrix. The friction and wear properties of the composites could be improved due to their high wear resistance. 39
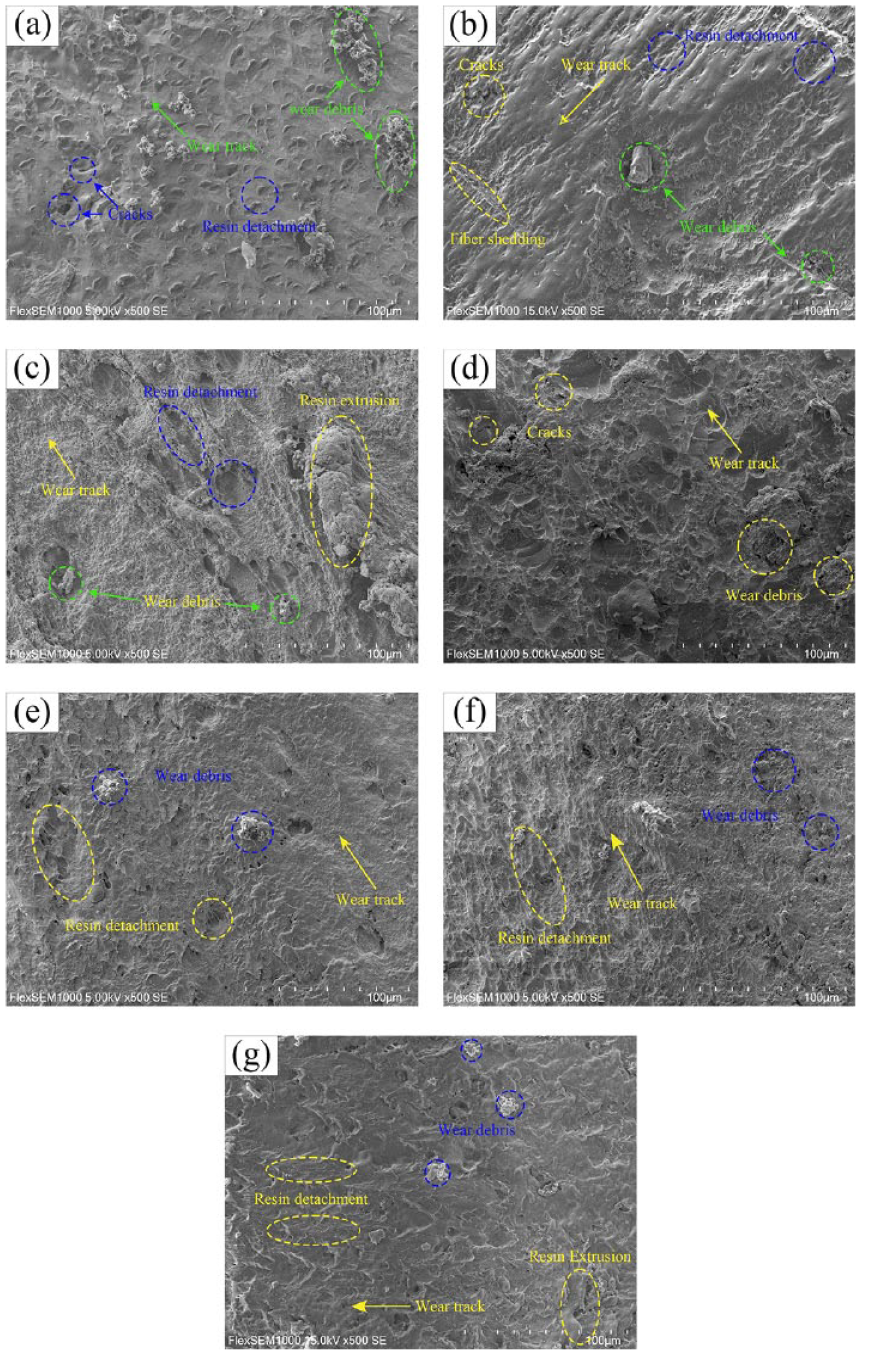
SEM images of worn surfaces of pure EP and SiC/MCF/EP composites: (a) S, (b) S0, (c) S1, (d) S2, (e) S3, (f) S4, and (g) S5.
Conclusions
In this paper, surface modified SiC particles and CF was applied to toughen epoxy resin, and the mechanical and tribological properties of SiC/MCF/EP composites were investigated. The results showed that:
(1) When the SiC particles content is 3.0 wt.%, the tensile and compressive properties of the SiC/MCF/EP composites were the best, the tensile strength increases by 15.66% compared with pure resin, the compressive strength increases by 8.73%, and its compressive modulus increases by 25.73%.
(2) FTIR spectra showed that silane coupling agent was successfully grafted on CF surface, and the XRD pattern of SiC particles did not change significantly before and after the surface modification.
(3) Compared with the pure EP, the average COF and wear mass losses are the lowest when SiC particles content is 3.0 wt.% and CF content is 0.1 wt.%.
(4) The SiC/MCF/EP composites exhibit plastic fracture behavior. The SEM images of worn surfaces reveal that the wear mechanisms of pure EP are mainly the adhesive and fatigue wear; whereas, the wear mechanisms of SiC/MCF/EP composites are abrasive and fatigue wear.
Footnotes
Author contributions
Conceptualization, Haixia Hu and Sinian Zhang; Methodology, Haixia Hu; Software, Sinian Zhang; Validation, Sinian Zhang; Formal analysis, Haixia Hu and Sinian Zhang; Investigation, Sinian Zhang; Data curation, Sinian Zhang and Yonggang Wang; Writing-original draft preparation, Sinian Zhang and Yonggang Wang; Writing—review and editing, Haixia Hu and Sinian Zhang; Project administration, Sinian Zhang.
Declaration of conflicting interests
The author(s) declared no potential conflicts of interest with respect to the research, authorship, and/or publication of this article.
Funding
The author(s) disclosed receipt of the following financial support for the research, authorship, and/or publication of this article: This work was supported by the Key Program for the Education Department of Anhui Province (KJ2020A0282).
Data availability
No data was used for the research described in the article.