
Abstract
Garments should not overload the body during activity and should be chosen in accordance with the ambient conditions. Especially in active sports, sportswear should make a person feel comfortable and increase performance by easily removing excess heat and moisture from the body without interrupting physical activity. In this study, five T-shirts with the same size and weight characteristics, but in different yarn types were produced and analysed. The thermal and water vapour resistance properties of these garments were measured using a thermal manikin system. In addition, thermal camera images were taken at 10-minute intervals during the 50-minute wear trial programme, and skin temperatures were measured from the upper front body and the upper back body with two sensors. The results showed that POS and PM-coded garments made of polyester with low clothing insulation (clo) values were statistically different from CS and CPS coded cotton-containing garments in terms of front and back surface thermal camera images. It was observed that cotton-containing garments were more uncomfortable than polyester and Tencel owing to their higher thermal resistance, garment surface temperature, and skin temperature values. The Tencel garment was measured similarly to the CS and CPS coded garments at the beginning of the activity and measured similarly to the POS and PM coded garments at the end of the activity on both surfaces.
Introduction
Human thermal comfort depends on metabolic rate (internal heat production), heat loss from the body, and climatic conditions. 1 The main task of the clothes is to ensure the continuity of the thermal balance by balancing the heat and moisture losses on the skin surface. The most important parameters affecting the thermal comfort properties of clothing are the thermal resistance and water vapour resistance properties. 2 The heat transfer between the human body and its environment depends on the temperature difference between the human body and environment. The higher this difference, the greater the heat flow. 3 Especially in cases of high activity such as sports, the human body throws excess heat into the external environment through sweating. The situation in which sweating occurs in the form of vapour is defined as insensible sweating, and the situation in liquid form is defined as sensible sweating. 4 Fabrics with high water vapour permeability are preferred especially in areas where sweating is high, such as active sportswear. If the water vapour resistance of the garment is high during sweating, the relative humidity in the microclimate will increase, and it will be difficult to evacuate the sweat to the outside and the person will feel uncomfortable. Especially, during high-intensity activities such as running, climbing, and skiing, athletes need comfortable clothes because the sweat that occurs on the garment aggravates clothing and reduces athlete performance.5,6 For this reason, designing comfortable and breathable sportswear is crucial for athletes, especially for long distance runners.
A thermal manikin is used to measure the thermal resistance of garments and garment groups. In comparison to other methods, thermal manikins allow the investigation of fully assembled clothing; however, without any influence of subjective interpretation of human testing or simple physical testing of the materials (bi-dimensional). 7 In terms of functionality, thermal manikins can be separated into three categories: motionless and cannot simulate sweating, not move but simulate sweating, and simulate movement and perspiration.8,9 The study examined the impacts of fullness and ventilation holes on clothing comfort and found that the added fullness reduces the thermal and water vapour resistance properties of the garment. 10 The thermal resistance properties of rowing athletes’ t-shirts were measured using a thermal manikin, and it was observed that the thermal insulation changed depending on the water repellent finishing process. 11 The local thermal insulation values of multi-layered clothing were investigated with thermal manikin Newton and found local thermal insulation could be estimated as a function of air velocity, local insulation, and walking velocity. 12 In the study investigating the effects of fibre, yarn, knit structure, fabric finishing, and activity level on the thermal manikin’s water vapour resistance, it was reported that the effect of material differences in garment form was low. 13 In another study, the effect of fabric properties and fit of the garment were investigated using a sweating thermal manikin. It was observed that the inner layer worn under the garment had a greater effect, especially in the chest part on heat transfer by evaporation. 14
Thermal imaging systems are used by designers to measure skin and surface temperature to provide efficiency and cost savings. 15 The advantage of using thermal camera technology for measuring skin temperature is that it does not require physical contact with the object. In addition, it allows only the temperature of the body part to be measured, provides freedom of movement during exercise, and has a high sensitivity, accuracy, and repeatability. In the study comparing 100% cotton fabric with a synthetic fabric, a thermal camera was used and the synthetic fabric showed significantly lower average skin temperatures. 16 In another study comparing synthetic, natural wool, and polyester, it was observed that there was no difference in terms of skin temperature, core temperature, and heart rhythm values. 17 A thermal camera was used to visualize human whole body anterior cutaneous temperature (Tc) variations in high performance runners in one of the studies 18 and it was observed that the skin temperature of the subjects decreased as the load applied to the body during gradual exercise increased in another study. 19 Mesh fabric construction was used to examine the effects of ventilated designs of T-shirts and it was observed that there was a significant difference in skin temperature, clothing microclimate temperature, oxygen uptake, respiratory exchange rate, sweat efficiency, and comfort feeling. 20 Women’s upper body and breast skin temperatures and thermal comfort were investigated on a sports bra and it was found that material properties affected thermal comfort and post-exercise skin temperature. 21 A thermal imaging technique was used to evaluate the thermo-active base layer of cycling clothing with a wear trial, and it was observed that there was a significant correlation between the ergometer power parameter and body temperature changes. 22 The thermal camera was used to measure indirectly regional sweat absorption of clothing in one of the studies, 23 it was used to investigate the effect of garment fit on the thermal transfer properties of garments in another study. 24
The use of thermal imaging techniques in thermal comfort measurements is an ideal tool as it can collect the skin temperature of the individual and interpret the thermal comfort without direct contact with the skin surface. A thermal manikin system was used to measure the thermal and water vapour resistance properties of the garments, and a thermal camera was used to measure the surface temperatures of the garments. In addition, temperature sensors were used for the upper front and upper back skin temperature measurements. The difference between this study and other studies in the literature is that the condition of sportswear during use can be monitored, and the positive effects of garments on the thermophysiological comfort of athletes can be monitored during the wear trial. Additionally, this study is an interdisciplinary work that provides field data because active athletes are involved and athletic competition events are simulated in a laboratory in terms of the test environment and selected activity conditions.
Experimental details
Garment properties and subjects
The properties of the fabrics tested using the standard methods are listed in Table 1. In this study, four single jerseys and a mesh fabric structure are compared using a thermal camera and thermal manikin tests. Five types of short sleeve garments were used in the wear trials. All garments were produced with the same model and medium size (Figure 1). Ten healthy athletes (Age: 21±3 years, Height: 180,3±5cm, Bodyweight: 70±5 kg) from the Bursa Uludag University Sports Science Faculty performed the tests. All subjects were healthy and non-smokers, with no history of cardiopulmonary disease. A consent form was prepared in accordance with the principles stated in the Helsinki Declaration and containing the wear trial protocol was read to the subjects before the study, and this consent form was signed by the subjects. This study was approved by the Ethics Committee of Bursa Uludag University.
Fabric properties and clothing insulation value of tested garments.


Model of T-shirt samples.
Research design
T-shirts sewn from fabrics produced for use in wear trials were tested by using a thermal manikin measurement system. The porosity of the fabrics was as follows:

where t is sample thickness (cm), 1 is the loop length (cm), d is yarn diameter (cm), C is the number of courses per cm and W is the number of wales per cm.25,26 To study the effects of different yarn compositions on the thermal insulation and water vapour resistance properties of the garments, a movable sweating thermal manikin (Newton) was used. Newton constructed a thermally conductive aluminium filled carbon epoxy shell with embedded heating and sensor wire elements. The water vapour resistance and thermal resistance values of these T-shirt samples were measured at AITEX Spain Laboratories. Thermal resistance tests were performed using the parallel measurement method according to the EN ISO 15831: 2004 standard. Water vapour resistance tests were performed using a parallel measurement method according to the ASTM F2370-16 standard. Thermal manikin experiments were conducted in a climatic chamber of 27.0±2ºC and 45.0±5% RH with an air velocity of 0.5±0.3 m/s and wear trials of T-shirt samples were conducted in a controlled room with the same conditions to enable the subjects to sweat. Thermal manikin measurements were made in standing mode to compare with fabric form test results from a previous study. 6 Each T-shirt was tested three times, and a mean value out of three tests was taken. The average thermal resistance value of the naked thermal manikin under static conditions was found to be 0.071 m².K/W and the clo value was 0.46. Clo was defined as the amount of thermal insulation to keep a sedentary person comfortable at 21°C. 27 The thermal resistance value obtained from the thermal manikin test results and the clo value can be converted to each other (1 clo = 0.155 K.m2/W).
In this study, a 50-minute wear trial programme was chosen and the speed was increased at 10-minute intervals to ensure sweating on the treadmill. Exercise programme phases: 0-10. minutes: 9.5 km/h and 1º incline, 10-20. minutes: 10.5 km/h and 1º incline, 20-30. minutes: 11.5 km/h and 1º incline, 30-40. minutes: 12.5 km/h and 1º incline and 40-50. minutes: 13.5 km/h and 1º incline. A cotton garment was used as the control garment. Each subject performed this submaximal exercise five times in total at 4-7 days intervals with four different test garments and a control garment at 27 ºC and 45% humidity. The participants wore the same shoes, socks, and underwear in each trial and visits occurred at the same time of the day. A datalogger (Almemo, Germany) was used in the wear trials to measure the skin temperature of the athletes at 1-minute intervals from the chest and back during the activity. Temperature sensors were used for front and back skin temperature measurements. A digital infrared camera was used, and thermal images of the subjects were taken during a running exercise (Testo 882, 320 x 240 pixels). The infrared emissivity value of the skin was adjusted to 0.98, and the spectral range is between 8-14µm. Because thermal images were taken during exercise, a high-sensitivity camera was preferred (thermal sensitivity <0.05°C). The infrared camera was calibrated using a blackbody before each wear trial test. Calibrations were made using a 27°C adjusted temperature stabilization test, and thermal images were taken for 30 minutes at one-minute intervals. The subjects put on garments and stayed for 10 min under laboratory conditions to adapt to the experimental environment. Photos of the upper body front and back sections were taken with a thermal camera during exercise for 10-minute periods. The tripod of the thermal camera was placed 1m away from the treadmill for frontal and rear thermal images. The thermal scale shown in Figure 2 was used to evaluate the thermal images of the participants. The Testo IRSoft software programme was used to obtain and examine thermal images of the garment samples.
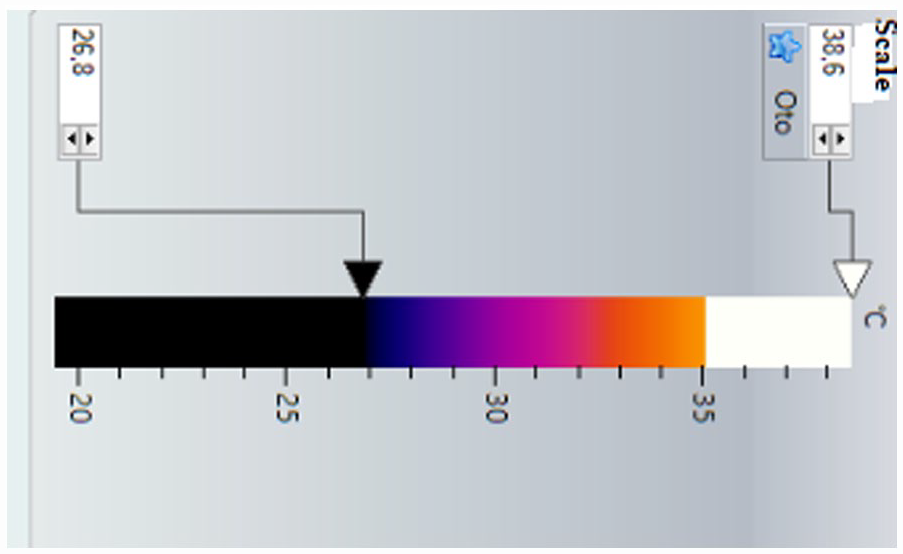
The temperature scale of thermal camera 28
Statistical analysis of the data logger measurements was performed using SPSS 23.0 programme. A two-factor (fabric type x duration) repeated measures analysis of variance (ANOVA) was used to analyse the effect of different fabric types and changes in duration for temperature measurements of the front and back surface temperatures of the tested garments. The effect of fibre type differences on the thermal camera front and back surface temperature values of the garments versus time was analysed using a two-factor ANOVA test. Post-hoc statistical tests were used to understand the relationship between the parameters when a difference was observed between the variables. These tests provide consistent and appropriate research approaches. Homogeneous variance characteristics and equality of sample size characteristics are important factors in the selection of post-hoc tests. For all statistical analyses, p < 0.05 was considered significant.
Results and discussion
Thermal manikin test results
Garments made of cotton and polyester fibres are preferred for use in wear trials because they are widely used in sportswear. Garment made from Tencel fibre was used in wear trials because of Tencel’s good thermal comfort properties such as air permeability, water vapour permeability, and moisture management.29,30 The mesh fabric structure was used in wear trials as it allows lower microclimate temperatures on the chest and back surfaces of the upper body.31–33 The T-shirt samples were tested with a Newton sweating thermal manikin in a controlled climatic chamber. The manikin measured the thermal and evaporative resistances of the garments in a stationary standing position with minimal air movement. The thermal resistance values of the garments are shown in Figure 3. The lowest thermal resistance was observed in the polyester mesh knitted garment (PM) owing to its high porosity. Because the mesh structure enables air movement in the climatic chamber. The thermal conductivity of cotton fibre is lower than Tencel fibre, 34 therefore the thermal resistance values were measured higher in cotton included CS and CPS coded garments.

The thermal resistance of garments.
The water vapour resistance of the garments is shown in Figure 4. The concepts of water vapour resistance and permeability are opposite to each other. Fabrics with high water vapour resistance have difficulty in removing excess sweat in the form of vapour from the body. The highest water vapour resistance value was observed for the cotton/polyester garment, which had the highest clo value (CPS). On the other hand, the lowest water vapour resistance value was seen in the polyester mesh garment (PM) which had the lowest clo value. It was observed that as the clo value increases, the water vapour resistance increases. The wearer feels more comfortable during exercise owing to the mesh structure of fabrics, which significantly increases the air circulation next to the skin. 31 So, it can be concluded that the polyester mesh garment (PM) is convenient for producing active sportswear owing to thermal manikin tests.
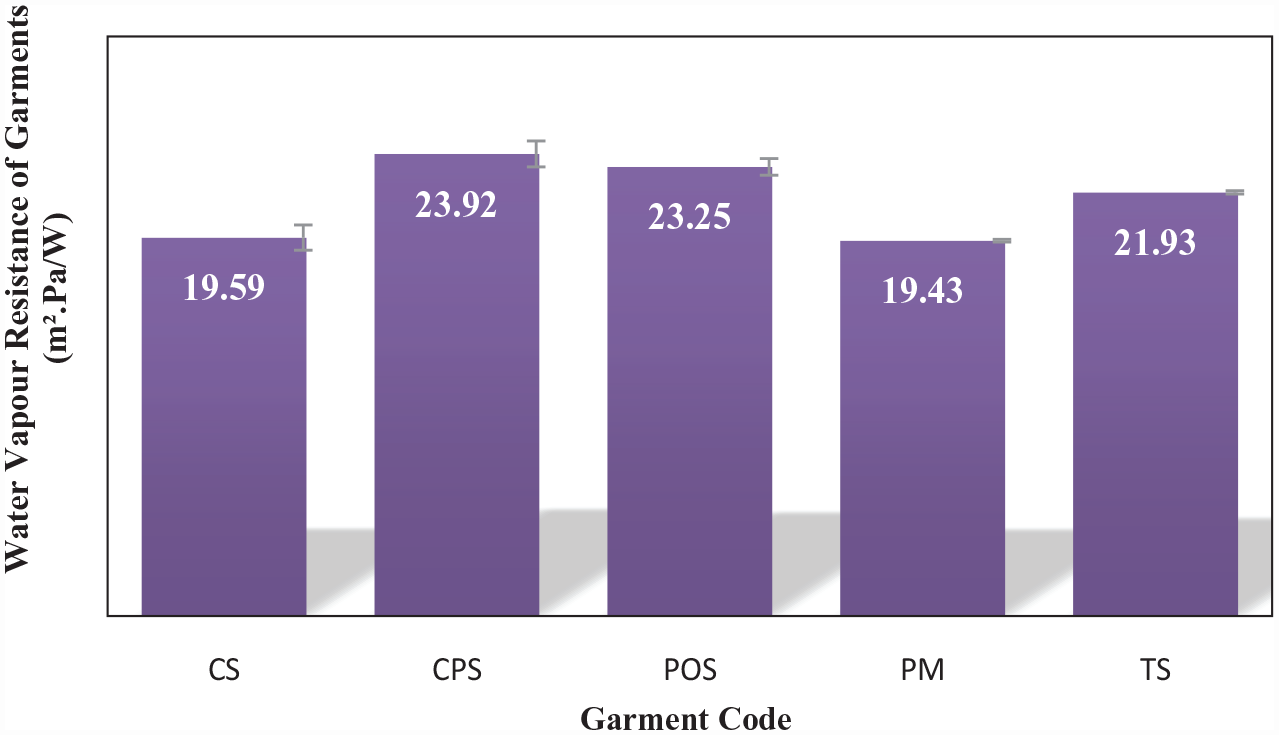
Water vapour resistance of garments.
Temperature sensor skin temperature and thermal camera garment surface temperature test results
Mean upper front body: Skin temperature and garment surface temperature
Exercise converts chemical energy into kinetic and thermal energy resulting in increased heat production. By measuring skin temperature, information regarding the thermal balance system of the body can be obtained. Thermal cameras, chemical thermometers, and temperature sensors can be used to measure skin temperature. Temperature sensors are one of the most common methods for measuring skin temperature. Nowadays, thermal imaging methods have begun to be used in skin temperature measurements.35,36 Thermal images of T-shirt samples in the front and back body sections were taken using a Testo Thermal Camera during a 50 min exercise period (Figure 5) to measure the garment surface temperature. Image analysis of the photographs was performed using Testo IRSoft thermal imager software. Using this programme, the hottest (maximum) point, coldest (minimum) point, point temperature, and image histogram were extracted from the photos. In addition, two temperature sensors connected to a datalogger were used for the upper front and back body skin temperature measurements during a 50 min exercise period.

Thermal camera software.
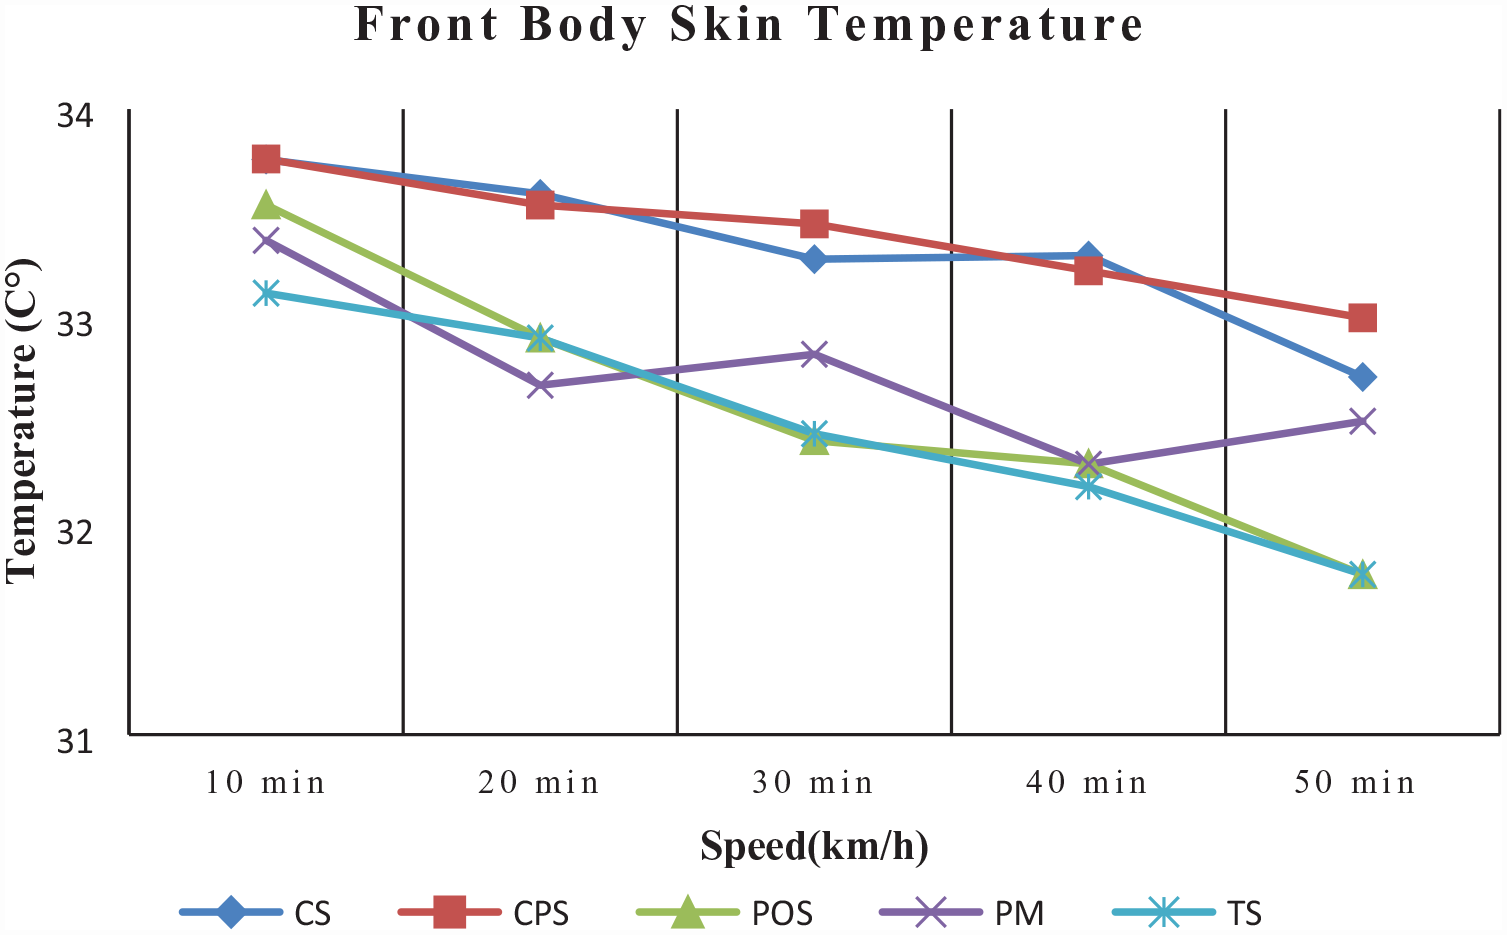
The mean of the upper front body skin temperature measurements of ten subjects obtained from the sensors are shown in Figure 6. The upper front body skin temperatures were in the range of 31.5°C to 34°C during the activity. It can be said that while the upper front body skin temperature showed the highest value at the beginning of the activity, there was a decrease in the upper front body skin temperature throughout the activity. The lowest skin temperatures were measured at the end of the activity period (except for the PM garment). The highest skin temperatures were measured in the cotton (CS) and cotton/polyester(CPS) garments throughout the activity. The lowest front skin temperatures were measured in polyester (POS) and Tencel (TS) garments at the end of the activity. It was seen that the polyester mesh garment (PM) keeps the skin temperature in the range of 32.3°C–33.3°C during the activity.
Mean temperature values of upper front body skin surface.
The mean of the front garment surface temperature measurements of ten subjects obtained from a thermal camera is shown in Figure 7. The mean of the upper front body garment surface temperatures was measured between 32°C and 35°C during all activity periods. It can be said that garment surface temperatures were measured at 0.5°C–1°C higher than the skin temperatures. The highest garment front surface temperature was measured from the highest clo value of the cotton/polyester garment (CPS) during the 20-minute activity level. In addition, the highest upper front skin and garment surface temperatures were measured for this garment at almost all activity levels. The lowest clo value, the polyester mesh garment (PM), showed the lowest garment front surface temperature values between the 10-30 minute activity levels. The upper front surface temperature of the Tencel garment, which had the lowest front skin temperature values, was measured at approximately 34°C at the beginning of the activity. However, it was lower than cotton included garments (CS and CPS) at the other activity levels. Similar to the front skin temperature, the lowest garment front surface temperature was measured by polyester garment (POS) at the end of the activity.

Mean temperature values of upper front body garment surface.
The upper front body garment surface temperature results were compared using SPSS 23.0, and a two-factor (Fabric Type x Duration) repeated measures analysis of variance (ANOVA) was used. The two-way ANOVA test results showed the significance of fabric type (p = 0.000 < 0.05), duration (p = 0.026 < 0.05), and fabric type x duration (p = 0.866 >0.05). The results also showed that there was a significant difference between the cotton garment (CS) and the other garments (except CPS) according to the post-hoc Bonferroni test results (Significance of POS p = 0.000 < 0.05, for PM p =0.000 < 0.05, for TS p = 0.034 < 0.05). Polyester garment (POS) showed statistically significant differences from cotton garment (p = 0.000) and cotton/polyester garment (p = 0.010). The polyester mesh garment showed statistically significant differences from the cotton (p = 0.000) and cotton/polyester garments (p = 0.016). In order to compare the sportswear with each other, the temperature values of the upper front body garment surface of a randomly selected athlete, among the athletes who performed the wear trial, were recorded throughout the activity (Table 2). Thermal image photos of the tested garments recorded for each activity segment were divided into 10, 20, 30, 40, and 50 min. Thus, it is possible to compare the highest (maximum) temperature, lowest (minimum) temperature, and average temperature values of the different garments in each time interval. The highest temperature (Min, Max, and Mean) values of the upper front body garment surface were seen in the cotton/polyester garment (CPS) for all periods (except 40 minutes), which supported ten subjects’ mean front skin temperature and garment front surface temperature measurements. The polyester mesh garment (PM) was measured with the lowest temperature values of (maximum and mean) the upper front body garment surface for 10-30 minute activity periods. The ten subjects’ average front garment surface temperatures were also lower in this activity section at this garment. In addition, sweating began gradually in the sections where the temperature shown in black on the histogram dropped below 27°C. It was observed that the ratio of the orange region (above 32°C) increased in the histogram graph during the 30 min activity period with the CPS-coded garment only. Therefore, it can be concluded that while the ratio of orange and purple regions in the histogram graphs decreased, the ratio of regions shown in black and dark blue increased owing to the sweat increase in this time period. The ratio of purple colour in the histogram graph was higher at the end of the activity than at the 40-minute level. Because the body temperature rises again as the activity continues after sweating as stated in previous studies. 37 It was concluded that the highest mean upper body front skin temperatures and mean upper body garment surface temperatures were measured in the cotton/polyester garment, which had high thermal and water vapour resistance values. This is because, as the insulation value (clo) of the clothing increases, the skin temperature increases, and it becomes more difficult to expel the excess heat generated during the activity. Consequently, the surface temperature of the garment was measured higher in thermal camera images.
The heat distribution histogram photos of the upper front body garment surface during all activity periods for selected athlete.

Mean upper back body: skin temperature and garment surface temperature
The mean of the upper back skin temperature measurements of ten subjects obtained from the sensors are shown in Figure 8. The upper back body skin temperatures were in the range of 32.5ºC–35°C during the activity. It can be said that while the upper back body skin temperature showed the highest value at the beginning of the activity, there was a decrease in the upper back body skin temperature after 20 min period. Similar to the upper front body, the highest skin temperatures were measured in the cotton (CS) and cotton/polyester (CPS) garments at the beginning of the activity. The back skin temperature was the highest with the cotton/polyester garment (CPS) at the end of the activity. Unlike the upper front body, the lowest skin temperature was measured in the cotton garment (CS) at the end of activity.

Mean temperature values of upper back body skin surface.
The mean of the back garment surface temperature measurements of the ten subjects obtained from the thermal camera is shown in Figure 9. When the upper front body and upper back body garment surface temperature differences were compared, the garment front surface varies between 32°C and 35°C, and the garment back surface varies between 33°C and 34.5°C. The temperatures on the garment front surface increased in the first 30 min, and this value increased in the last two parts of the activity (40-50 minutes) on the back surface. Similar to the upper front body, the cotton/polyester garment showed the highest back skin and back garment surface temperatures at the end of activity. Tencel garment (TS) showed higher temperature values than polyester garment (POS) and polyester mesh (PM) garments between 10 and 30 minute activity levels and showed close back garment surface temperatures with these garments at other activity levels. The highest back garment surface temperatures for almost all activity levels were measured from the cotton garment (CS), which had the lowest back skin temperature at the end of the activity.

Mean temperature values of upper back body garment surface.
The upper back body garment surface temperature results were compared using SPSS 23.0, and a two-factor (fabric type x duration) repeated measures analysis of variance (ANOVA) was used. The two-way ANOVA test results showed the significance of fabric type (p = 0.000 < 0.05), duration (p = 0.209>0.05), and fabric type x duration (p = 0.988 >0.05). Similar to the upper body front surface, the statistical results showed that polyester (POS) and polyester mesh (PM) garments were significantly different from cotton (CS) (p = 0.006 and p = 0.002, respectively) and cotton/polyester (CPS) garments (p =0.019 and p = 0.005, respectively). It was observed that garment back surface temperatures of polyester yarn produced garments (POS and PM) were lower than those of cotton yarn containing garments (CS and CPS). Similar to the front surface, CS and CPS coded garments with high clo measurement results had higher garment back surface temperatures than others in thermal camera measurements during activity. Because the thermal conductivity of cotton fibre (0.03 W/m. K) was lower than that of polyester fibre (0.10 W/m. K) 38 and fabric with a higher ratio of cotton in the exterior layer can provide better thermal resistance owing to the higher specific heat value of cotton than polyester. 39 Unlike the front surface, the cotton garment (CS) showed the lowest back skin temperature at the end of the activity.
The upper back body garment surface heat distribution histograms for randomly selected athlete during all activity periods are presented in Table 3. Similar to previous studies, the maximum temperature values of the upper back body garment surface were higher than those of the upper front body garment surface in almost all garments (Table 3). 40 The highest maximum values were measured in the cotton/polyester garment (CPS) during the first 30 min of activity. It was observed that sweating started in 20 minute period of time in the upper back body part as well as on the upper front body garment surface from the appearance of black colour from the histogram graphics. The lowest temperatures on the garment back surface were observed for the lowest clo value polyester mesh garment (PM) between 20-40 minutes. At the 40-minute activity level, the proportion of orange regions above 32°C increased again due to the continuation of the activity and the increase in speed. In this section, the ratio of purple (above 29°C–32°C) and orange (above 32°C) increased in the heat distribution histogram photos of the upper back body garment surface. It can be concluded that the upper back body garment surface temperature increased again because the activity continued at an increasing rate after sweating and evaporation. 33
The heat distribution histogram photos of upper back body garment surface during all activity periods for selected athlete.

Thermophysiological comfort provides the thermal balance of the body, depending on the heat and moisture transfer properties of the garment under different activity and climatic conditions. At thermal equilibrium, the heat produced by metabolism and the amount of heat released by the body to the external environment are equal. Because the human body expels excess heat into the external environment through sweating and evaporation under high activity and temperature conditions. IRT provides a tool for measuring the skin temperature of active athletes and provides field data about human thermoregulatory responses during athletic competitive events. 41 It can be said that the clothes that keep the body warmer cause an increase in temperature on the surface of the clothes. In addition, the upper body front and back garment surface temperatures of the thermal camera were higher for these garments. The highest thermal and water vapour resistance values of CPS coded garment showed the highest temperature values of the upper front and upper back body garment surfaces in almost all activity periods. In addition, this garment showed the highest skin temperature at the beginning and end of the activity in both front and back skin temperature measurements. The polyester mesh garment (PM) showed the lowest temperature values of the upper front and back body garment surfaces in almost all activity periods owing to its low thermal and water vapour resistance. In addition, this garment maintained the skin temperature within a certain range throughout the activity due to its mesh structure (32.3°C–33.3°C). It can be concluded that wearing synthetic garments next to skin provided better results than cotton included garments and kept the skin temperature at the desired values like previous studies. 16
Conclusions
In this study, wear trials of five garments made at 27°C ± 2°C temperature and 45.0±5% relative humidity conditions, and the thermal resistance and water vapour resistance of the garments were measured using a thermal manikin. The surface temperatures of the garments were measured with a thermal camera from the front and back surfaces of the upper body, and the skin temperatures of the athletes were measured from the front and back of the upper body with sensors. In addition, the histogram graphics obtained from the thermal camera photographs of the randomly selected athlete were compared with the thermal camera average temperatures obtained from ten subjects. The statistical analysis showed that the thermal camera garment surface temperatures of the polyester yarn produced garments on the upper front and back surfaces were statistically different from those of cotton-containing garments. Additionally, cotton-containing fabrics (CS and CPS) showed higher upper front and back garment surface temperatures at the beginning and end of the activity because of the high thermal manikin thermal and water vapour resistance results. In addition, the skin temperatures of these garments were highest at the beginning of the activity on the upper front and upper back; only the skin temperature of the cotton/polyester garment (CPS) was higher at the end of the activity. Because, the water vapour resistance value of the cotton/polyester garment was high, it was difficult for the athlete to sweat out and feel uncomfortable. Polyester mesh garment (PM) showed the lowest temperature values of the upper front and back body garment surfaces in almost all activity periods because of the low clo and water vapour resistance values of this garment. In addition, the PM garment maintained skin temperature within a certain range throughout the activity (32.3°C–33.3°C). Tencel garment showed similar temperatures with cotton included garments (CS and CPS) at the beginning of the activity, however it showed similar temperatures to those of polyester produced garments (POS and PM) at the end of the activity in the front and back thermal images. When wearing this garment, which had the second lowest clo value after PM, skin temperatures were lower in the upper front and upper back of the body at the beginning and end of the activity. As a result, it can be said that when the polyester mesh and Tencel garments were worn, the athlete felt more comfortable because there was not much increase in skin temperatures and garment surface temperatures during the activity.
Footnotes
Declaration of conflicting interests
The author(s) declared no potential conflicts of interest with respect to the research, authorship, and/or publication of this article.
Funding
The author(s) disclosed receipt of the following financial support for the research, authorship, and/or publication of this article: This work was supported by Uludag University (project number: BUAP (MH):2016/3).