
Abstract
Adsorption techniques are widely used to remove certain classes of pollutants from waters, especially those that are not easily biodegradable. The aim of this study was to evaluate the adsorption of Methylene Blue (MB) dye onto activated carbon from aqueous solutions was realized in a batch system. However, some examined factors such as contact time, pH solution, initial concentration of MB, adsorbent dosage and temperature were found to have significant impacts on the adsorption capacity of AC. The AC was characterized by BET surface area measurement, Point of Zero Charge (pHpzc), FTIR spectroscopy and X-ray diffraction analysis. Batch studies were conducted in order to determine the optimal parameters required to reach the adsorption equilibrium. The maximum adsorption capacity of the AC for MB at 298 K was determined to be 170.357 mg/g. The adsorption kinetic data were analyzed employing several kinetic models: pseudo-first order, pseudo-Second order, Elovich equation, and intraparticles diffusion model. It was established that the adsorption process obeyed the pseudo-second-order kinetic model with a determination coefficient (R2) equal to 0.999. The evaluation of thermodynamics parameters such as the Gibbs free energy ΔG° (−7.856 to −6.142 kJ/mol), positive enthalpy ΔH° (13.384 kJ/mol) and the change of entropy (63.46 J/mol K) indicated a spontaneous and endothermic nature of the reaction with a chemisorption process. Comparative tests by the heterogeneous photocatalysis of MB in the presence of a semiconductor will be the subject of the rest of this study.
Introduction
The dyes production plants are increasing by the day with the technological advancement. Colored waste waters are the result of extensive dyes production, they come mainly from the textile industries and cause hazards to the aquatic environment due to presence of acids, bases, toxic organic, inorganic, dissolved solids and color. In recent years, the quality of water in the world has deteriorated considerably because of uncontrolled industrial discharges, the intensive use of nitrogenous organic compounds, dyes in several areas and the disorderly exploitation of water resources. Among the nitrogenous organic compounds, the amino acids may be responsible for coloring the water, odors, bad taste and, moreover, they can contribute to the formation of many disinfection by-products during the chlorination of water potable. The effluents from the textile, leather, food processing, dyeing, cosmetics, paper, and dye manufacturing industries are important sources of pollution. 1 Many dyes and their break down products may be toxic for living organisms, particularly methylene blue (MB). 2 Therefore, the discoloration of dyes is an important aspect of the wastewater treatment before their discharge in the aquatic environment. It is difficult to remove the dyes from such effluents, because they are not readily degradable and are not removed generally from the sewage by conventional techniques. 3 The great visibility of dyes, even at trace concentrations, is generally related to less-dissolved oxygen in aquatic habitats, decreasing the penetration of sunlight along with photosynthetic activities. In this way, ecological harm may spread downstream to agricultural or aquaculture regions, affecting aquatic flora and fauna. It is, therefore, obligatory for some places to exercise proper treatment before the disposal of such wastewater. 4 MB products include a group of dye compounds which have many uses, namely, biological staining, dermatological agent, veterinary medicine, and inhibitor. Global demand for coatings and paints is predicted to rise 3.7% per year to 54.7 million metric tons in 2020. The growing consumer demand for dye compounds in various end-use segments is projected to act as a major growth factor for the global market over the following few years. MB, a widely used dye, travels to incorporate itself in aquatic systems (highly soluble, 50 g/L) and in the atmosphere. It has many uses, for example, dermatological agent, biological stain, veterinary medicine, to inhibit mold propagation in poultry feed, fungus, and intestinal parasites. 5 MB dye is toxic when injected into humans and animals. Common harmful effects of MB on humans are irritation to the gastrointestinal tract with long-term exposure resulting in organ damage.6,7 Activated carbon is a versatile adsorbent which has been used widely for the adsorption process, but remains relatively expensive. Consequently, many authors have studied the feasibility of low cost and abundantly available substances that are used for the synthesis of activated carbon. This has prompted a growing research interest in the production of activated carbons from renewable and cheaper precursors which are mainly industrial and agricultural byproducts, for the wastewater treatment. However, the activated carbons available in the commerce are relatively expensive and their production and regeneration constitute limiting factors. Hence, many researchers have focused on the search on new low-cost precursors issued from agricultural wastes such as oil palm biomass, 8 date palm, 9 olive stones, 10 sawdust,11,12 rice husk, 13 apricot stone,14,15 clean laccase, 16 cationic polymeric, 17 core-shell magnetic, 18 titania nanoparticle, 19 and modification of activated carbon. 20 The remarkable adsorption capacity of activated carbons is due to their well-developed porous structure and pore size distribution, as well as the surface functional groups. For this purpose, we carried out a parametric study of the adsorption, by studying the effect of several significant parameters on the decolorizing power of the material used particularly the contact time, the concentration of the adsorbent, the pH, and temperature. The objectives of this study are summarized below.
Contribution for the conservation of the natural environment.
Valorization of activated carbon for the elimination of organic pollutants in static mode.
Elaboration of adsorbents at low economic cost comparable to activated carbons.
Valorization of the low cost adsorption method compared to other methods in water treatment.
Possibility of switching from static mode (at the laboratory scale) to dynamic mode (column mode) at the industrial scale.
Provide theoretical models for the simulation of the phenomenon.
Regeneration of adsorbent for other uses.
Materials and methods
The spectrophotometer is a technique which owes its development to progress in the quantum mechanics allowing, among other things, to identify a chemical substance and to determine the concentration of a solute in solution, by using the Beer-Lambert’s law where the absorbance (A). Ten millimeter quartz cell was used and the reproducibility is 0.1 nm. Two light sources were used: a visible tungsten halogen and UV deuterium lamps; the scanning speed was set at 1200 nm/min. The blanks were carried out in a quartz cell identical to the previous one with ultra pure water. Measurements of the residual concentrations were obtained by linear interpolation using a previously calibration graph.
The pH of the solutions was accurately measured using a microprocessor-based pH meter of the HANNA HI 8521 type. The instrument was calibrated with commercial buffers of pH 4, pH 7, and pH 10. The pH was adjusted to by using H2SO4 and NaOH respectively for acidic and basic media.
Materials
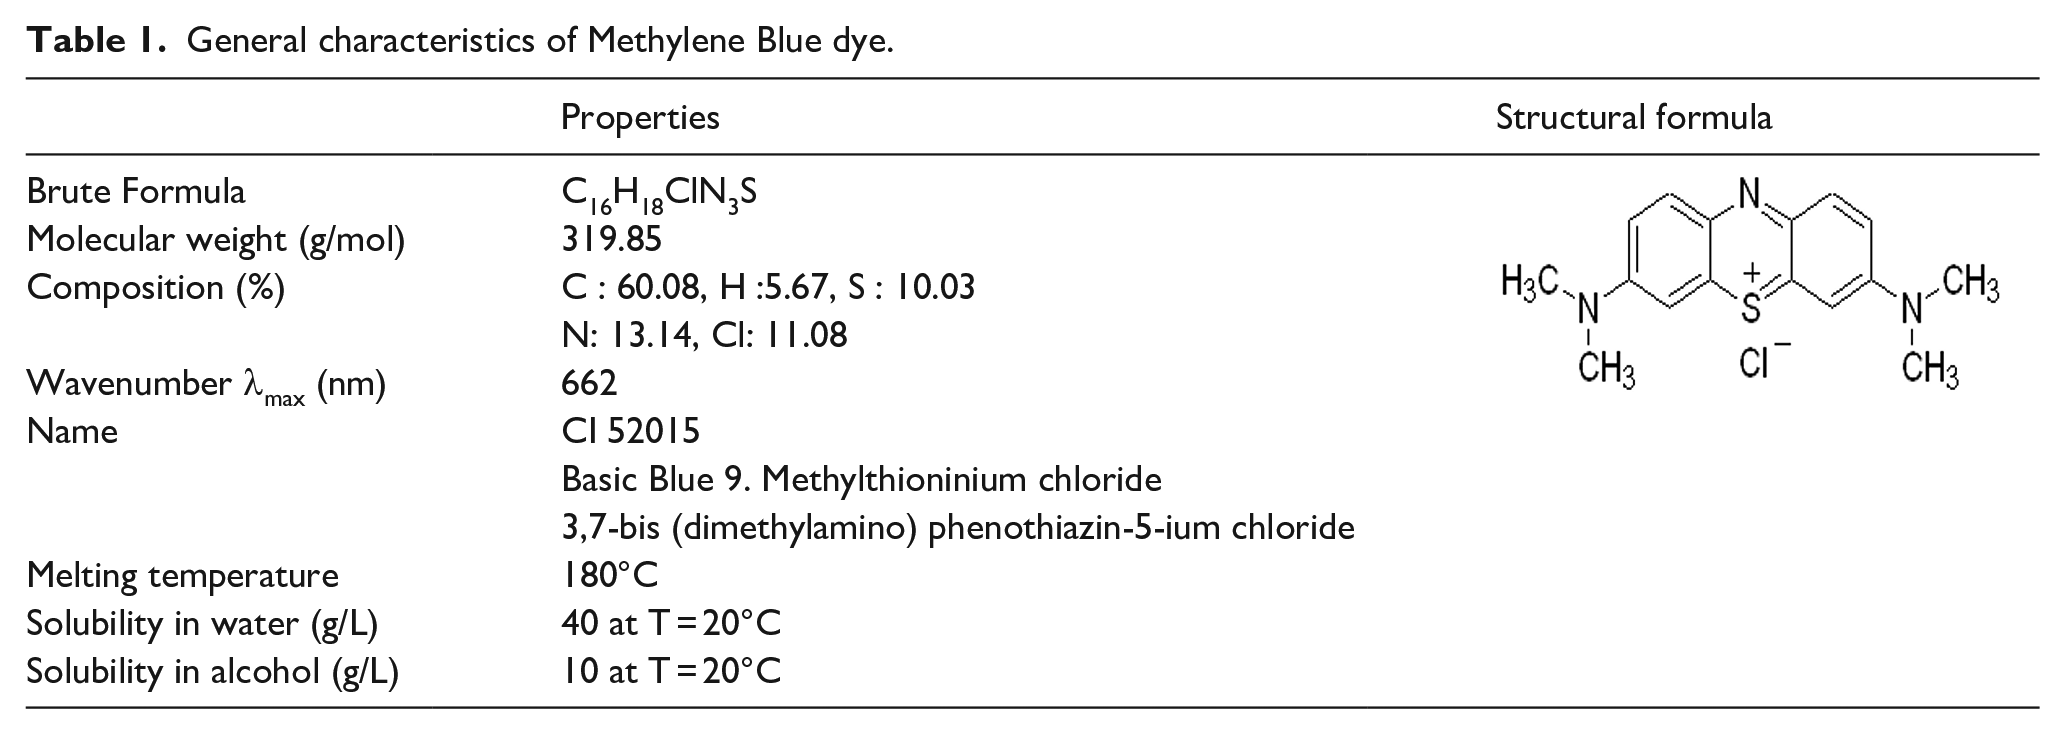
The adsorbent used in this study is a commercial activated carbon.21 –23 Then they were ground to have particles smaller than 50 mesh, and placed in brown bottles for future use. The Methylene blue MB of chemical formula C16H18ClN3S whose molecular weight is 319.852 g/mol is provided by Merck Company (purity 99.998%) and the absorbance peaks at at λmax of 662 nm. IUPAC Name [7-(dimethylamino) phenothiazin-3-ylidene]-dimethylazanium; chloride. Chemical structure and properties of the Methylene blue are given in Table 1. Dye stock solutions were prepared at 1000 mg/L concentrations by dissolving dye powders at required amounts in distilled water. By diluting the dye stock solutions with distilled water, the solutions at required concentration were adjusted for adsorption experiments.
General characteristics of Methylene Blue dye.
Characterization of activated carbon
Nitrogen (N2) adsorption–desorption experiments were performed at liquid nitrogen temperature by means of Micromeritics Tri Star II 3020. To remove volatile contaminations, degassing processes were completed for EACs at 90°C for 0.5 h and immediately after, at 300°C for 2 h under vacuum before measurements. By using the Brunauer–Emmett–Teller (BET) method, specific surface areas were determined, and total pore volumes were calculated through nitrogen adsorption at P/P0 = 0.984.
The Fourier Transform Infrared spectroscopy (FTIR) is used to identify the characteristic functional groups of AC. Five milligram of AC are mixed with dry KBr of spectroscopy quality and pressed under a pressure of 4500 psi to form thin disk. Then, the FTIR spectrum was plotted with a Perkin Elmer 2000 infrared spectrometer. The sample was scanned from 4000 to 400/cm for 16 times to increase the signal to noise ratio.
The X-ray diffraction (XRD) pattern of the activated AC are obtained with a Philips X-ray diffractometer (PW 1890 model) 40 kV, 40 mA, λ = 1.54 Å. The patterns are obtained with CONIT T-2T scan mode at 0.17 °/step of step width and 8°/min of scan speed.
The determination of the point of zero charge (pHPZC) was conducted to investigate how the surface charge of (AC) adsorbent depends on pH. pHPZC of the activated carbon was determined using the procedure described elsewhere. 24 0.01M of NaCl was prepared and the initial pH was adjusted between 2 and 12 using HCl or NaOH solution (0.1M). Fifty milliliter of NaCl solution was placed in Erlenmeyer flakes with 0.1 g of adsorbent. The flasks were kept under agitation (150 rpm, 48 h), and the final pH of the solution was measured. The intersection point of the curves pHfinal versus pHinitial and the bisector was taken as pHPZC.
Adsorption experiments
The adsorption experiments were performed with batch method. In batch adsorption studies, the dye solutions at the desired concentrations were adjusted from dye stock solutions through dilution with water, and placed in Erlenmeyer flasks. After that, adsorbent were put in the Erlenmeyer flasks. They were located into a shaker with thermostat controlled (Wise Bath) and shaken at 250 r/min till adsorption equilibrium was reached at desired temperature. Samples were then centrifuged for 20 min at 4000 r/min to set apart their solid phases from liquid phases, and their remaining dye amounts without adsorbed in solutions were detected using a UV–visible spectrophotometry (Mecasys Optizen POP Series) at 662 nm wavelength for, Using the above method, adsorption experiments were performed to assess the effects of concentration AC (0.0125–0.125 g/50 mL), initial MB dye concentration (200–500 mg/L), and temperature (25–45°C). The amount of MB (mg/g) adsorbed by (AC)qt was calculated from the relation:
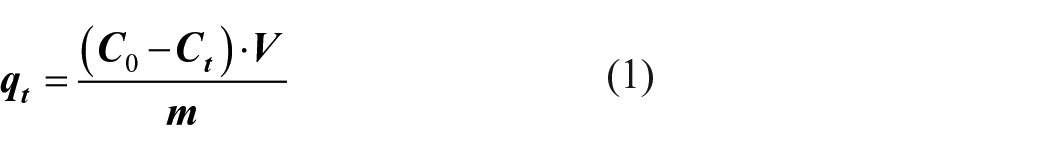
Where Co is the initial MB concentration and Ct the MB concentrations (mg/L) at any time, V the volume of solution (L), and m the mass of AC (g).
Results and discussion
Adsorbent characterization
BET surface area and pore size
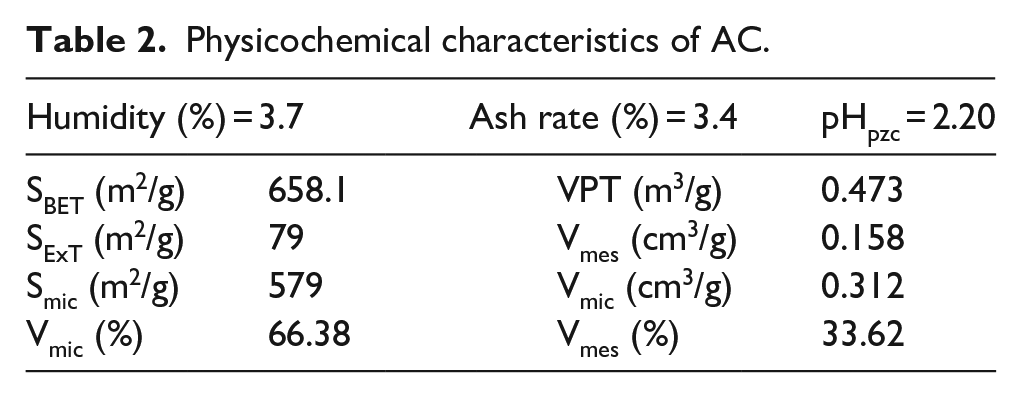
The specific surface area was determined by the BET equation. The external surface area, micropore area and micropore volume were calculated by the t-plot method. The total pore volume was evaluated from the liquid volume of N2 at high relative pressure near unity 0.99. The mesopore volume was calculated by subtracting the micro-pore volume from the total volume. The pore size distribution (PSD) was determined using the density functional theory (DFT) model. All characteristics for the adsorbent (AC) are reported in Table 2. 25
Physicochemical characteristics of AC.
FTIR spectrum analysis
In Figure 1(a), the small band around 1700/cm is attributed to the stretching vibrations of the C = O groups (cetones, aldehydes, lactones or carboxylic groups), the spectra also show a band at 1650–1600/cm due to the vibrations of elongation of C = C bonds in the olefin structure, the bands between 1000 and 1350/cm are assigned to the vibrations of CO bonds. 22 We observe a small decrease in the intensity of the peaks 1740/cm of the synthesized materials and disappearance of the others at 2920/cm due to carbonization.
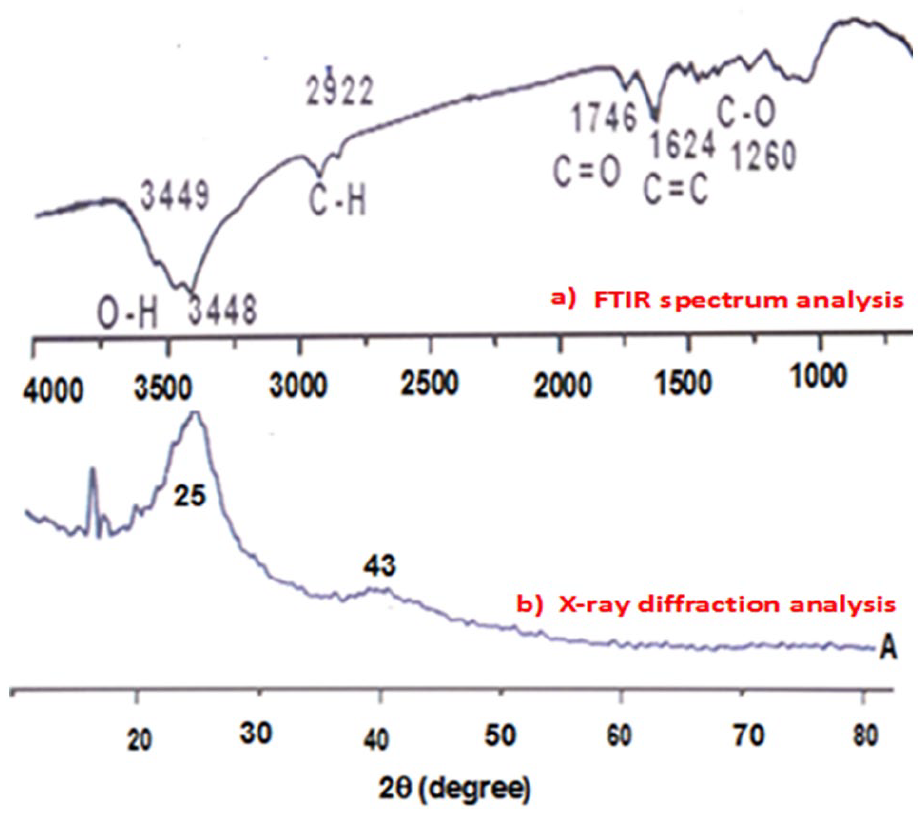
(a) FTIR spectrum analysis and (b) X-ray diffraction analysis.
X-ray diffraction analysis
Figure 1(b) generally shows an amorphous structure of all the materials and a low crystalline of the samples in the range from 10° to 43°. For the raw material, the diffraction diagram has a peak at 22° which is attributed to the presence of native cellulose. The diffraction pattern of activated carbon, show almost the same shape and have the same diffraction peaks at 25° and 43° which are attributed respectively to the presence of carbon/graphite and dehydrated hemicelluloses. On the other hand we note that after activation of the raw materials, the main peak moves from 22° to 25° and the appearance of a peak at 43°, which shows that the activation process has been successfully completed.
Influence of analytical parameters
Influence of the contact time and initial concentration on the adsorption capacity
The adsorption capacity of MB increases over time to reach a maximum after 60 min of contact time and thereafter tends toward a constant value indicating that no more MB ions are further removed from the solution. The equilibrium times averages 45 min but for practical reasons the adsorption experiments are run up to 60 min. With raising the initial MB adsorbed increases to at pH 4 (Figure 2) for the range concentration (50–200 mg/L) respectively and from these results, we can deduce that the adsorption of MB onto AC is done in three stages:
i) Adsorption is rapid during the first minutes of the reaction; this can be interpreted by the fact that at the start of adsorption, the number of active sites available on the surface of the adsorbent is much greater than that of the sites remaining after some time. 26
ii) For the high contact times the molecule needs time to diffuse inside the pore of the adsorbent. 27
iii) For the rest of the quantity not adsorbed is interpreted by the saturation of the surface of the adsorbent (all adsorption sites are occupied).
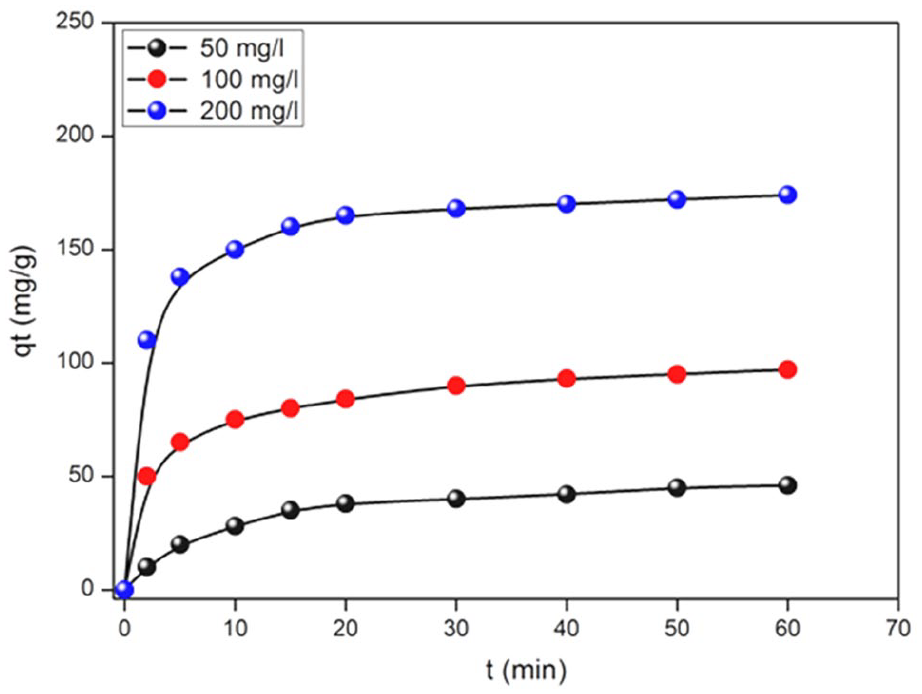
Evolution of the adsorption of MB dye onto AC as a function of time and concentration.
Influence of pH on adsorption capacity
To study the influence of pH on the adsorption of MB by unaccompanied minors and using 50 mL of the dye of concentration 100 mg/L for different pH, a temperature 25°C and a contact time of 60 min, the quantity of carbon active ingredient used is 50 mg. It is observed that the percentage of MB removal increasing consistently with increasing pH (Figure 3). The pH effect on the MB adsorption onto AC can be explained from the zero point charge (pHpzc), the surface functions of the material have a significant influence on the adsorption performance. 28 The basic or acidic nature of the adsorbent surface governs its retention capacity vis-à-vis to the pollutant. However, the character and chemical properties of adsorbent are directly linked to the nature of the functional groups located on its surface. The surface charge of the adsorbent, resulting from the acid-base equilibrium, depends on both the pH and ionic strength of the solution with which the material is in contact. This charge can be positive or negative depending on the environmental conditions.
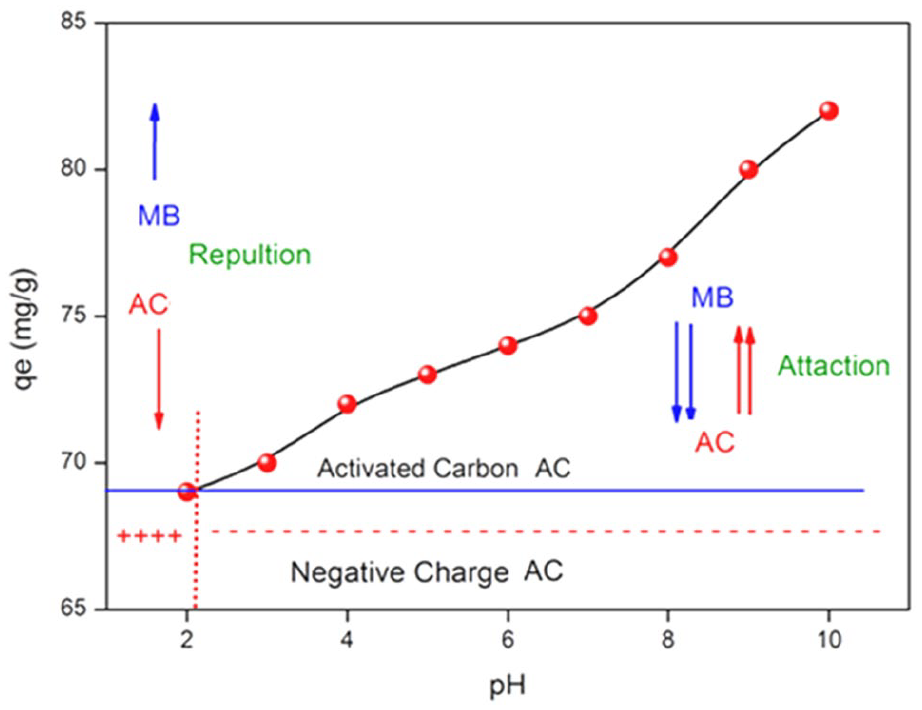
Evolution of the adsorption of MB dye onto AC as a function of pH.
Therefore, an important feature of the surface is the determination of pHpzc (=2.20) by drift method which defines the pH for which the surface charge, linked to the exchange of protons, cancels out; pHpzc characterizes the acidity or alkalinity of the surface. Below pHpzc, the surface charge is positive (acidity) where oxygen groups are in the cationic form, which converts to negative above pHpzc (alkalinity) and tends to decrease when the oxygen content increases. For basic pH, the adsorption capacity of MB decreases when the pH increases, resulting from repulsive electrostatic forces between the adsorbent/pollutant with the same charges.
Effect of the adsorbent dose
The first stage of batch experiments on MB and the effect of adsorbent dose on the AC adsorption are examined. Significant variations in the uptake capacity and removal efficiency are observed at different adsorbent dose (1–6 g/L), indicating that the best adsorption is obtained with a dose of 1 g/L (Figure 4). This result was subsequently used in all isotherms adsorption experiments.
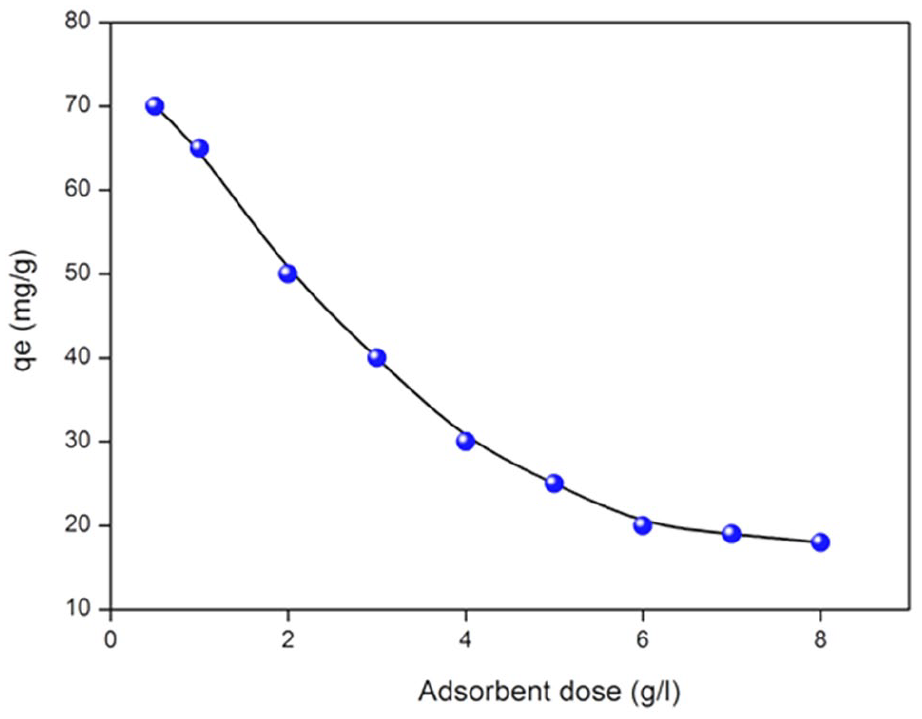
Evolution of the adsorption of MB dye onto AC as a function of adsorbent dosage.
Adsorption kinetic study
The kinetic study is important since it describes the uptake rate of adsorbate, and controls the residual time of the whole process. Several models were proposed to study the mechanisms controlling the adsorption. The pseudo-first order equation 29 and pseudo second order model 30 are given in equations:
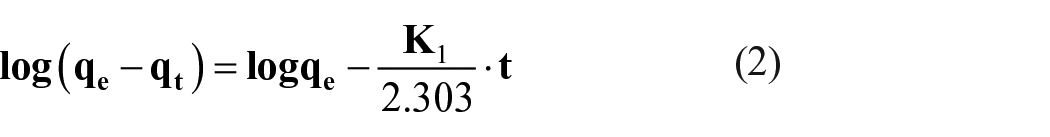
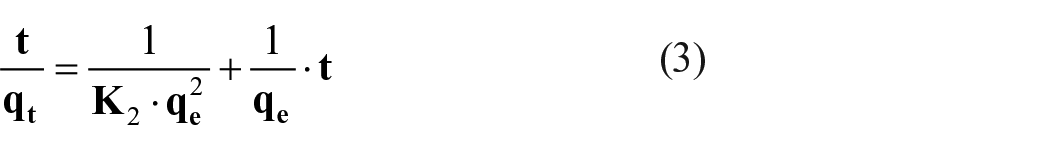
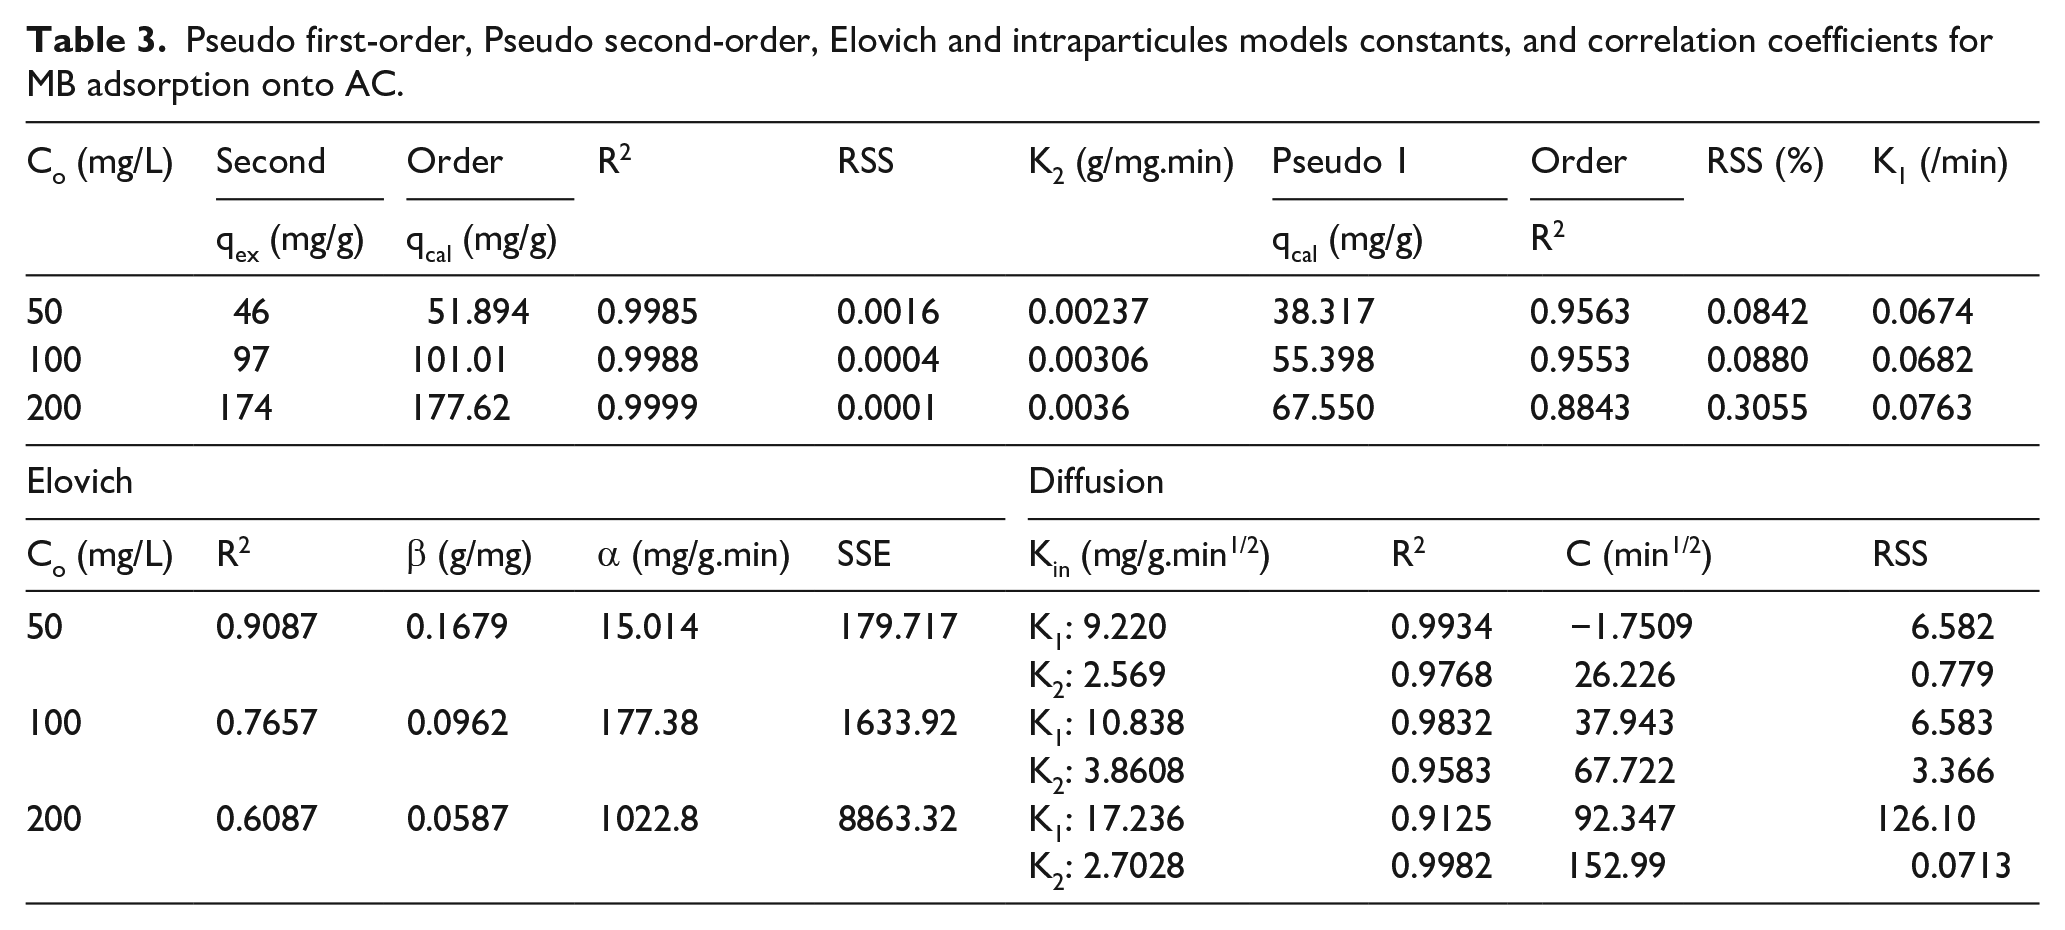
Where qt (mg/g) is the amount of MB adsorbed on AC at the time t (min). K1 (/min) and K2 (g/mg.min) are the pseudo-first order and pseudo-second order kinetics constants respectively. The slope and intercept of the plots ln(qe − qt) versus t and t/qe versus t were used to determine the first-order rate constants K1 and qe and second-order rate constants K2 and qe respectively. The rate constants, predict the uptakes and the corresponding correlation coefficients for AC summarized in Table 3. For the pseudo-first-order kinetic, the experimental data deviate from linearity, as evidenced from the low values of qe and Co and the model is inapplicable for the present system. By contrast, the correlation coefficient and qe,cal determined from the pseudo-second order kinetic model agree with the experimental data (Figure 5) and its applicability suggests that the adsorption MB onto AC is based on chemical reaction (chemisorption), involving an exchange of electrons between adsorbent and adsorbate. The dye is attached to the adsorbent surface by chemical bond and tends to find sites that maximize their coordination number with the surface.
Pseudo first-order, Pseudo second-order, Elovich and intraparticules models constants, and correlation coefficients for MB adsorption onto AC.
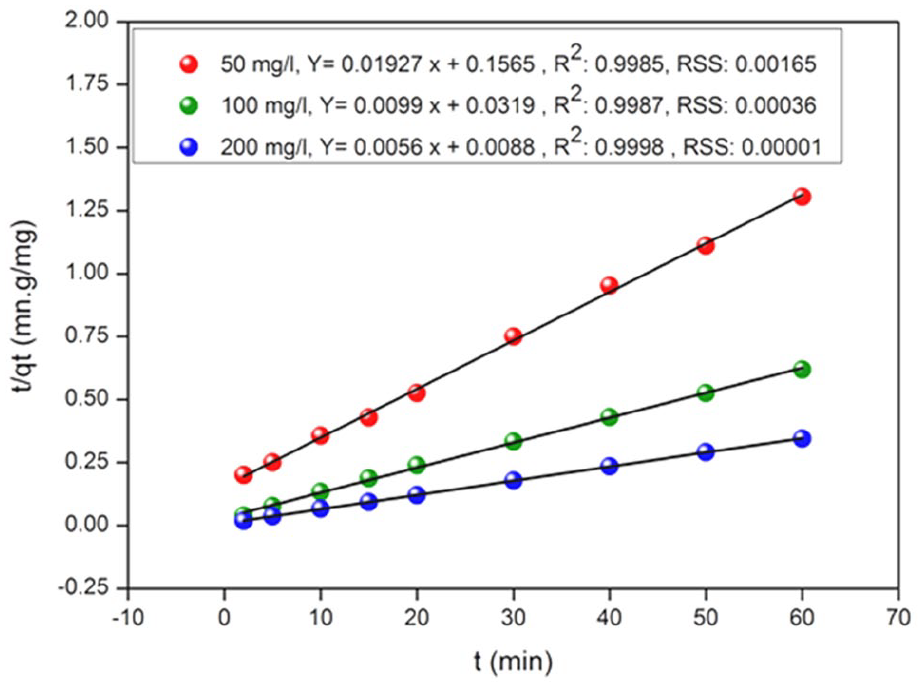
Pseudo-second-order model fit for the adsorption of MB dye onto AC.
The Elovich kinetic equation is related to the chemisorptions process and is often validated for systems where the surface of the adsorbent is heterogeneous 31 ; the linear form is given by:
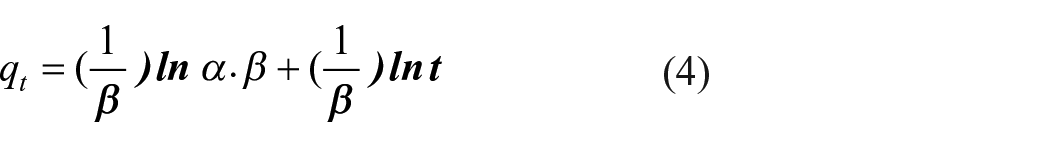
Where α (mg/g.min) is the initial adsorption rate, and β (mg/g) the relationship between the degree of surface coverage and the activation energy involved in the chemisorption.
Intra-particle diffusion equation
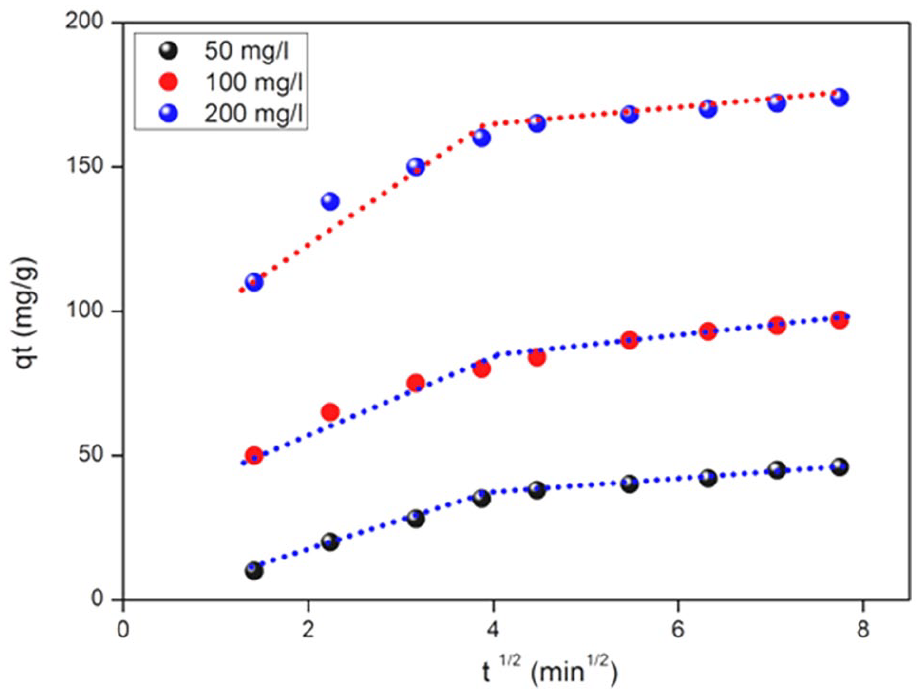
The study of adsorption kinetics is important because the rate of adsorption (which is one of the criteria for determining the efficiency of an adsorbent) and the mechanism of adsorption can both be concluded from kinetic studies. As a standard parameter for studying the behavior of BG dye adsorption at the AC surface is obtained using the Mories-Weber and Morris equation 32 :

Where Kid is the intra-particle diffusion rate constant (mg/g.min1/2), qt the amount of MB adsorbed at time t and C (mg/g) the intercept. A plot of qt versus t1/2 enables to determine both Kin and C. Figure 6 present a multi-linearity correlation, which indicates that two steps occur during the MB adsorption. The Morris-Weber model reveals an initial linear portion which may be due to the boundary layer effect and a second portion which may be due to the intraparticle diffusion effect. The mechanism of adsorption is complex but the intraparticle diffusion is important in the early stages. The first linear portions could be due to intra-particle diffusion effects. The slopes of the linear parts are defined as rate parameters, characteristic of the adsorption rate in the region where the intraparticle diffusion occurs. Initially and within a short-time period, it is postulated that MB is transported to the Adsorbent external surface through the film diffusion with a high rate. After saturation of the surface, the MB ions enter inside Adsorbent by intra-particle diffusion through the pores and internal surface diffusion until equilibrium is reached which is represented by the second straight lines. The constants of the different models deduced after modeling are grouped in Table 3. The principle of the adsorption process can be summarized into the following four steps
Transfer of the pollutant from the external layer to the internal (very quick step).
Displacement of the bound pollutant until contact with the adsorbent (quick step).
Diffusion in the adsorbent under a concentration gradient (slow step).
Adsorption in a micro pore (very fast step).
Intra-particle diffusion model for the adsorption of MB dye onto AC.
Adsorption equilibrium isotherms
To assess the performance of adsorbent, different equations and isotherms exist, out of which the Langmuir, 33 Freundlich, 34 Temkin and Pyzhev, 35 and Elovich 36 isotherms were used that have been presented in Figure 7. Besides, the isotherm models were applied at optimal conditions of the parameters.
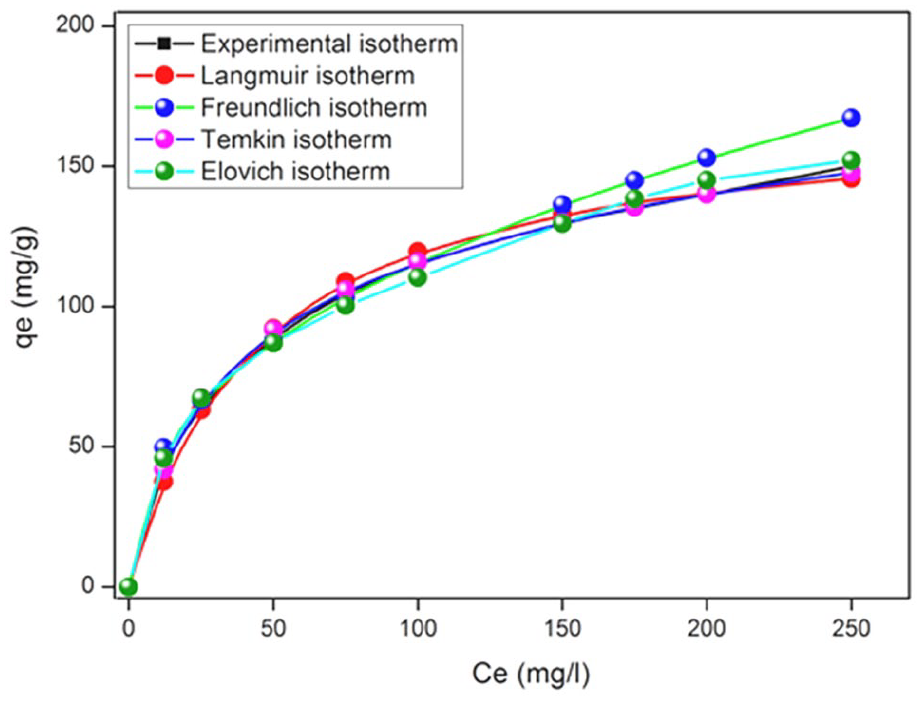
Isotherm models in the optimum conditions.
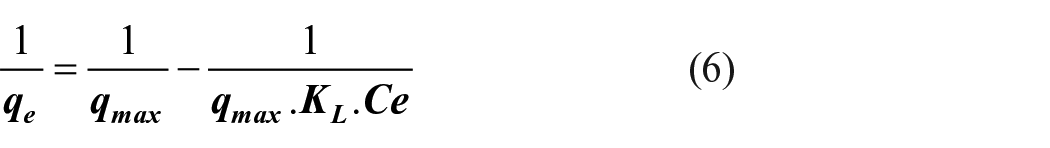
Where Ce is the equilibrium concentration (mg/L), qmax the monolayer adsorption capacity (mg/g) and KL the constant related to the free adsorption energy (L/mg). The applicability to the adsorption is compared by evaluating the statistic RSS, R 2 values at 25°C. The smaller RSS values obtained for the models indicate a better fitting. The essential features of the Langmuir
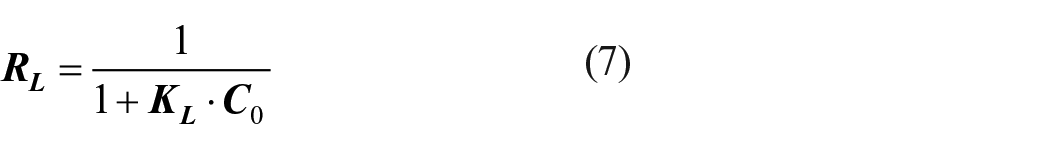
Co is the initial concentration of the adsorbate in solution. The RL indicates the type of isotherm: Irreversible (RL = 0), Favorable (0 < RL < 1), Linear (RL = 1), or Un (RL > 1). In this study, the RL values are smaller than 1, thus confirming that the adsorption is favored in both cases as well as the applicability of the Langmuir isotherm.
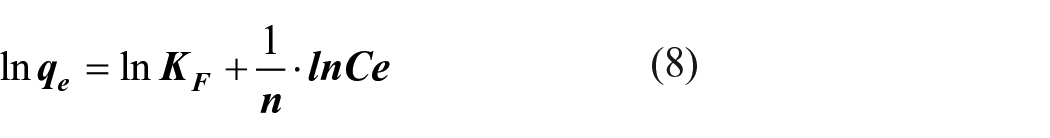
The constant KF characterizes the adsorption capacity of the adsorbent (L/g) and n an empirical constant related to the magnitude of the adsorption driving force. Therefore, a plot lnqe versus lnCe enables the determination of both the constant KF and n.

The adsorption data are analyzed according to equation (8). Therefore, the plot versus qe versus lnCe enables to determine the constants AT and BT.
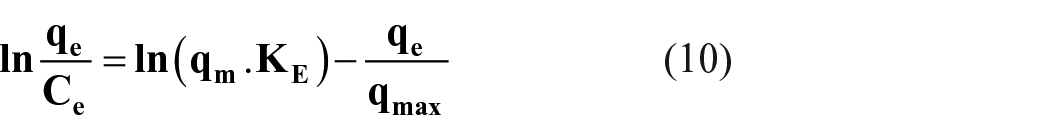
Where KE (L/mg) is the Elovich constant at equilibrium, qmax (mg/g) the maximum adsorption capacity, qe (mg/g) the adsorption capacity at equilibrium and Ce (g/L) the concentration of the adsorbate at equilibrium. Both the equilibrium constant and maximum capacity are calculated from the plot of ln(qe/Ce) versus qe . The constants of the different models deduced after modeling are grouped in Table 4.
Parameters of the adsorption isotherms for MB dye onto AC.
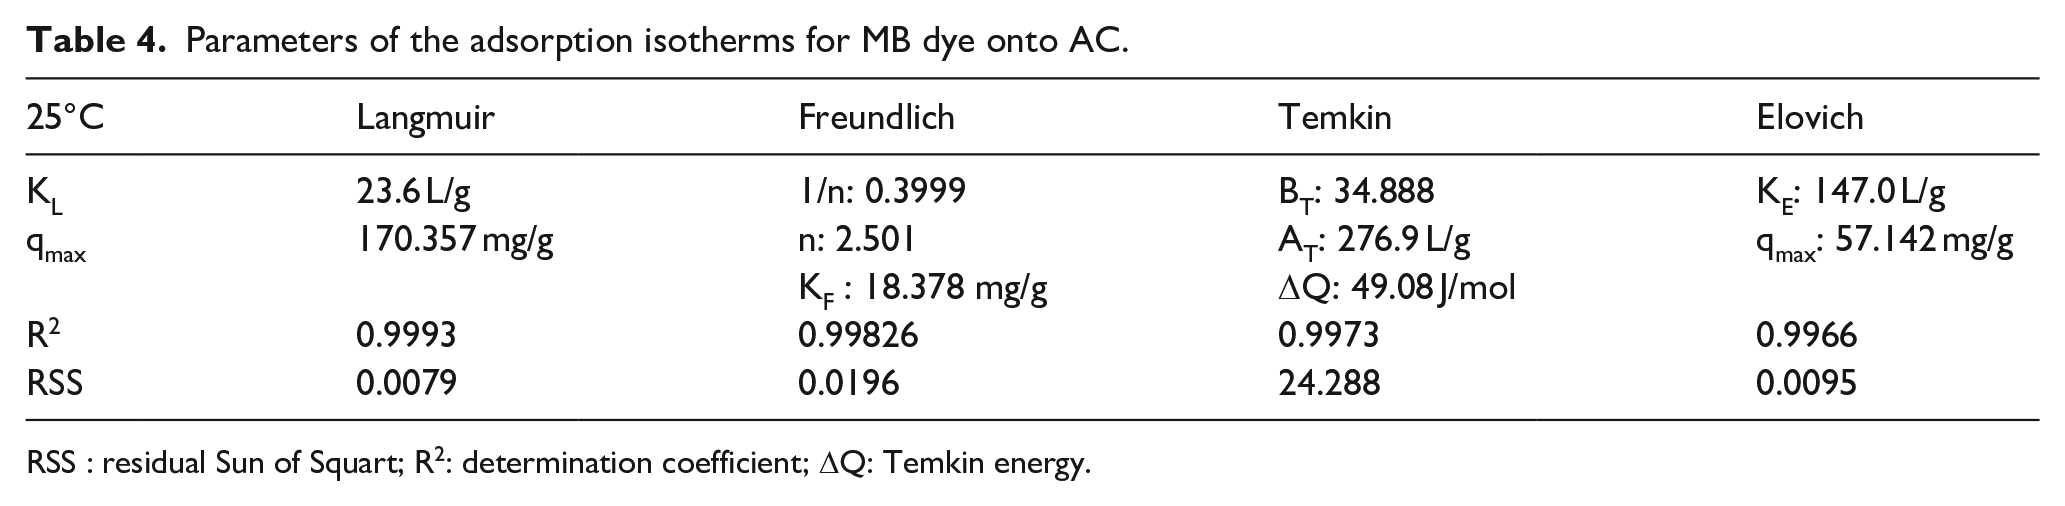
RSS : residual Sun of Squart; R 2 : determination coefficient; ΔQ: Temkin energy.
Thermodynamic study
The thermodynamic properties were investigated to determine whether the adsorption process occurred spontaneously. The thermodynamic parameters, namely, Standard enthalpy (ΔH°, kJ/mol), standard entropy (ΔS°, J/mol K), and standard free energy (ΔG°, kJ/mol), were calculated using the following equations 7 :


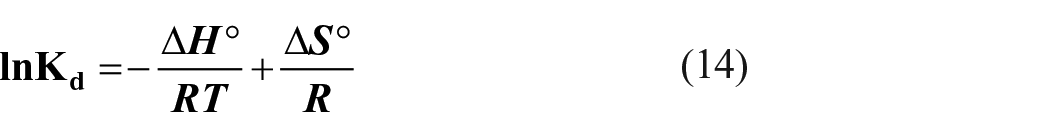
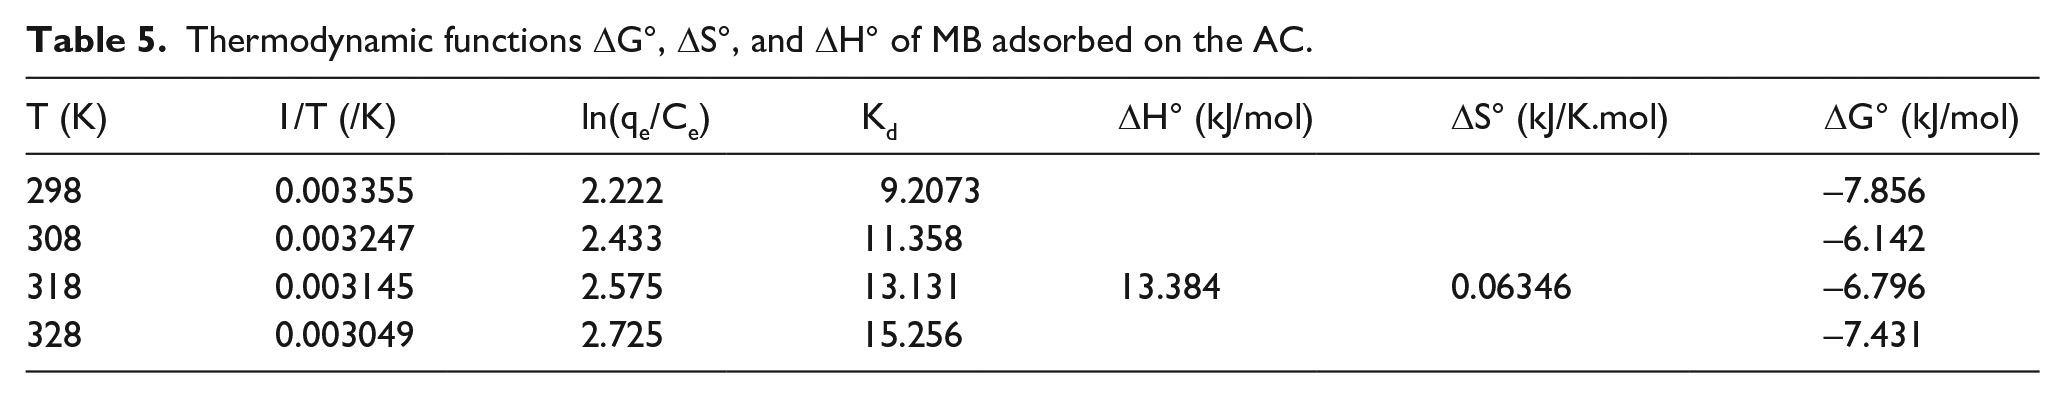
Where R is the gas constant (8.314 J/mol K), T (K) is temperature where Kd is the distribution coefficient, qe (mg/g) is the quantity of BG adsorbed at equilibrium and Ce (mg/L) is the quantity of MB remaining in solution at equilibrium. The thermodynamic equilibrium constant Kd for the sorption was determined by plotting qe/Ce versus Ce and extrapolating to zero Ce. The ΔH° and ΔS° values obtained from the slope and intercept of Von’t Hoff plots of lnK versus 1/T (Figure 8) and the ΔG values at various temperatures are summarized in Table 5.
Thermodynamic functions ΔG°, ΔS°, and ΔH° of MB adsorbed on the AC.
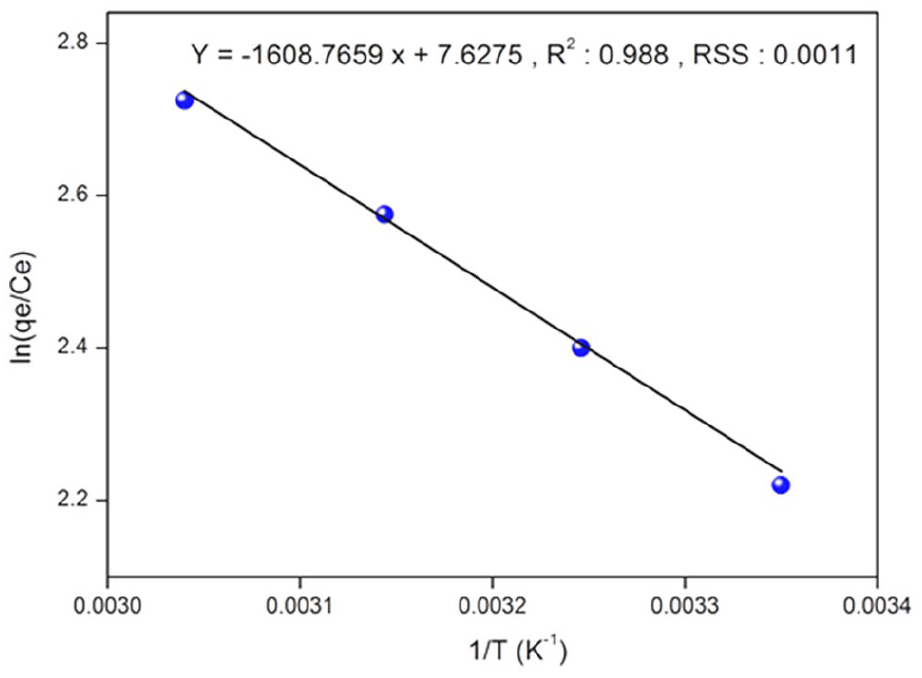
Regression of Van’t Hoff for thermodynamic parameters of MB adsorption on AC.
Performance of the activated carbon
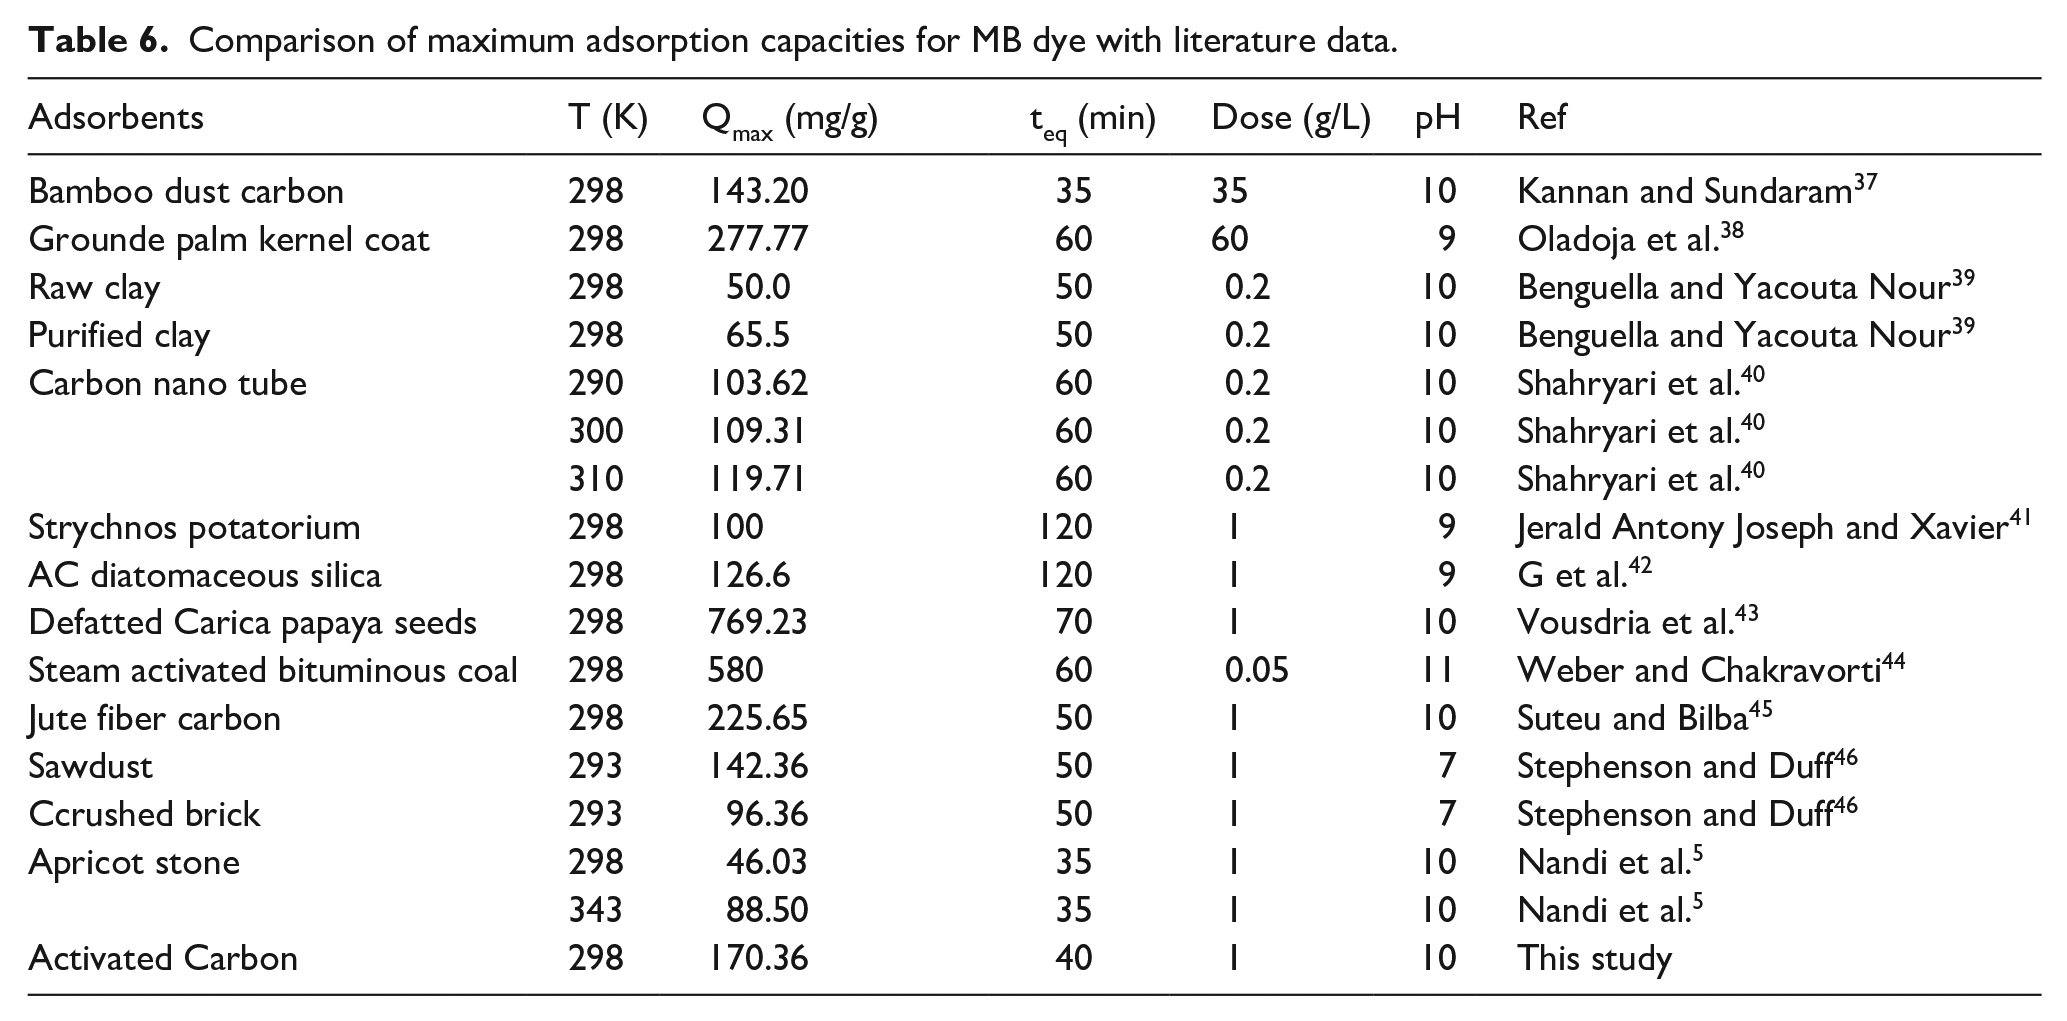
It is instructive for a comparative goal to report the adsorption capacity of some adsorbents reported in the literature. In Table 6, it’s given the different values of the Langmuir maximum adsorption capacity qm of different adsorbent cited in previous works. We can see that the MB adsorption observed in the present study is well positioned with respect to other researches with a maximum adsorption capacity qm of 170.357 at 298 K, relatively interesting compared to other adsorbents. The differences of the dye uptakes are due to the properties of each adsorbent like the structure, the functional groups and the surface area. AC could be an attractive adsorbent for basic dyes owing to the isoelectric point (pHpzc). The desorption is an unavoidable process and is an intermediate stage toward the adsorbent regeneration. The latter is an essential tool to estimate the reutilization of any adsorbent for industrial applications, owing to the ecological concerns and to needs for sustainable development.
Comparison of maximum adsorption capacities for MB dye with literature data.
Regeneration of the adsorbent
Desorption is an inevitable process of adsorption and is an intermediate step toward regeneration. The latter is an essential tool to assess the reuse of any adsorbent for industrial applications, due to ecological concerns and sustainable development needs. For the regeneration of the adsorbent, we opted for chemical regeneration because of its low economic cost. MB desorption of activated carbon was evaluated using three organic solvents methanol, ethanol and acetic acid. The desorption experiments were carried out after adsorption of a MB solution of: 100 mg/L and at a temperature of 25°C, the activated carbon was separated from the solution by centrifugation and dehydrated at 40°C for 6 h. The figure shows that only 4.9 and 5% were desorbed using pure ethanol and methanol respectively. On the contrary, with acetic acid, the desorption increased from 0.5% for a concentration of 1 mol/L to 94% for a concentration of 10 mol/L. Three desorption cycles with desorption percentages of 94.91 and 89% were obtained respectively with acetic acid more than methanol and ethanol.
Conclusion
In this work, an experimental study on the utilization of Activated Carbon (AC) for the removal of Methylene Blue from aqueous solution was investigated. The following conclusions were made based on the results of the present study:
The (AC) was characterizing d by Fourier transform infrared spectroscopy (FTIR), X-ray diffraction analysis (XRD), and BET techniques. The potential of this adsorbent was studied for decolonization of MB; the influence of the initial pH, dye MB concentration, contact time, adsorbent dose, and temperature on adsorption of MB was investigated. The adsorption capacity of MB increased with increasing the initial dye concentration, while the optimized pH was found to be 6.
The kinetics of MB removal indicated an optimum contact time of 45 min via a two stage of adsorption kinetic profile (initial fast and subsequent slow equilibrium).The MB adsorption AC follows a pseudo-second order kinetic model (R 2 = 0.999). That relies on the assumption that the chemisorption may be the rate-limiting step and where the MB ions are attached to the adsorbent surface by forming chemical bonds and tend to find sites that maximize their coordination number with the surface.
The equilibrium adsorption data for MB on AC were analyzed by various models. The results indicate that the Langmuir isotherm provides the best correlation (qmax = 170.357 mg/g at 299 K).
The negative ΔG° and positive ΔH° indicate that the adsorption of MB onto AC is spontaneous and endothermic over the studied temperatures range. MB is strongly bonded to the adsorbent surface while the positive entropy states clearly that the randomness increases at the solid-solution interface during the MB adsorption and some structural exchange between active sites and MB ions.
The comparison of the adsorption capacity of our adsorbent with others showed its attractive properties from both industrial and economic interests. This study has given encouraging results, and we wish to carry out column adsorption tests under the conditions applicable to the treatment of industrial effluents and to test the heterogeneous photodegradation of MB on the SnO2, TiO2 semiconductors is the future objective of this work.
Footnotes
Acknowledgements
The authors gratefully acknowledge support from University M’hamed Bougara of Boumerdes, Laboratory of Soft Technologies and Biodiversity, Faculty of Sciences. This research did not receive any specific grant from funding agencies in the public, commercial, or not-for-profit sectors.
Declaration of conflicting interests
The author(s) declared no potential conflicts of interest with respect to the research, authorship, and/or publication of this article.
Funding
The author(s) received no financial support to the research authorship, and/or publication of this article.