
Abstract
Biocomposite beads (AC-SA) were prepared utilizing sodium alginate and activated carbon from a mix cultivar of date palm (Phoenix dactylifera) pits in order to study the removal of methylene blue (MB). Scanning electron microscopy (SEM), energy dispersive X-ray spectroscopy (EDX), X-ray diffraction (XRD), Fourier transform infrared spectroscopy (FTIR), and pH of zero point of charge (pHzpc) investigations were used to evaluate the produced beads physiochemically. Numerous factors, such as adsorbent dosage, temperature, initial dye concentration, pH, and contact time, were taken into consideration while evaluating adsorption performance. The optimization method showed that, with a basic pH, 8.5 and 0.080 g bead weight, equilibrium was reached in 120 min. Several isotherms and kinetic models were used to evaluate the adsorbent capacity. The results showed that the greatest removal efficiency of MB onto AC-SA beads was 23.529 mg/g. Adsorption occurred via the pseudo-second order kinetic model and the coulombic forces adsorption mechanism. The Langmuir and Freundlich isotherms were determined to best suit the experimental data for the AC-SA beads. These findings demonstrate the potential of AC-SA biocomposites as economical and effective dye removal adsorbents.
Introduction
Since water (the hydrosphere) covers two-thirds of the Earth's surface, it is one of the planet's most valuable natural resources. As the world population continues to grow, so do human needs, and this expansion increases the pressure on water and other natural resources (boyd, 2019). Water plays a major role in various industries, which exposes it to a multitude of pollutants. Consequently, water pollution has emerged as one of the most serious threats to ecosystems in recent times (Sait et al., 2020). Therefore, it has become essential to remove pollutants from industrial effluents, which mostly contain organic contaminants (such as pesticides, petroleum, and dyes) and inorganic pollutants (such as heavy metals), all of which are toxic to both humans and ecosystems (Bisht et al., 2023).
Although the exact proportion of colored wastewater released by the textile, food, pharmaceutical, cosmetic, and paper industries—as well as other production sectors—remains unknown, its discharge into water bodies poses significant toxic and ecological risks (Ardila-Leal et al., 2021). With an annual production of 80,000 tons, these dyes are widely employed in industrial industries like leather, paint, and textiles (Cheruiyot et al., 2019; Durrani et al., 2022). In general, dyes can be divided into three kinds (Peighambardoust et al., 2020): cationic (basic dyes), nonionic (disperse dyes), and anionic (direct, acid, and reactive dyes). One cationic dye is MB. The textile industry uses this heterocyclic aromatic organic chemical extensively to dye natural fibers like silk and cotton (Durrani et al., 2022). MB can cause serious health problems, including ocular damage, burning and itching, skin irritation, and methemoglobinemia (blue disease). In some cases, it can also lead to vomiting and diarrhea due to gastrointestinal irritation (Nasrullah et al., 2017). Recently, Berk et al. (2025) demonstrated the efficiency of polythiophene-filled sodium alginate matrix composites, while Ilter et al. (2024) evaluated the performance of sodium alginate/carboxymethyl cellulose/activated carbon ternary composite microbeads with varying activated-carbon loadings for the adsorption of hazardous methylene blue from aqueous solutions. Dye-containing effluent must therefore be effectively treated before entering aquatic bodies for discharge. Numerous chemical, biological, and physical treatment techniques, such as ozonation (Gamze et al., 2025), photocatalytic degradation (Sha et al., 2024), electrochemical treatment (Alam et al., 2024), and adsorption (Wei et al., 2025), are used to eliminate dyes from industrial discharges.
Using a variety of suitable adsorbents, adsorption is thought to be an efficient technique for removing colors from wastewater. Various materials, including carbon-based chemicals and natural polymeric compounds, are among the most efficient adsorbents (Durrani et al., 2022; Sait et al., 2020). Because of its huge specific surface area, mechanical stability, and high pore volume, activated carbon (AC) is frequently used to remove contaminants from industrial effluents. However, because activated carbon is expensive to produce and regenerate, its application is restricted (Abdelkader et al., 2025; Gürkan et al., 2022); this is why recent efforts have focused on using inexpensive organic raw materials, such as agricultural by-products (olive pits, date pits, coconut shells), to produce biochar. Biochar is created through activation in two steps: chemical activation (using an activating agent often H2SO4/H3PO4) (Abdelkader et al., 2025) or physical activation by pyrolysis in an inert environment at high temperatures (Gürkan et al., 2022; Oni et al., 2019). Biochar exists in various particle sizes, including granules and powder. The powder form is known for its large specific surface area and small particle size, but it requires more complex post-adsorption treatments such as flocculation (Gürkan et al., 2022; Huang et al., 2019).
Biochar has been produced from several agricultural by-products, including date pits (Aghilesh et al., 2023). Algeria, which cultivates about 1.4 million hectares of date palms (Sporchia et al., 2023), generates a large amount of date waste. Abdelkader et al. (2025) and Abdelali et al. (2019) worked on activated carbon obtained from a single date pit cultivar (Degla Beidha). Algeria is widely known for its date production, with over 900 cultivars of date palm (Phoenix dactylifera), ranking sixth in the world and first in North Africa, with an annual average production of 789,357 tons and over 440,000 tons of waste (Bouafia et al., 2024). This generates a proportional amount of date pits from mixed Algerian varieties (such as Ghares, Tikarmoust, etc.) (Abdelkader et al., 2025).
The converting agricultural residues particularly date-palm biomass into activated carbon or biochar supports circular bioeconomy principles by reducing waste burdens, lowering production costs, and enabling sustainable pollutant removal. For example, Al-Hazeef et al. (2024) demonstrated that valorizing date-palm spikelets into activated-carbon composites for dye adsorption directly advances circular-economy goals in wastewater treatment. Bedoui et al. (2024) further showed that hydrothermal carbonization of date-palm pits yields activated hydrochar with strong adsorption performance, emphasizing its role in biomass valorization and sustainability-driven material development. Additionally, Al Arni et al. (2022) reviewed the use of date-palm fibers as low-cost, renewable biosorbents, underscoring their environmental benefits and alignment with waste-to-resource strategies.
The aim of this study is to synthesize biocomposite beads made from a mixture of Algerian date pit cultivars via pyrolysis, encapsulated in sodium alginate, with the goal of removing MB from aqueous solutions. The beads were structurally characterized using FTIR, SEM, EDX, and XRD techniques. Adsorption experiments were conducted to evaluate the effect of solution pH, temperature, kinetics, isotherms, and thermodynamics. The regeneration of the beads was also examined after the adsorption process.
Materials and methods
Materials
Waste from a date palm oasis was used to make date pit activated carbon. All chemicals used in this study were purchased from Biochem Chemopharma Company. Table 1 listed the purity, molecular weight, and CAS numbers of these materials. Using an Optizen POP UV/Vis spectrophotometer set to the maximum absorbance wavelength of 665 nm, the concentration of MB in aqueous solution was measured. The IDWA AD8000 bench pH meter was used to modify the solutions’ pH.
The purity, molecular weight, and CAS number of the chemicals used in this study.
Synthesis of biocomposite beads
With a few minor adjustments, AC-SA was prepared using the Benhouria et al. (2015) methodology. First, 100 mL of deionized water was used to dissolve 0.6 g of sodium alginate, which was then agitated for 1.5 h. The alginate solution was then supplemented with 1.4 g of powdered activated carbon that had been made by pyrolyzing a blend of three date pit cultivars (Ghars, Hammraya, and Tikarmousst) in a weight ratio of 0.8:0.1:0.1. According to Table 2, the specific surface area of the activated carbon was 738 m2/g. To achieve a uniform suspension, the resultant AC–SA mixture was constantly agitated for 12 h. Using a burette, the homogenous mixture was gradually dropped into a 5% (w/v) calcium chloride solution while being stirred rapidly to prepare the biocomposite beads. To guarantee full gelation, the produced beads were placed in the calcium chloride solution for the entire night. By continuously washing the beads with deionized water, excess calcium chloride was eliminated. After that, the beads were sieved to produce the desired particle size fractions. The sample with a particle size 45 µm was then dried for 24 h at 110°C in an electric oven and kept in a sterile, airtight container at room temperature for 48 h. The steps of the AC-CS formation are shown Scheme 1.
The properties of the prepared activated carbon and preparation conditions.

Schematic representation of the preparation biocomposite beads and adsorption process of MB from aqueous solution.
Characterization of AC-SA biocomposite beads
The determination of the micrographs and the chemical microanalysis technique of the biocomposite beads was carried out using EDX with scanning SEM (ZEISS-ULTRA55 SEM microscope), and BTX II X-ray diffraction analyzer (XRD) OLYMPUS, FTIR analysis was used before and after adsorption (KBr pellets in the range of 4000–400 cm−1 using Shimadzu FTIR 8300 E spectrophotometer (Al-Dalahmeh et al., 2024).
The pHzpc was used in order to define zero net surface charge (zero electric charge) for which the surface density become either positively or negatively charged as a function of pH depending on solution's pH (Stadnik et al., 2023). The pHzpc of AC-SA was determined by the salt addition method (Bentarfa et al., 2021).
Swelling behavior
Swelling refers to the extent to which the biocomposite beads absorb water and expand (Toleuova, 2024). This was determined following the method described by Erfani and Javanbakht (2018). Briefly, 0.1 g of dried beads was immersed in 0.15 M HCl solution. At 15-min intervals, swollen beads were carefully removed, placed on filter paper inside a bottle, and promptly weighed. The swelling ratio was calculated using the following formula:
Adsorption procedure
Thirty milligrams of MB were dissolved in one liter of distilled water to prepare a stock solution. The effects of a number of parameters, including initial pH, initial MB concentration, bead dose, contact time, and temperature, on the adsorption capability of the AC-SA beads were examined by adsorption tests. Adsorbent mass (0.007–0.120 g), pH values (2–12) (adjusted with 0.1 M HCl or 0.1 M NaOH), initial MB concentrations between 3 and 40 mg/g, contact time intervals between 5 and 240 min, and temperatures between 25°C and 65°C were among the settings studied for this purpose (Al-Dalahmeh et al., 2024). At the conclusion of the adsorption time, the beads were filtered after the samples had been agitated at 150 rpm. After equilibrium was reached, residual MB concentrations were measured using a UV-Vis spectrophotometer at 665 nm.
Using initial MB concentrations ranging from 3 to 40 mg/L, adsorbent dose: 0.080 g/20 mL, and contact time: 2 h, the isotherm models Langmuir, Freundlich, Dubinin–Radushkevich (D-R), and Harkins–Jura (H-J) were applied in order to study the adsorption mechanism. With an adsorbent dosage of 0.080 g/20 mL and an MB concentration of 30 mg/L, kinetic models of pseudo-first order, pseudo-second order, and intra-particle diffusion were investigated across contact durations ranging from 5 to 240 min. The following formulas were used to determine MB's adsorption capacity and percentage removal (R%):


The concentrations of the MB solution (mg/L) at the beginning, at the point t, and at equilibrium are denoted by
Statistical evaluation
A non-linear regression technique was used to determine which modifiable parameters of the kinetic and isotherm models best fit the observed adsorption data. Specifically, the linear correlation coefficient (R2) is used to determine the model parameters for adsorption kinetics and isotherms.
The best kinetic and isotherm equations for modeling adsorption data were determined using the following statistical criteria: Marquardt's percent standard deviation (MPSD) (Ng et al. 2002) and the corresponding adsorption scheme chi-square (χ2), which quantify the differences between the amount of Cr(VI) ions absorbed by the adsorbent as predicted by the models (qe.cal) and the actual amount that was measured experimentally (qe,exp).

Where N is the number of experimental data points (Al-Dalahmeh et al., 2024; Tran et al., 2017).
Regeneration procedure
The regeneration experiment was conducted immediately after achieving the equilibrium. For this purpose, the equilibrium concentration was taken as initial concentration. After being saturated with MB, the AC-SA samples were removed from the flask's 30 mg/L MB solution and thoroughly rinsed with distilled water to get rid of any last bits of dye. Following drying, the biocomposite beads were separated into three groups. One group was put in a 250 mL flask with 100 mL of methanol, another group was put in a 250 mL flask with 100 mL of HCl solution at 0.1 M, and the third group was put in a 250 mL flask with 100 mL of 0.1 M NaOH. Until equilibrium was reached, the resulting mixture was shaken. Then, the concentration at equilibrium was measured. This procedure was performed six times for the first and third group but for the second group the equilibrium was achieved at four-time repetition, and percentage removal was estimated according to Equation (2) (Benhouria et al., 2015).
Results and discussion
Beads characterization
FTIR analysis was performed to determine the functional groups that were present in the AC-SA beads both before and after MB adsorption. The significant signal at 3422 cm⁻1 in Figure 1 represents hydroxyl (–OH) groups. Following MB adsorption, this peak is still visible, suggesting that the dye and the beads are interacting through hydrogen bonds (H–MB). Benhouria et al. (2015) and Nasrullah et al. (2018) reported similar phenomena. C–H stretching vibrations are responsible for a peak seen at 2924 cm⁻1, but the carboxyl (C=O) stretching vibration, which is prominent at 1630 cm⁻1, shows a modest decrease in intensity following MB adsorption. This implies that the carbonyl group and MB molecules (C=O–MB) interact electrostatically (Li et al., 2016). Furthermore, nitro-functional groups are indicated by a band at 1388 cm⁻1 (Erfani and Javanbakht, 2018).

FTIR spectra of AC-SA beads before and after adsorption process of MB.
The XRD pattern of AC-SA beads is illustrated in Figure 2 where the beads manifest a diffraction peak at two theta position of 17° and position 32°, this is a derivation compared to those mentioned in literature (20.74° and 38.40°) which is likely attributed to the addition of date pits activated carbon (Erfani and Javanbakht, 2018).
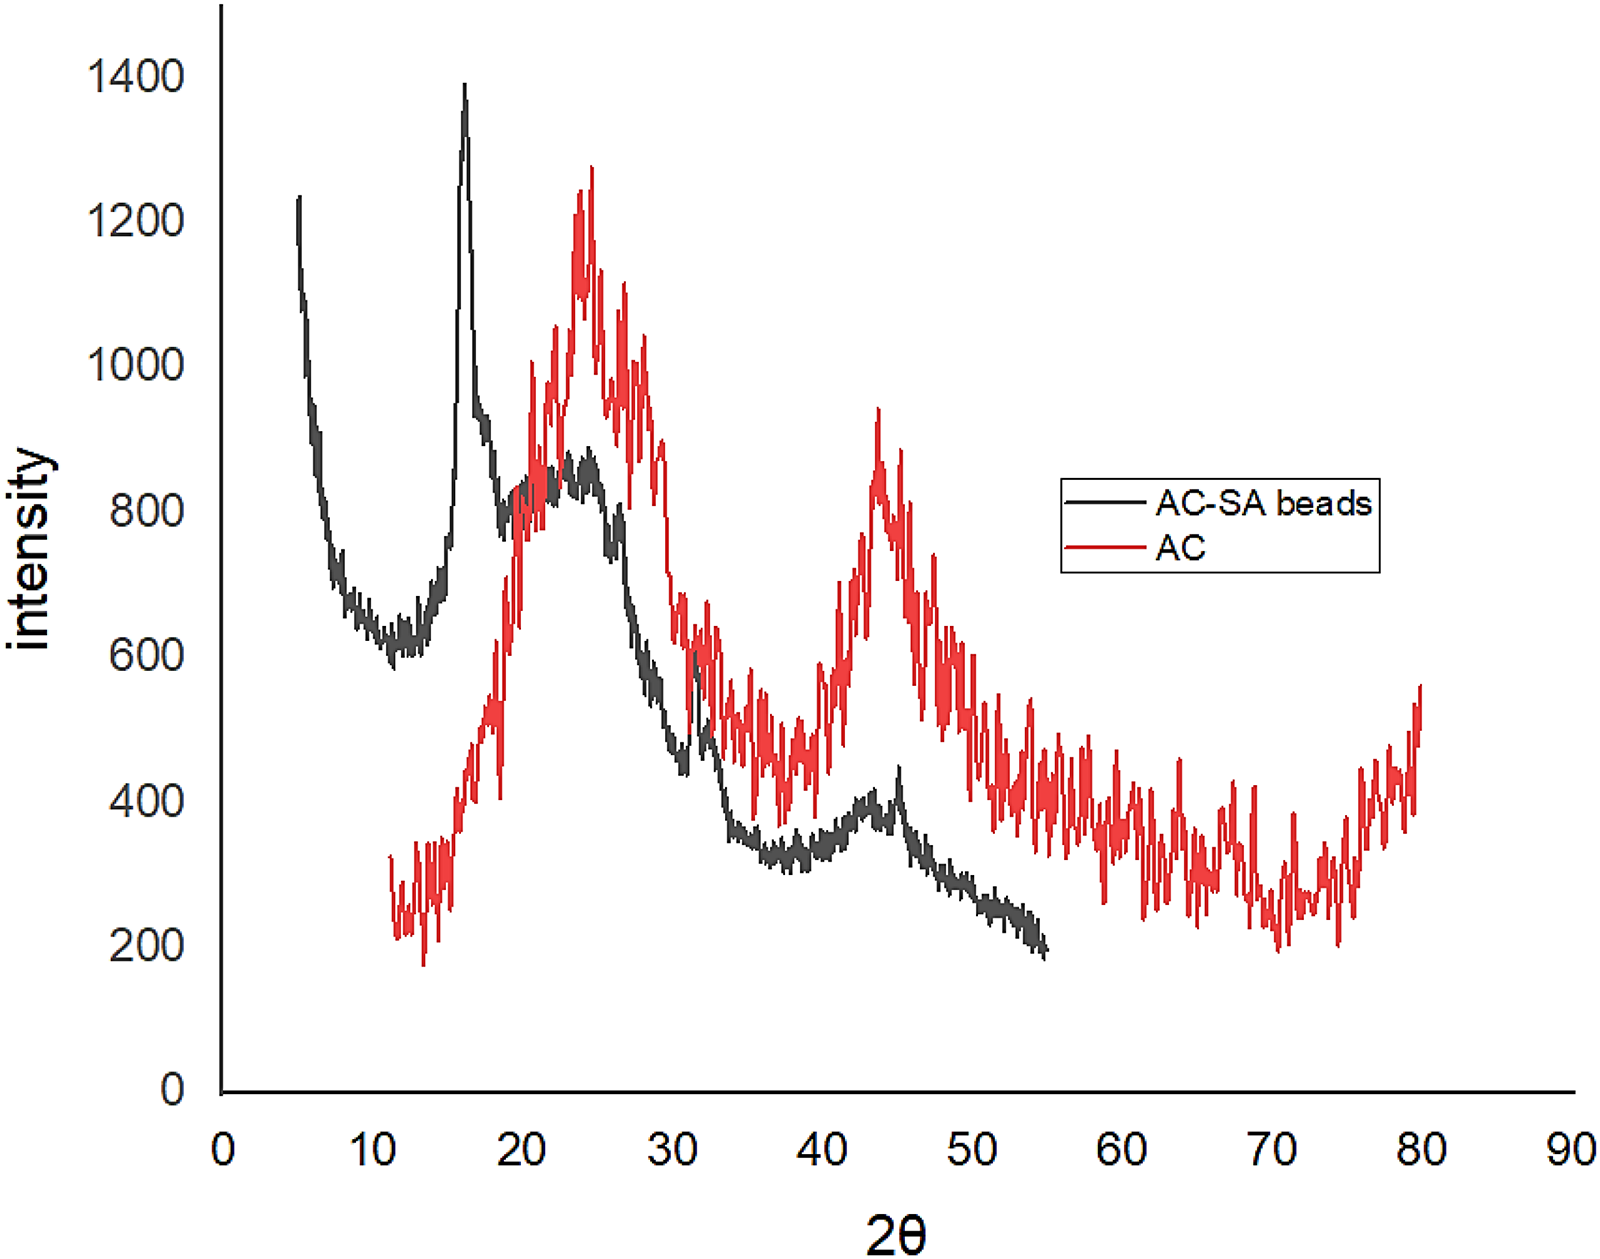
XRD diffraction pattern of AC and AC-SA beads.
The surface morphology of AC-SA was analyzed using SEM to evaluate how its structural features influence its performance as an adsorbent. SEM imaging was also conducted on AC-SA after methylene blue loading to observe structural changes resulting from the biosorption process. As shown in Figure 3(a), the biocomposite beads are spherical, blackish in color, and exhibit a uniform size distribution. The SEM micrographs in Figures 3(b) and (c) reveal a rough surface characterized by numerous unconnected pores, which provide sample free space and are likely advantageous for adsorption (Nasrullah et al., 2017). Following methylene blue adsorption, the SEM image in Figure 3(d) shows a noticeably less porous structure, suggesting that the dye molecules occupy the microspores of the AC-SA beads.
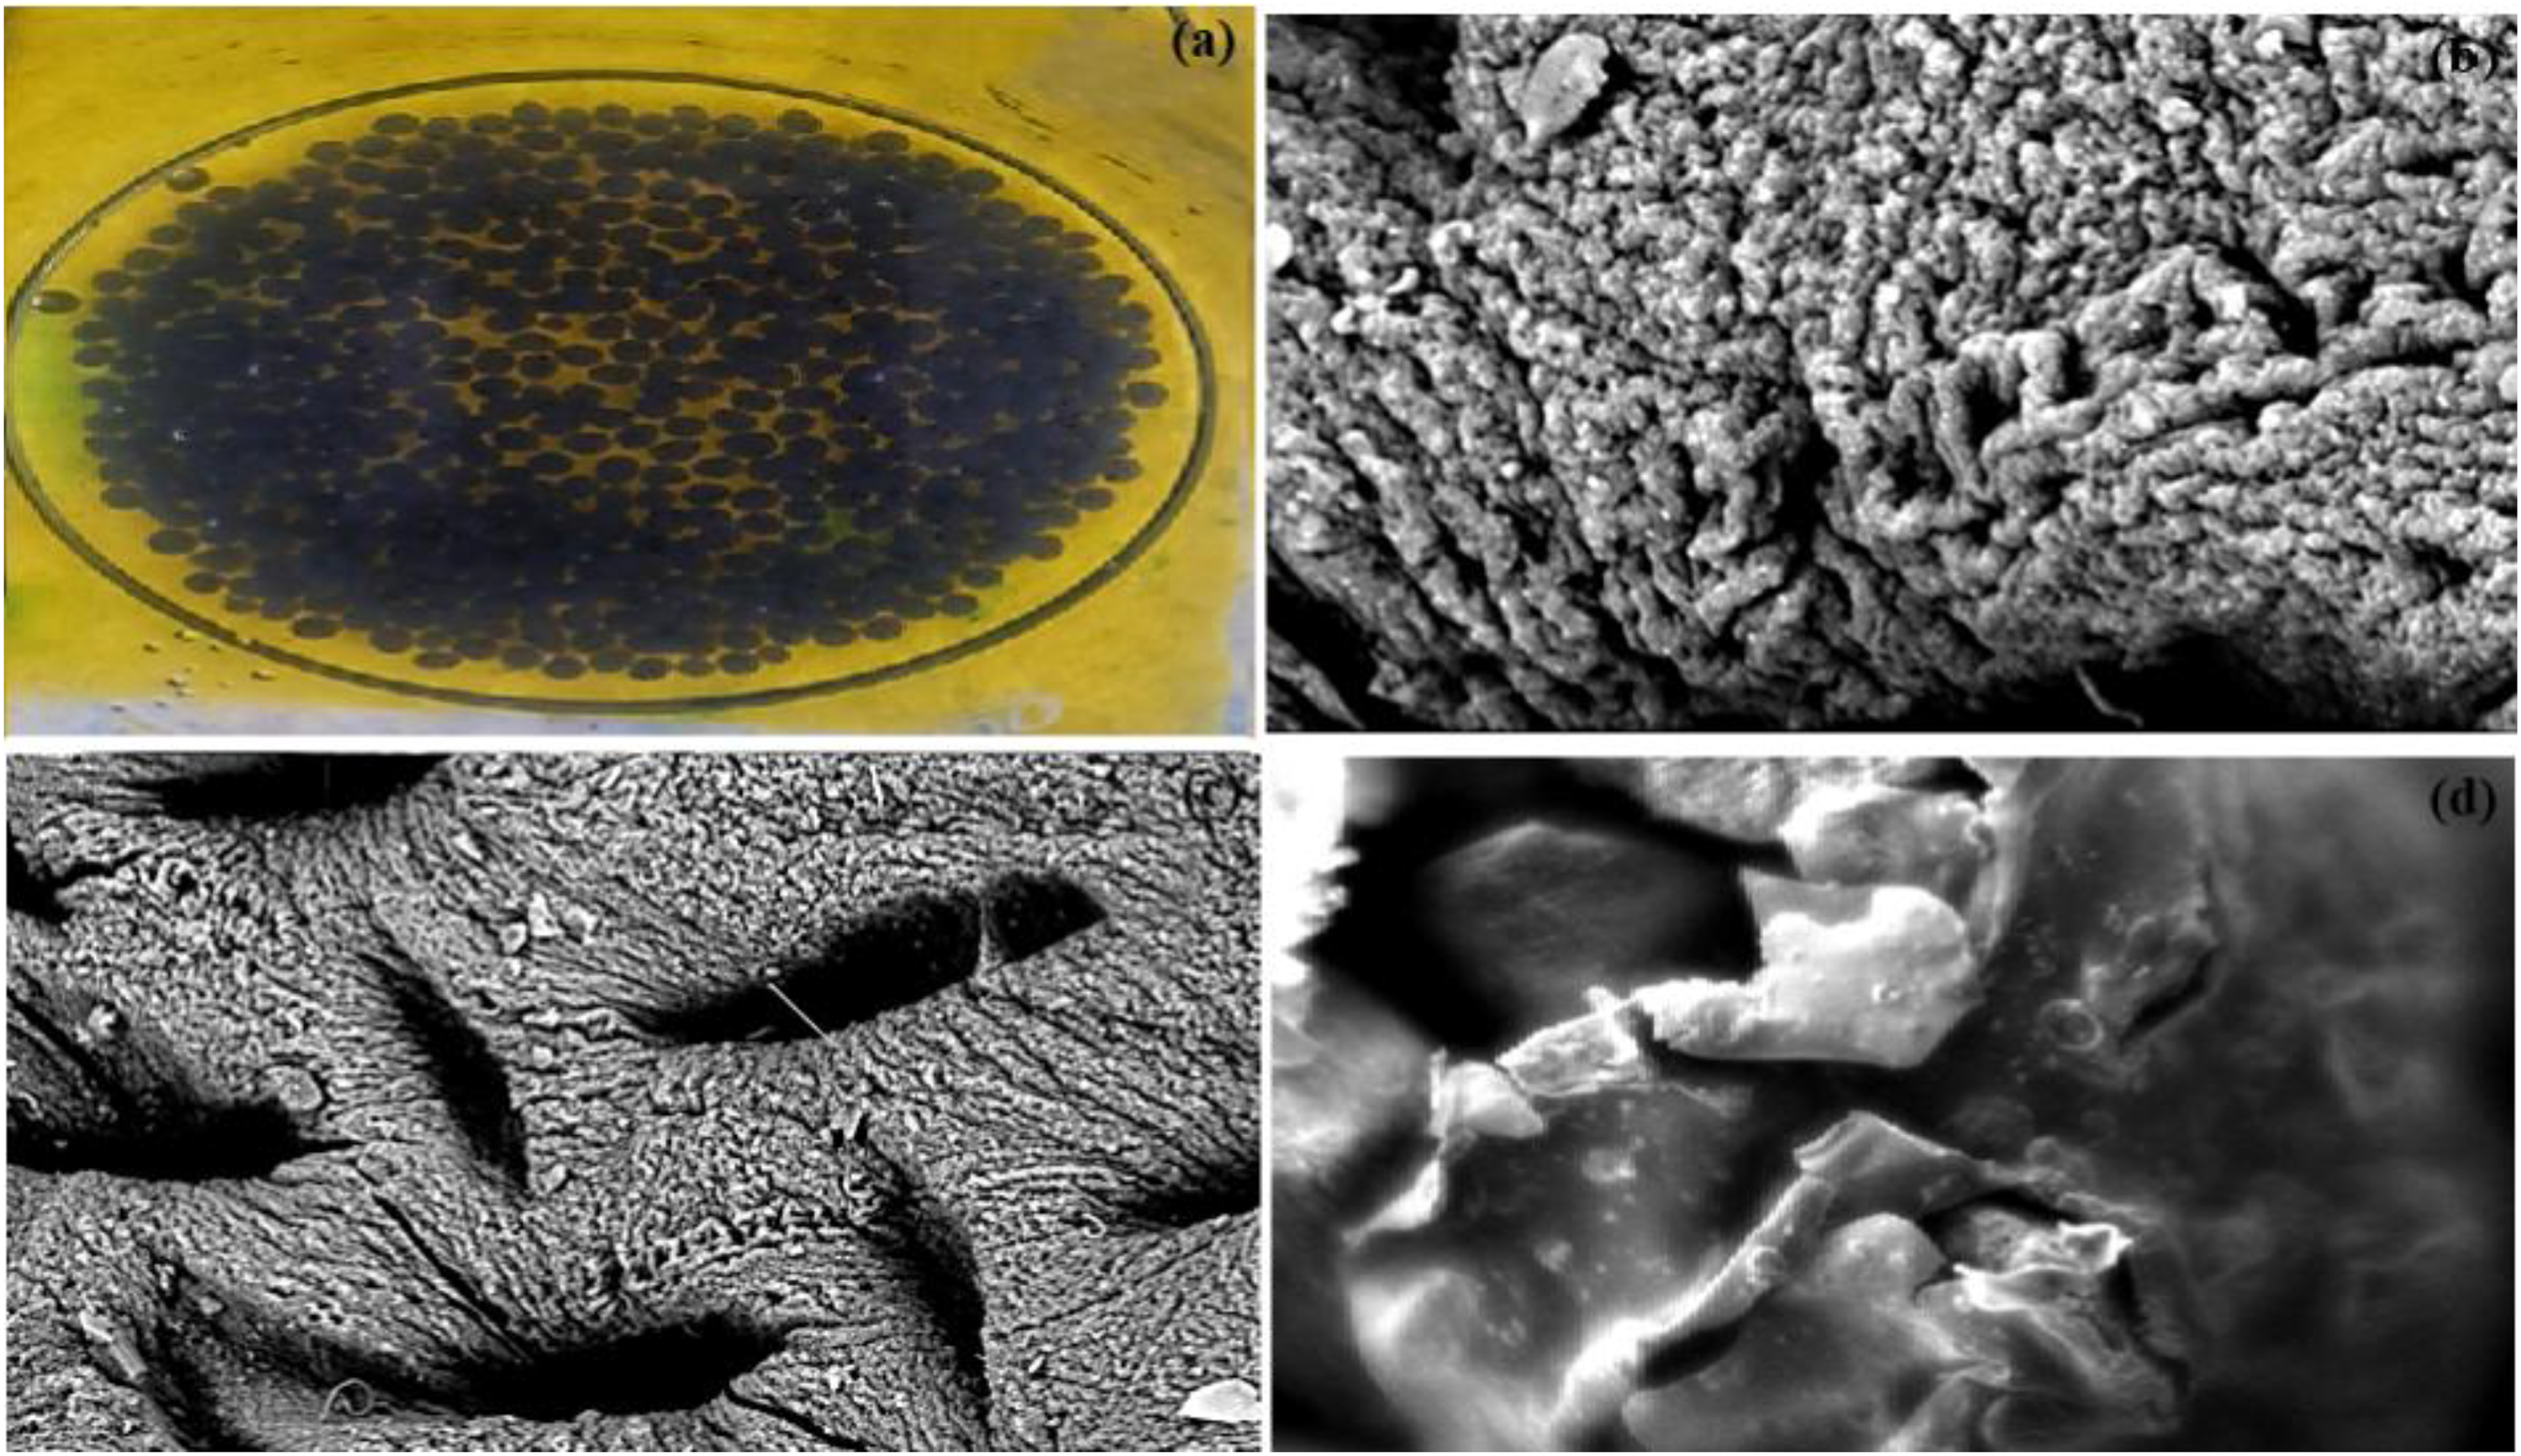
(a) AC-SA beads picture, (b) SEM image 5 µm, (c) SEM image 20 µm, and (d) SEM image after MB adsorption 20 µm.
The EDS technique, an X-ray-based analytical method, was employed to determine the elemental composition and corresponding weight percentages at selected points on the SEM micrographs. Figure 4 presents the EDS spectra of both pristine AC-SA and AC-SA after loaded of MB adsorption. The appearance of additional carbon signals in the MB-loaded sample, accompanied by a reduction in the relative percentages of O, P, S, Cl, Ca, and Au, clearly differentiates the two spectra. The markedly higher carbon content observed in the MB-loaded AC-SA is attributed to the carbon-rich molecular structure of the dye, confirming its successful adsorption and the resulting modification of the surface elemental composition.
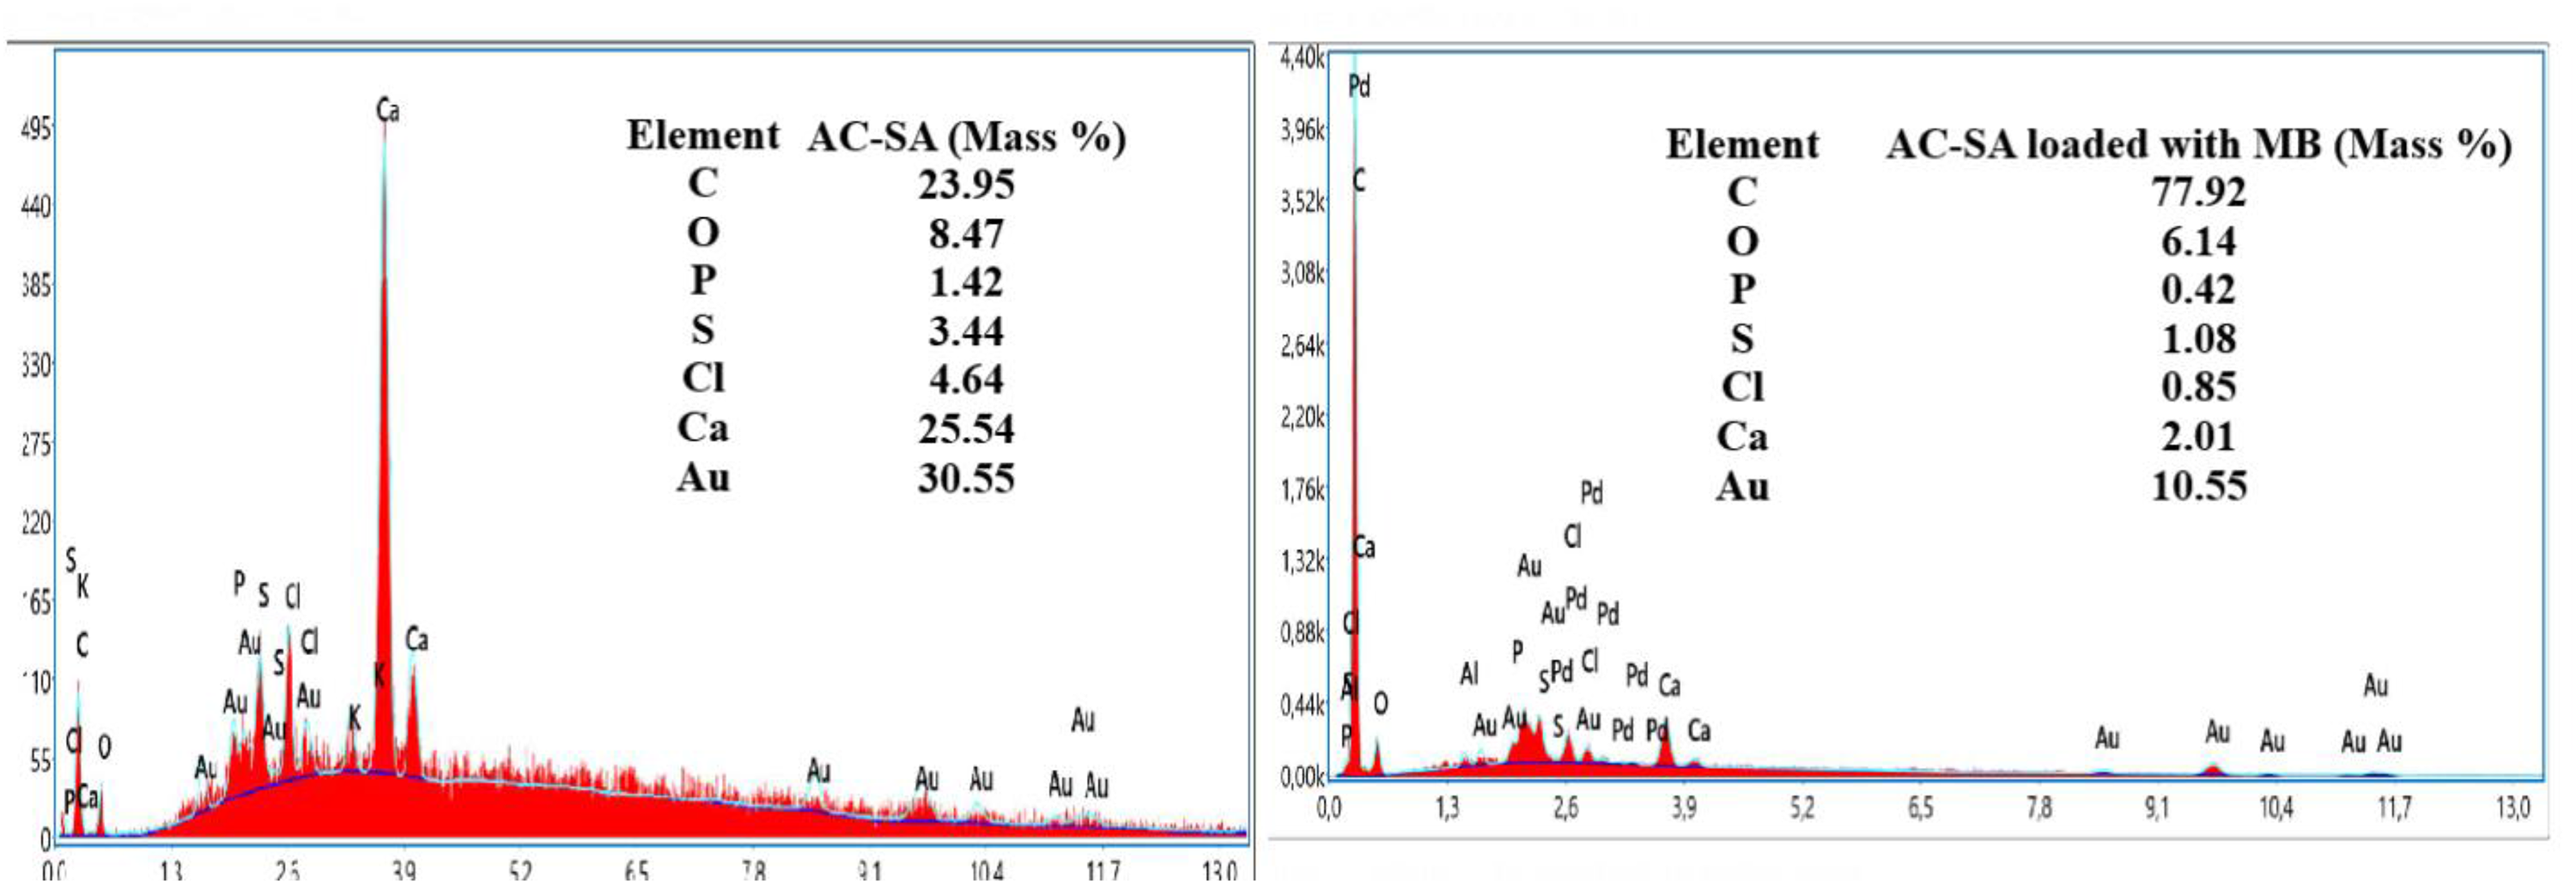
EDS analysis of (a) AC-SA and (b) AC-SA loaded with MB.
The swelling test revealed that the AC-SA beads exhibited a swelling ratio of approximately 115% after 120 min, indicating a significant capacity for water uptake. These results are shown in Supplemental Figure S1.
Parameters affecting MB adsorption
Effect of AC-AS beads dosage
The influence of AC-SA bead mass on MB adsorption efficiency is illustrated in Supplemental Figure S2. As shown, a removal efficiency of approximately 80% was achieved when using 0.08 g of beads. Beyond this mass, the removal rate plateaued, indicating that 0.08 g is the optimal bead mass for subsequent experiments. The higher number of empty adsorption sites on the AC-SA beads is responsible for the observed rise in percentage removal (%R) with increasing bead mass while keeping the MB concentration constant. By increasing the active surface area, MB molecules are more likely to interact with the adsorbent, which improves removal efficacy overall. But when the adsorbent dose increases, the concentration of solution ions falls to a lower value, bringing the system to equilibrium at lower values of (qe), which is why the adsorption capacity (qe) declines with the AC-SA dose.
Effect of initial pH
The pH of the solution plays a critical role in influencing the adsorption process. As illustrated in Figure 5, the initial pH of the MB solution significantly affects the removal performance. Specifically, the adsorption efficiency increased as pH rose from 2 to 8, reaching a maximum removal efficiency of 84.19%. Beyond pH 8, the adsorption performance remained relatively stable up to pH 10. However, a slight decrease in efficiency was observed at higher pH values. This trend can be explained by two main factors. First, pH changes alter the surface charge of the AC-SA beads, as well as the ionization state and molecular structure of MB molecules, thereby affecting the overall adsorption mechanism (Zhang et al., 2019). Second, the adsorption behavior is consistent with the intrinsic pH of the AC-SA beads, which is approximately 8.2, as shown in Figure 5. Below this value, the bead surfaces are positively charged, and since MB has a pKa of 3.8 (Bahrami et al., 2024), it predominantly exists as cationic species in acidic environments (pH < 6). This results in electrostatic repulsion between the positively charged beads and MB cations, thus reducing adsorption efficiency.
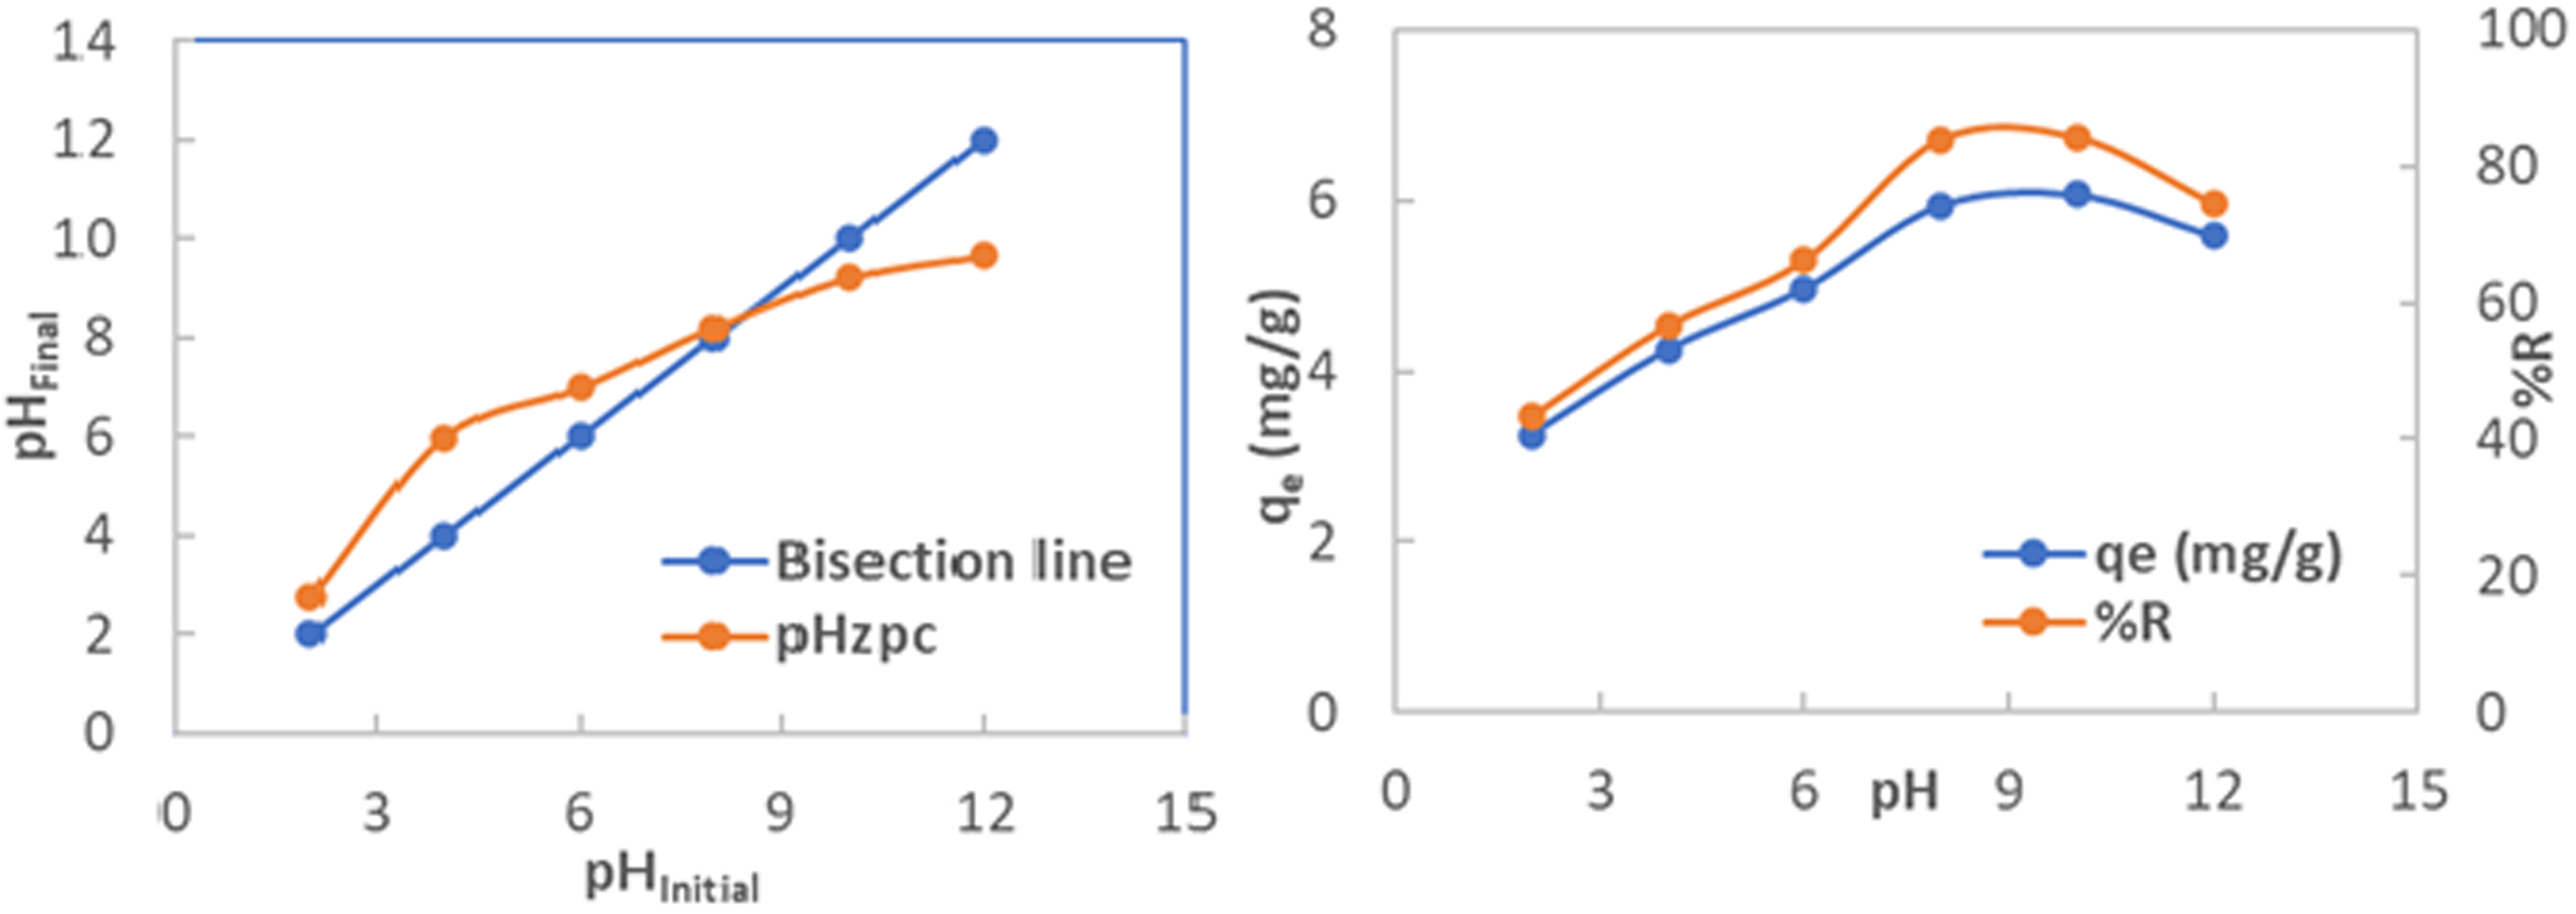
(Left) affect of initial pH solution on the MB removal and (Right) determination of pHzpc. The initial concentration of MB = 30 mg/L, dosage weight = 0.080 g/20 mL, agitation speed 150 rpm; contact time 120 min and 25°C.
As seen in Figure 5, the highest adsorption occurs in the pH range of 8–10, which can be attributed to the electrostatic attraction between the negatively charged bead surfaces (pHzpc ≈ 8.2) and cationic MB molecules. For pH values greater than 10, the MB removal efficiency begins to decline. This is likely due to competitive adsorption between MB molecules and hydroxide ions, which are more prevalent in highly alkaline solutions (Debbache et al., 2024). Additionally, electrostatic repulsion between alginate chains increases under such basic conditions, leading to swelling of the beads. Although swelling can expose additional adsorption sites, the competitive interactions reduce the overall removal efficiency (Othman et al., 2020).
Based on these findings, a pH of 8.5 was selected as the optimal condition for MB adsorption using date-pit-derived AC-SA beads. This result aligns with previous studies, such as that by Nasrullah et al. (2018), who reported improved adsorption under alkaline conditions using AC-SA beads synthesized from mangosteen peels. Similarly, Khanday et al. (2016) observed maximum adsorption of MB at alkaline pH using cross-linked oil palm ash zeolite/chitosan biocomposite beads.
Effect of initial MB concentration
About 0.080 g of beads were added to separate flasks with different beginning MB concentrations ranging from 5 to 40 mg/L in order to examine the impact of initial MB concentration on the adsorption capacity of AC-SA beads. As shown in Supplemental Figure S3, the
Isotherm studies
The experimental data were fitted to a number of isotherm models in order to examine the adsorption behavior: The Langmuir isotherm model, which is represented by its nonlinear form, is based on the assumption of monolayer adsorption on a homogeneous surface (Butyrskaya, 2024):

Where 0 <
The Freundlich isotherm describes adsorption on heterogeneous surfaces and allows for the possibility of multilayer adsorption, which is defined as:
In the Freundlich equation, the adsorption capacity and intensity are denoted by the parameters KF and 1/n, respectively (Othman et al., 2020). While n indicates the linearity of the relationship between the adsorbate concentration and the degree of adsorption, 1/n also indicates the degree of surface heterogeneity. When n > 1, it frequently means that the adsorption process is controlled by physical adsorption rather than chemical interaction (Ragadhita and Nandiyanto, 2021).
The Dubinin–Radushkevich (D-R) and Harkins-Jura (H-J) isotherm models (Equations (11) and (12), respectively) provide further insight into the mechanism of adsorption.
Where ε the Polanyi potential and β a constant related to the adsorption energy (mol2/kJ2).
Where AHJ and BHJ are dimensionless isotherm constants.
The D-R model, in particular, proposes a heterogeneous adsorbent surface with a variable adsorption potential and a pore-filling mechanism, the energy needed to extract a molecule from its location in the sorption space at infinity is represented by this one. The kind of adsorption is often indicated by the value of EDR (kJ/mol) (Equation (13)) which can be computed using the value of KDR; chemisorption is suggested by a value between 8 and 16 (kJ/mol), whereas physical adsorption is indicated by an EDR value less than 8 kJ/mol (Bazan-Wozniak et al., 2024; Mouratib et al., 2024).
Multilayer adsorption on surfaces with different pore sizes is explained by the H-J isotherm model, which points to a heterogeneous structure. The Harkins-Jura isotherm parameter (AHJ), describes the presence of heterogeneous pore distribution and takes multilayer adsorption into account (Li et al., 2016).
Figure 6 illustrates the fitting of various isotherm models to the experimental data for MB adsorption onto AC-SA beads. The parameters derived from each model are summarized in Table 3. Among the evaluated models, the Langmuir isotherm model (R2 = 0.9970, χ2 = 0.23, and MPSD =2.32) and the Freundlich isotherm model (R2 = 0.9943, χ2 = 0.11, and MPSD =3.91) better described the adsorptive removal of MB by the AC-SA beads than did the D-R model (R2 = 0.8397, χ2 = 9.47, and MPSD = 18.66) and H-J isotherm model (R2 = 0.8841, χ2 = 8.58, and MPSD = 43.35). The suitability of both Langmuir and Freundlich isotherm models for the studied systems indicates that MB adsorption occurs through a combination of monolayer coverage on finite surface sites and interactions with a heterogeneous adsorbent surface. This dual behavior suggests that the adsorption process is multifaceted and governed by more than one underlying mechanism. Comparable findings have been documented in recent studies examining MB uptake by activated carbon, where Langmuir behavior and surface heterogeneity were likewise observed (Kongtragoul et al., 2025; Vempati, 2025).

The equilibrium isotherm for MB adsorption on AC-SA beads using nonlinear regression method. The initial concentration of MB = 3–40 mg/L, dosage weight = 0.080 g/20 mL, agitation speed 150 rpm, pH = 8.5; contact time 120 min and 25°C.
Langmuir, Freundlich, D-R, and H-J isotherm constants for the adsorption of MB on AC-SA beads. The initial concentration of MB = 3–40 mg/L, dosage weight = 0.080 g/20 mL, agitation speed 150 rpm, pH = 8.5; contact time = 120 min and 25°C.
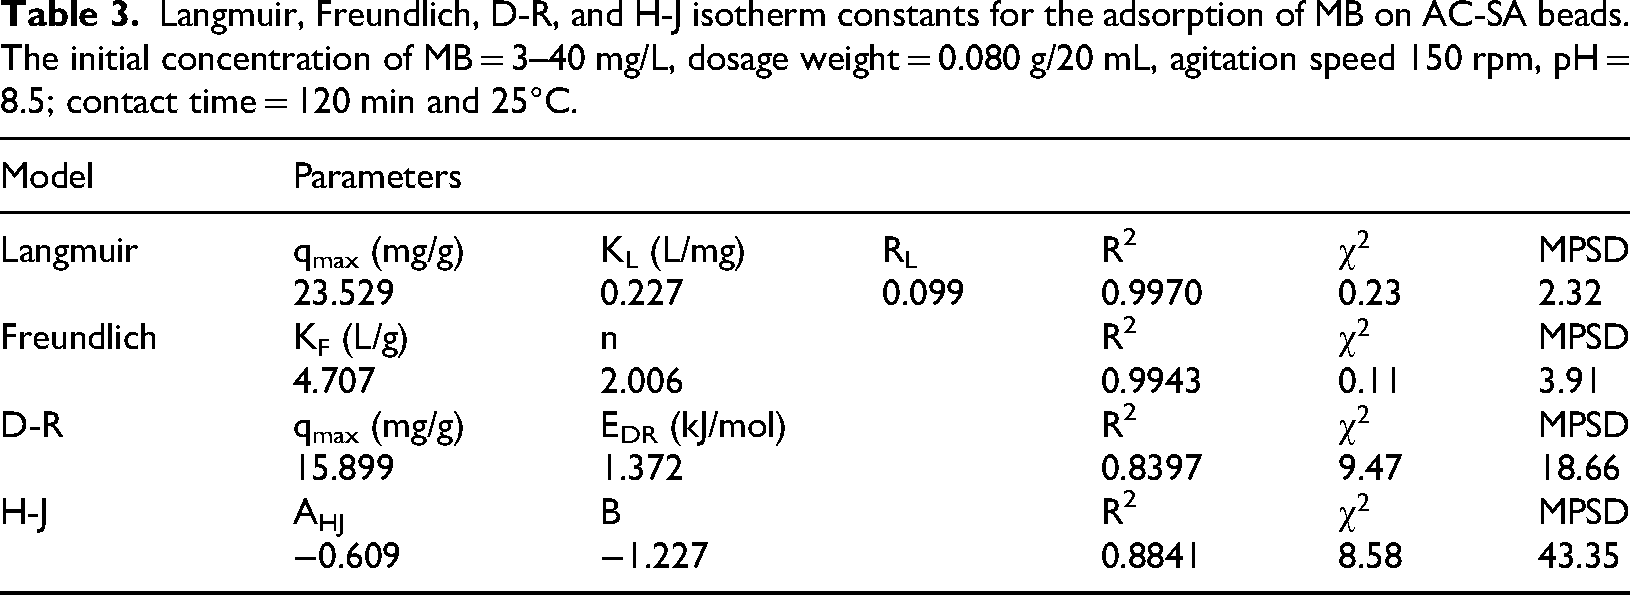
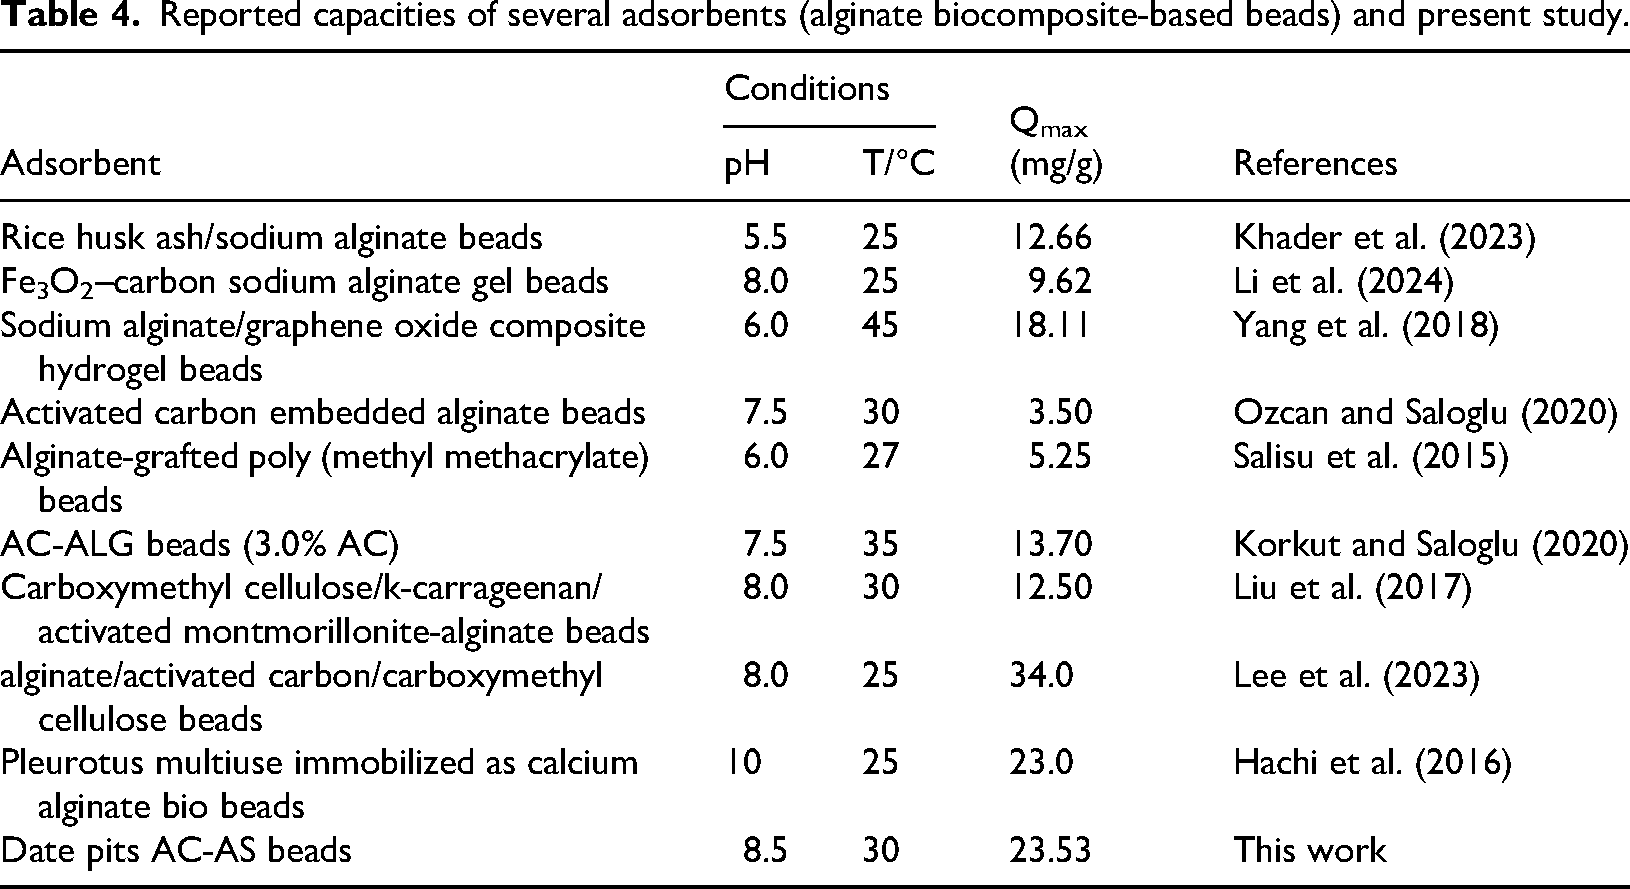
The adsorption process is favorable, as indicated by the Langmuir separation factor RL, which was determined to be 0.099. Moreover, 23.529 mg/g was found to be the greatest adsorption capacity (qmax), which is in good agreement with values for similar biocomposite adsorbents that have been previously published (Table 4).
Reported capacities of several adsorbents (alginate biocomposite-based beads) and present study.
Effect of contact time on adsorption capacity and kinetic studies
By agitating 80 mg of beads in 20 mL of MB solution at a concentration of 30 mg/L, the impact of contact duration on the removal of MB by adsorption onto AC-SA beads was examined. Separate batches were used for this experiment, and measurements were taken simultaneously at various contact times. The results show that the adsorption capacity gradually rises with contact time, reaching equilibrium at 120 min, as shown in Supplemental Figure S4. The improved interaction between dye molecules and the bead surface over time is responsible for this rise (Erfani and Javanbakht, 2018).
Adsorbents’ physical and/or chemical characteristics affect the kinetics of dye adsorption (Kołodyńska et al., 2017). The pseudo-first order and pseudo-second order equations were used to investigate the mechanism of MB adsorption on AC-SA beads. The kinetic equations of pseudo-first order and pseudo-second order are represented by Eqs. (14) and (15) (Hamadneh et al., 2025):

Using the formula from Equation (16) (Hamadneh et al., 2025), one may determine the rate of intra-particular diffusion.
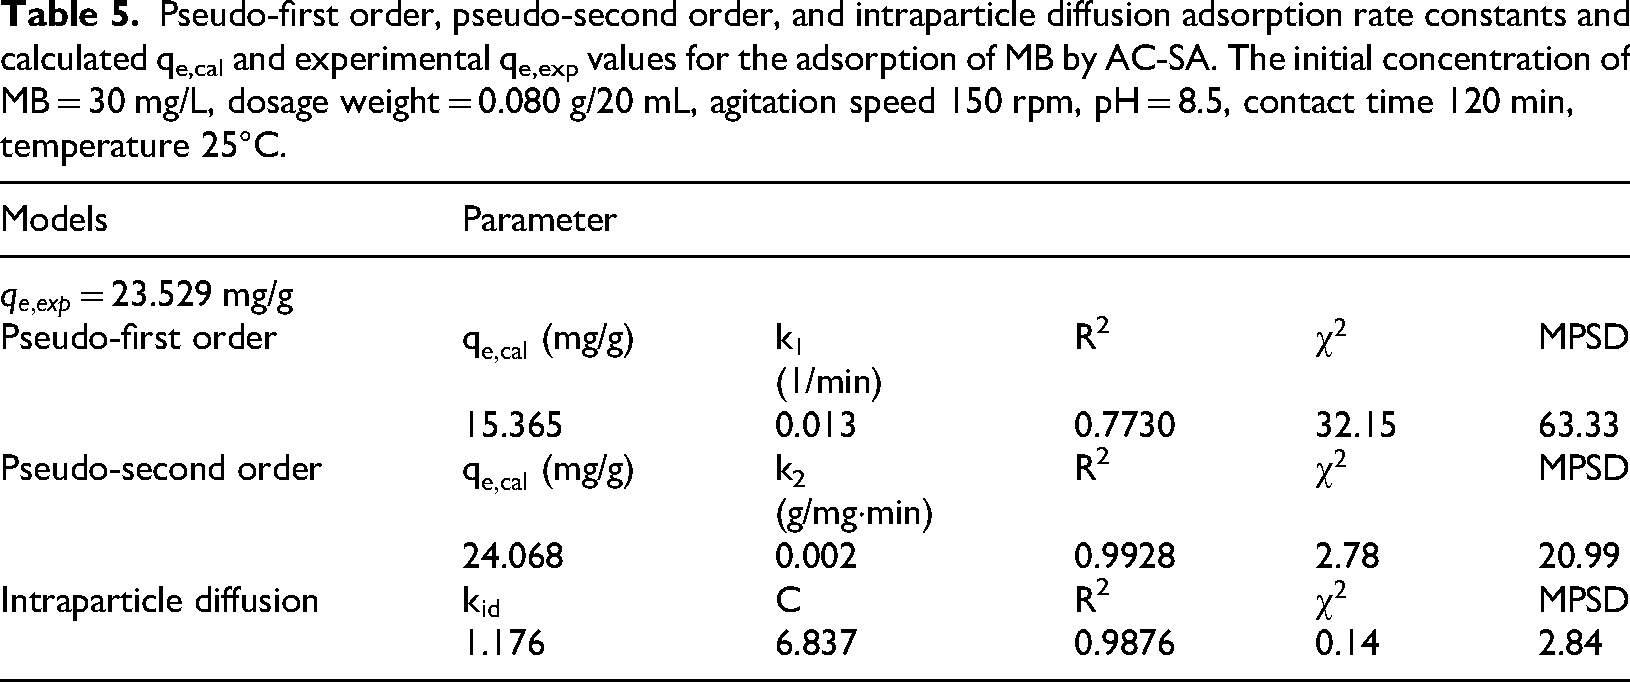
The kinetic properties of the adsorption process of the MB on AC-SA beads were collected and are displayed in Table 5 and Figure 7. Lower χ2 and MPSD values, together with R2 coefficients approaching unity, indicate that the adsorption process is best described by the pseudo-second order kinetic model. The close agreement between the calculated and experimental adsorption capacities (qₑ,cal and qₘₐₓ) further confirms the suitability of this model. Comparable trends have been reported in recent studies investigating methylene blue adsorption onto biochar-based adsorbents, where pseudo second order kinetics consistently provided the best fit to experimental data (Ahmed et al., 2023; Li et al., 2021; Zhang et al., 2022). Three different adsorption phases are clearly visible in the plot of qt vs t1/2 (figure not shown), none of which pass through the origin. This implies that bulk diffusion, film diffusion, and intra-particle diffusion are the three sequential stages of MB adsorption onto the beads (Mouratib et al., 2024). Because there are active sites available, MB first adsorbs quickly onto the external (outer) surface of the AC-SA beads. A slower phase follows, which is probably controlled by MB diffusing into the beads’ interior pores. As equilibrium approaches, the diffusion process progressively slows down in the final phase. These findings imply that the total adsorption process is controlled by bulk diffusion (Figure 8).

Kinetic models for the Removal of MB by AC-SA. The initial concentration of MB = 30 mg/L, dosage weight = 0.080 g/20 mL, agitation speed 150 rpm, pH = 8.5; contact time 120 min; temperature 25°C.

Possible adsorption mechanism of AC-SA beads to methylene blue.
Pseudo-first order, pseudo-second order, and intraparticle diffusion adsorption rate constants and calculated qe,cal and experimental qe,exp values for the adsorption of MB by AC-SA. The initial concentration of MB = 30 mg/L, dosage weight = 0.080 g/20 mL, agitation speed 150 rpm, pH = 8.5, contact time 120 min, temperature 25°C.
Effect of temperature on adsorption capacity and thermodynamic study
One important element that has a big impact on the adsorption process is temperature. Both the adsorption capability and the amount of MB that AC-SA beads can adsorb increase progressively as the temperature rises, as shown in Figure S5. The improved mobility and diffusion rate of MB molecules at higher temperatures, which makes it easier for them to interact with the active sites on the bead surfaces, is responsible for this improvement in adsorption performance (Lee et al., 2023).
Gibbs free energy (Δ 


Thermodynamic parameters for the adsorption of MB onto AC-SA beads.
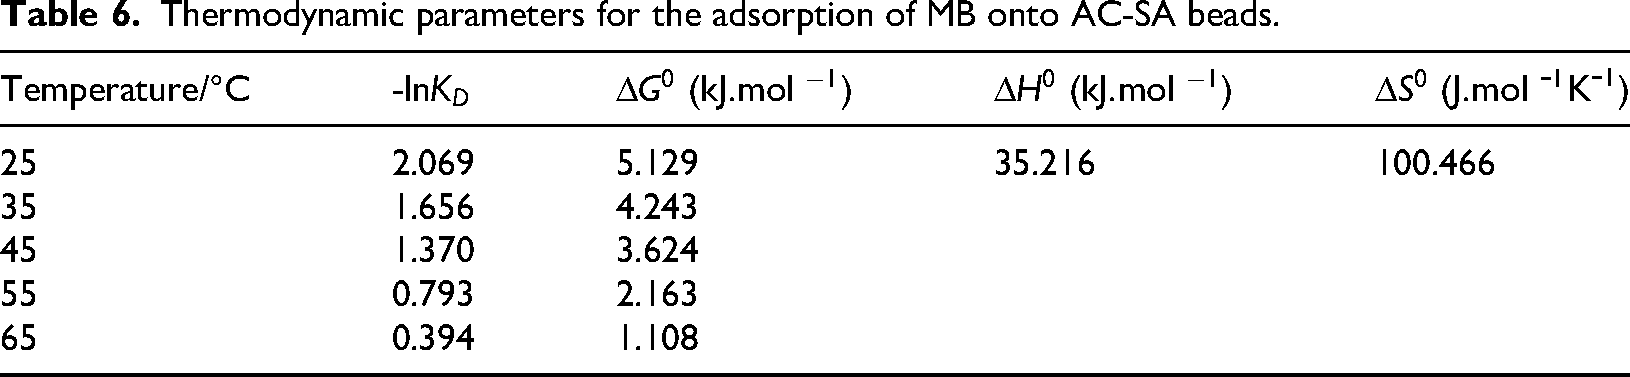
The positive Δ
Regeneration procedure
Figure 9 presents the regeneration performance of the AC-SA beads, evaluated by desorbing previously adsorbed MB using three eluents, 0.1 M HCl, 0.1 M NaOH, and 98% MeOH. The regeneration profiles clearly show a progressive decline in MB desorption efficiency with increasing regeneration cycles, a trend commonly observed in adsorbent reusability studies due to gradual pore blockage, loss of active sites, or structural degradation of the adsorbent matrix. Despite this decline, the AC-SA beads demonstrated strong regeneration stability during the first three cycles, particularly when treated with HCl and MeOH. Regeneration with HCl yielded an MB removal efficiency of 89.2%, while MeOH achieved 78.12%, indicating that acidic and organic eluents are more effective in disrupting electrostatic and π–π interactions between MB molecules and the carbonaceous surface. These findings align well with earlier reports, such as Allouss et al. (2019), who similarly observed high regeneration efficiencies for acid-treated activated carbon systems.
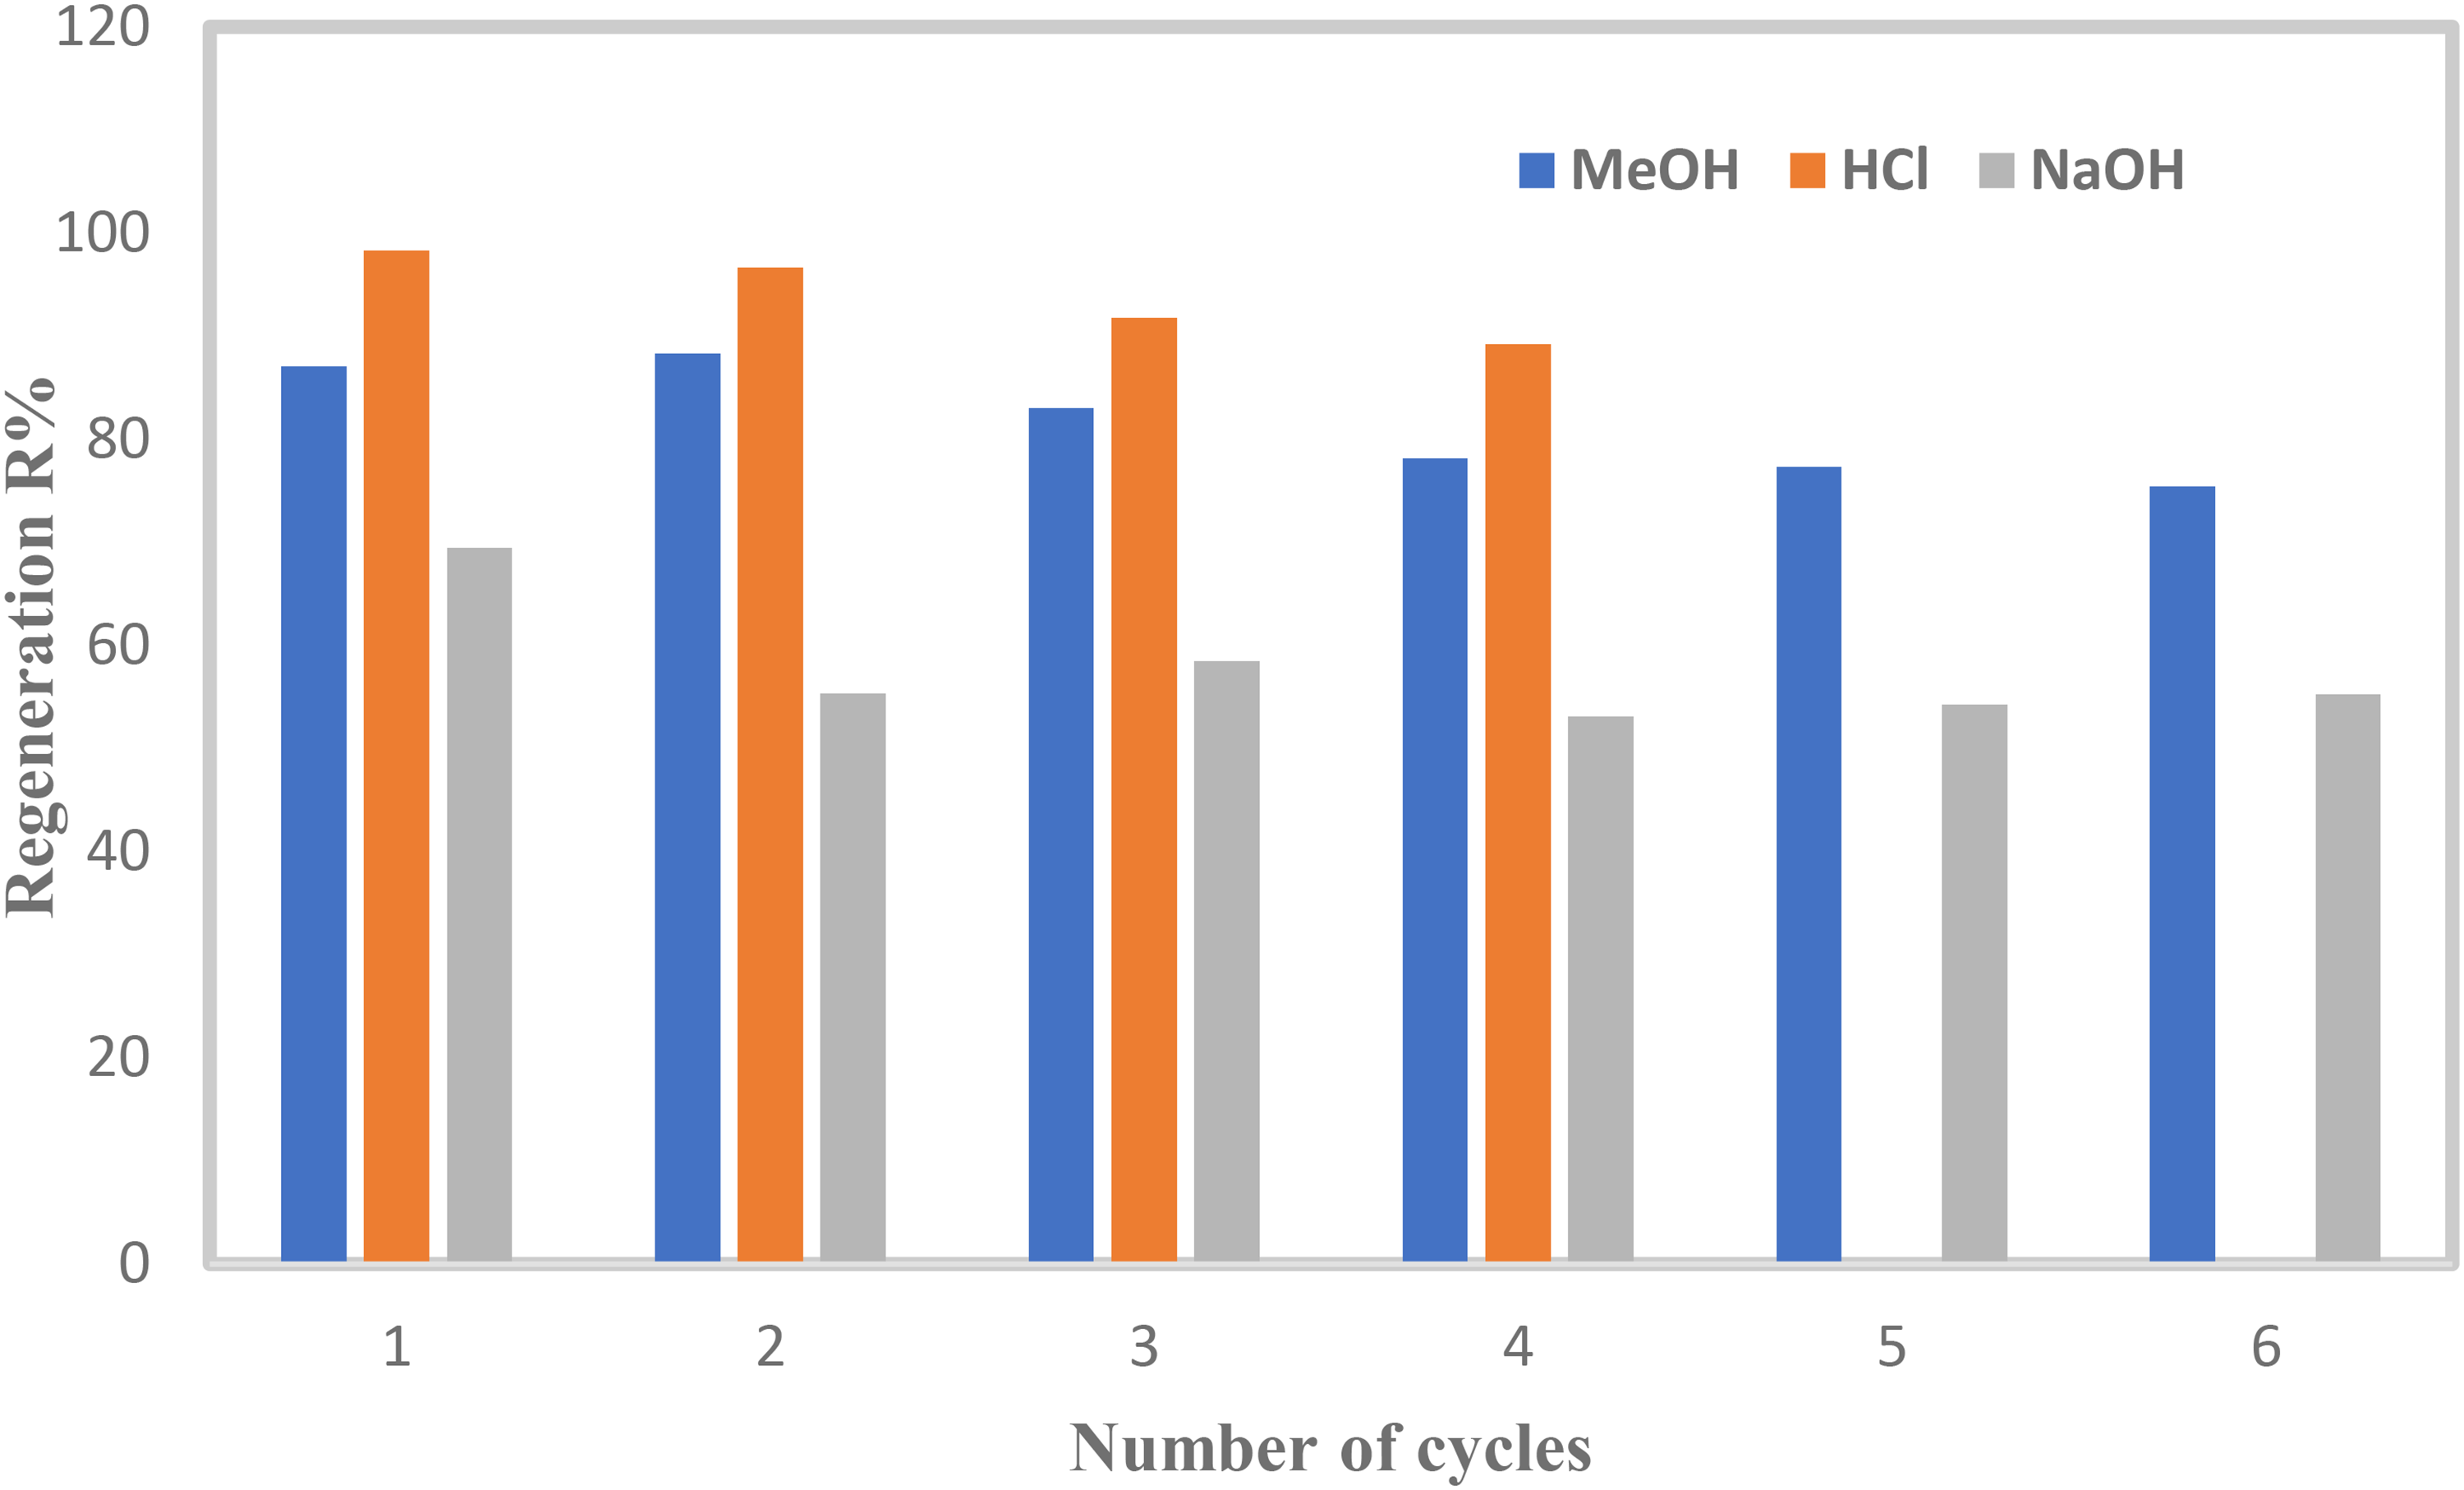
Regeneration cycles of AC-SA beads (weight = 0.080 g/20 mL, T = 25°C, VMB = 20 mL, no pH adjustment).
Recent studies further support the superior performance of acid-based regeneration. For instance, Kurnia et al. (2023) reported that acid washing effectively restores surface functional groups and enhances dye desorption efficiency in activated carbon systems. Likewise, contemporary reviews emphasize that organic solvents such as methanol can efficiently desorb cationic dyes by weakening hydrophobic and van der Waals interactions, thereby maintaining adsorbent stability over multiple cycles (Al-Asadi et al., 2025). In contrast, NaOH regeneration exhibited noticeably poorer performance in the present study. The initial desorption efficiency of approximately 69.45% declined sharply across subsequent cycles, reaching only 55% by the sixth cycle. This reduced effectiveness may be attributed to alkaline-induced structural changes, partial dissolution of surface functional groups, or irreversible dye–adsorbent interactions, which have also been documented in recent investigations on alginate-based and biochar-composite beads (Bahsaine et al., 2023). Overall, the results confirm that while AC-SA beads possess good reusability, the choice of eluent plays a critical role in sustaining long-term adsorption performance.
Conclusions
This study examined the efficiency of removing MB from wastewater using a mixed palm date pits activated carbon encapsulate in sodium alginate beads. SEM, EDX, XRD, FTIR, and pHzpc techniques were used to characterize these beads exhibiting rough surface with pores in cavity form beside their swelling behavior which is 115% in 120 min. In order to determine the optimal conditions that resulted in the most removal of MB, adsorption tests were conducted. The factors that were assessed included initial dye concentration, adsorbent dosage, pH, temperature, and contact time. The maximum MB adsorption capacity on AC-SA was 23.529 mg/g at 25°C and pH values ranging from 8 to 10, which was impacted by the pH at the Point of Zero Charge of 8.2. The adsorption data are best described by pseudo-second order and the Langmuir and Freundlich isotherm models. Studies on regeneration using 98% methanol, 0.1 M HCl, and 0.1 M NaOH showed that the beads retained good reusability. In the end, the outcomes verified that the inexpensive biocomposite beads could be recycled and successfully extracted MB from aqueous solutions.
Supplemental Material
sj-docx-1-adt-10.1177_02636174261429590 - Supplemental material for Activated carbon derived from date pit and sodium alginate, application to the adsorption of methylene blue from aqueous solution: Equilibrium isotherms, kinetic study, and regeneration
Supplemental material, sj-docx-1-adt-10.1177_02636174261429590 for Activated carbon derived from date pit and sodium alginate, application to the adsorption of methylene blue from aqueous solution: Equilibrium isotherms, kinetic study, and regeneration by Nada Lina Rabhi, Mohamed Lamine Sekirifa, Youcef Touil, Hakim Belkhalfa, Lokmane Abdelouahed and Ammar H. Al-Dujaili in Adsorption Science & Technology
Footnotes
Acknowledgement
This project is part of the PRIMA PHYBIOMED Program supported by the European Union.
Funding
The authors received no financial support for the research, authorship, and/or publication of this article.
Declaration of conflicting interests
The authors declared no potential conflicts of interest with respect to the research, authorship, and/or publication of this article.
Supplemental material
Supplemental material for this article is available online.
References
Supplementary Material
Please find the following supplemental material available below.
For Open Access articles published under a Creative Commons License, all supplemental material carries the same license as the article it is associated with.
For non-Open Access articles published, all supplemental material carries a non-exclusive license, and permission requests for re-use of supplemental material or any part of supplemental material shall be sent directly to the copyright owner as specified in the copyright notice associated with the article.