
Abstract
High-quality simulation of fabric structural features is significant for realizing the morphological prediction of nonuniform mesh structures and building numerical simulation of physical properties. For lace textiles which have hundreds and thousands of variable meshes, an objective and unified standard to evaluate structural deformation is quite challenging. It needs to comprehensively and quantitatively conclude a result, instead of visual and subjective judgment. Therefore, this paper proposed an image-based method to mathematically solve accuracy by comparing morphological features from both simulation result and real fabric photograph. Jacquardtronic lace textiles were fabricated as experimental samples. Based on morphological expansion and corrosion algorithms, non-characteristic lapping details were eroded from binary images with only featured single-pixel contours of irregular meshes. Shape descriptor of each featured image was represented by a moment vector of seven Hu invariant moments. Then the morphological vectors of both simulated and real fabric images were substituted into a defined equation of similarity measurement. This image-based evaluation model effectively avoids defects of subjective visual observation and geometric measurement methods.
Keywords
Introduction
Loops in nonuniform knitted mesh structures are complicatedly interlocked with complicated interaction force, causing irregular meshes of different sizes and shapes. Except for appearance visualization, high-quality simulation is of great significance for realizing numerical prediction of physical properties because it’s generally performed under critical thermodynamic parameters. Therefore, it requires extremely high accuracy of simulation results which can be verified by comparing the similarity between simulation and real fabrics. With analyzing the characteristics of non-uniformed knitted mesh structures, we know that computerized simulation of this structure is mainly to simulate the mesh morphology with certain features.
Researches on knitted textiles simulation that have been conducted mainly focused on the model establishment of loop geometries,1–5 deformation mechanism of structures,6–9 and visualization of textiles appearance.10,11 Few studies were done on evaluation of simulation results. Traditional method basically relies on subjective judgment by manual measurement and visual comparison with real samples, from the aspects of mesh area, maximum diameter, and contour circumference. This subjective approach was mostly based on experience and didn’t have a general and unified evaluation standard, which resulted in doubt about scientific credibility. When dealing with structures that had massive stitches and irregular meshes, it was quite time-consuming and challenging.
In the pursuit of an objective solution, digital image processing gradually showed significant advantages during the past decades in textiles detection, performance inspection, and simulation.12–16 It takes use of a computer to process digital images of textiles based on certain algorithms for a concrete application of image segmentation, classification, feature extraction, shape description, morphological analysis and pattern recognition, etc.17–20 Evaluating simulation result by digital image processing is to compare the similarity and difference from real sample image, which requires to extract image features first. Feature extraction is mainly based on image texture features and edge features in target detection and similarity decision-making.21,22 The former method though covers plenty more image message, it has possibility of being interfered from external factors such as lighting conditions and shadows, thereby reducing the decision accuracy. The edge feature method is comparatively more resistant to lighting and external environment interference, and it records target feature data based on local contours. This characteristic well coincides with the studied non-uniform knitted meshes whose boundaries are all closed curves with no cross-overlapping problems. Hence, the edge feature-based method is selected. Edge detection aims at identifying boundaries of objects within an image by detecting discontinuities in brightness and organizing these boundary points into a set of curved line segments.
Among many methods for edge detection, Canny edge detector23,24 is the one of the most popular operators by using a multi-stage algorithm to detect a wide range of target edges with precious methodology. But there is a possible defect that when Gaussian filter is used for noise reduction it will also smooth the edge feature and moreover it has high complexity when operation. Compared with this, morphology-based technique can be easily implemented because of conceptual simplicity of basic morphological operators. They were based on using difference between the dilation and erosion of the target image.25,26 It can simplify image data by maintaining primary shape characteristics and remove irrelevant details.
Therefore, based on the above statement this paper selected morphology-based edge detection algorithm to extract features from simulated result and its real sample image for further similarity measurement. This digital evaluation model avoids defects of subjective visual observation and manual measurement methods and more importantly it saves much time and labor consumption.
Methodology
Dilation and erosion
As two fundamental morphological processing operations, dilation and erosion are widely used for removing noises, isolating independent image components, and joining disparate elements in binary or greyscale images. Dilation involves adding pixels to enlarge an object regions. It uses a disk of pixels to scan over the image object and the maximum pixel value overlapped by this disk is computed to replace the image pixel at the origin position. Erosion reversely removes pixels at boundaries by computing local minimum pixel value overlapped and replaces. The disk of pixels was designed as a structuring element, which is a matrix with its origin being located at the geometric symmetry center to identify the pixel being processed.
Figure 1(a) shows a binary image I0 (Figure 1(a)) of one jacquard mesh. By defining a 5 × 5 structuring element E1(Figure 1(f)), the image is firstly eroded to get I1 (Figure 1(b)) by eliminating bright pixels beyond the mesh area. However, this operation has shrunk the mesh size. Then, a dilation is conducted to enlarge the mesh to original size and labeled as I2 (Figure 1(c)). To further extract the featured contour of this bright mesh, a difference operation between I2 and its erosion result I3 (Figure 1(d)) was performed according to equation (1). A new 3 × 3 structuring element E2 (Figure 1(g)) was used in this operation for get a single-pixel featured image I4(Figure 1(e)). This I4 has removed irrelevant similarities and highlighted boundary differences.


(a) I0, (b) I1, (c) I2, (d) I3, (e) I4, (f) E1, and (g) E2.
Shape feature descriptor
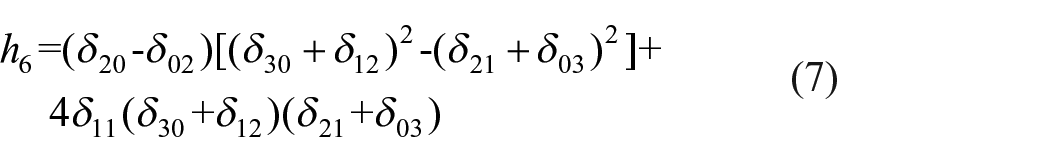
When quantitatively solving similarity of two featured images, they are represented with shape feature descriptors for numerically calculating. The mostly used are shape number, Fourier descriptor, statistical moment, and Hu invariant moment. Shape number is represented by chain codes which depend on the first encoder and transmitting direction. Encoding quantities of irregular patterned meshes results in a extremely long code chain to reduce computation efficiency. Although Fourier descriptor improves computation, its encoding result is similarly based on the selection of starting point. Statistical moments simply use one-dimensional functions and probability histograms to record contour features, being independent in the cases of image translation, rotation, and size changes. When it deals with numerous closed mesh contours, each one needs to be segmented, rotated, and counted, resulting in large amount of calculation. Hu invariant moments are a set of seven moments calculated based on central moments. These seven Hu invariant moments are also independent in image translation, rotation, scale changes, and reflection. Hereby, Hu invariant moments are preferred in this study to represent morphological characteristics of variable mesh textiles. Seven invariant moments h1 to h7 of featured images are respectively calculated using the following seven equations. Each invariant moment h has a positive linear combination of second and third normalized unification moments δ.


Experimental
For fully exploring reliability of this evaluation method, two types of Jacquardtronic lace textiles were fabricated as experimental samples S1 and S2. This type of lace textiles had so complex structures. They were knitted with thousands of irregularly deformed meshes in quite different shapes and sizes.
Machine
Samples were respectively knitted by multibar-jacquard Raschel machines MJ 42/1B and JL65/1B (KARL MAYER (China) Ltd.). S1 and S2 both used two split piezo-jacquard guide bars and one pillar ground bar for irregular meshes. S1 took 36 inlay pattern bars for generating 3D motifs while S2 took 25 inlay pattern bars.
Yarns of ground meshes were supplied by positive let-off beams ensuring constantly uniform yarn tension. Inlay patterns had optimum uniformity of yarn consumption so negative let-off creels were preferred. Gage of MJ 42/1B and JL65/1B were E24 and E18.
Materials
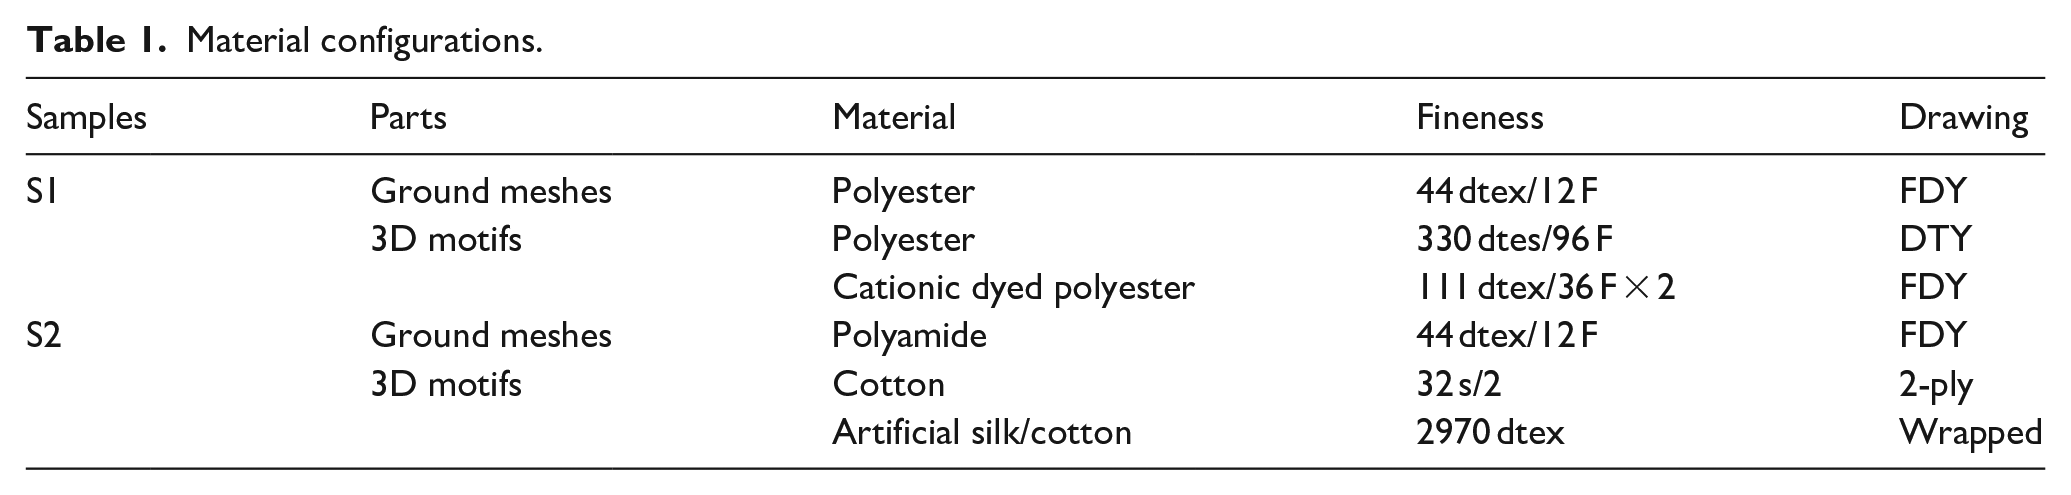
Ground mesh nets and patterns of S1 and S2 were knitted by the materials illustrated in Table 1.
Material configurations.
Structures and simulation
Structures and technique parameters of these two samples were designed on a warp-knitting computer-aided design system (WKCAD4.0 from Jiangnan University). Loops density of S1 was 21 courses and 12 wales in 1 cm2, that of S2 was 24 courses and eight wales. Then based on the researched simulation approach with mass-spring model, 7 jacquard samples S1 and S2 were simulated in Visual Studio platform and then output as image files.
Sample images
Fabricated samples were photographed in a stationary state under natural light, using a digital microscope Dino-lite produced by AnMo Electronics Corporation. The photographs were then output as same format files in Figure 2 with the simulation results. These images were all processed via the MATLAB R2016b program to extract morphological features and solve similarity.

Photographs and simulation results of samples S1and S2: (a) photograph of S1, (b) simulation of S1, (c) photograph of S2, and (d) simulation of S2.
Results and discussion
Image pre-processing
Since jacquard mesh samples were knitted in a certain fabric width with four-way continuous repeats, the experimental images in Figure 2 were partially captured from textile photographs and simulation results. To reduce errors caused by the size differences, these input images need to be firstly re-sized before binary operation. Based on number of knitted loops and the present features after resize, photograph and simulation result of S1 were re-sized as 600 × 600 pixels, while images of S2 were re-sized as 580 × 580.
The input PNG images were in RGB color mode which revealed nothing about morphological information. To avoid interference of color and reduce processing computation, the RGB images were firstly converted into grayscale ones. Meanwhile, to eliminate possible differences in photography brightness caused by ambient lighting, adaptive thresholding was employed in S1P and S2P binary operation to statistically determine optimal results. The adaptive thresholds of S1P and S2P were separately 149 and 124. Their curves of Gaussian membership functions were shown in Figure 3. It both presented two independent peaks and little overlapped session, indicating that the adaptive thresholds basically separated the gray values. While for S1S and S2S, background color of the lace textiles were set as white when conducting simulation, binary thresholds of these two images were defined as 204 to distinguish the white meshes and lapping areas.

Curves of Gaussian membership functions of: (a) S1P, (b) S1S, (c) S2P, and (d) S2S.
Results of samples S1 and S2 after binary were output as PNG files (Figures 4(a) and 5(a)). Pixels in black regions were quantized to 0 to represent overlapped stitching areas, while white pixels were donated as 1 to represent mesh areas.

Featured contours extraction of S1: (a) binary of S1P, (b) dilation of S1P-1 with E1, (c) erosion of S1P-2 with E1, (d) erosion of S1P-3 with E2, (e) mesh contours of S1P with single-pixel width, (f) binary of S1S, (g) dilation of S1S-1with E1, (h) erosion of S1S-2 with E1, (i) erosion of S1S-3 with E2, and (j) mesh contours of S1S with single-pixel width.

Featured contours extraction of S2: (a) binary of S2P, (b) dilation of S2P-1 with E1, (c) erosion of S1P-2 with E1, (d) erosion of S2P-3 with E2, (e) mesh contours of S1P with single-pixel width, (f) binary of S2S, (g) dilation of S2S-1 with E1, (h) erosion of S2S-2 with E1, (i) erosion of S2S-3 with E2, and (j) mesh contours of S2S with single-pixel width.
Mesh features extraction
Interference of pixels 1 in black areas were generated by holes between lapping threads. They needed to be firstly eliminated by eroding with meshes shrunk and then dilated to expand to original sizes. Both of the dilation and erosion were based on the structuring element E1. Afterward, another erosion with E2 was conducted to obtain featured image contours of each sample image by a difference operation with equation (1). The processing was operated according to the flowchart in Figure 3. Processed results in Figures 4 and 5 basically presented morphological characteristics of jacquard meshes in S1and S2.
Similarity solving
Featured vectors and


Similarity between the sample photograph and the simulation, namely the deformation simulation accuracy, was denoted by

Experiment errors were possibly resulted by the following reasons.
a.″When experimental images were captured, it was quite challenging to precisely and equally select loops and meshes on the image edges because of uniform fabric deformation. This resulted in different amount of structural features in sample images.
b.″Since the fabricated fabrics had a heat-setting process, stress relaxation occurred inside the Jacquardtronic structures. The relaxation resulted in stretched and bent jacquard underlaps at the bottom and top of meshes, affecting the recognition of mesh contours (Figure 6).
c.″The samples contained evenly and densely distributed tiny meshes, some of which was knitted by one or two jacquard lapping unit and separated by only one loop wale(Figure 7). Hairiness of the DTY yarns probably covered part of a mesh area. Then in binary operation, the tiny mesh was divided into two smaller meshes. Then during erosion, the tiny thread wales were easily eroded as lapping holes, which reduced number of meshes in featured photographs.

Similarity solving error from yarn stress relaxation. Enlarged parts of: (a) jacquard and lapping design, (b) S1P, (c) S1P-3, (d) S1P-5, (e) S1S, (f) S1S-3, and (g) S1S-5.

Similarity solving error from erosion of one-wale pixels. Enlarged parts of: (a) S2P, (b) S2P-3, (c) S2P-5, (d) S2S, (e) S2S-3, (f) S2S-5, and (g) jacquard and lapping design.
To further comprehensively compare simulation results based on mass-spring method, the design sample S1 was used to conduct another simulation using the loop geometry-based method. Simulation result S1G and its morphological feature images based on the above dilation and erosion method were shown in Figure 8. Its feature vector

Featured contours extraction of S1G: (a) binary of S1G, (b) dilation of S1G-1 with E1, (c) erosion of S1G-2 with E1, (d) erosion of S1G-3 with E2, and (e) mesh contours of S1G with single-pixel width.
Similarity between the S1S and S1G was calculated according to equation (9) to be 96.27%, which revealed a positive advantage for the proposed mass-spring method. From observation of S1G, it was known that meshes obtained based on loop geometry approach were approximately similar to rectangle outlines with only differences in size. This was obviously distinguished from the irregular meshes formed by loops in fabricated samples under complex inner forces.
Image scaling
Furthermore, the size of the grayscale images could cause change of shape features and the erosion and dilation operations could change correspondingly. Therefore, an image scaling experiment was conducted to study the relationship between image size and feature vectors. S1S was used as an example to be re-sized from 250 × 250 pixels to 1000 × 1000 pixels in 50 × 50 pixels increment. Seven Hu invariant moments of S1S and S1S-5 were respectively solved in the following Figure 9(a) and (b). Similarities between re-sized S1P-5 and S1S-5 were shown in Figure 9(c). Mesh contours of S1P-5 with 250 × 250, 600 × 600,and 950 × 950 pixels were shown in Figure 9(d).
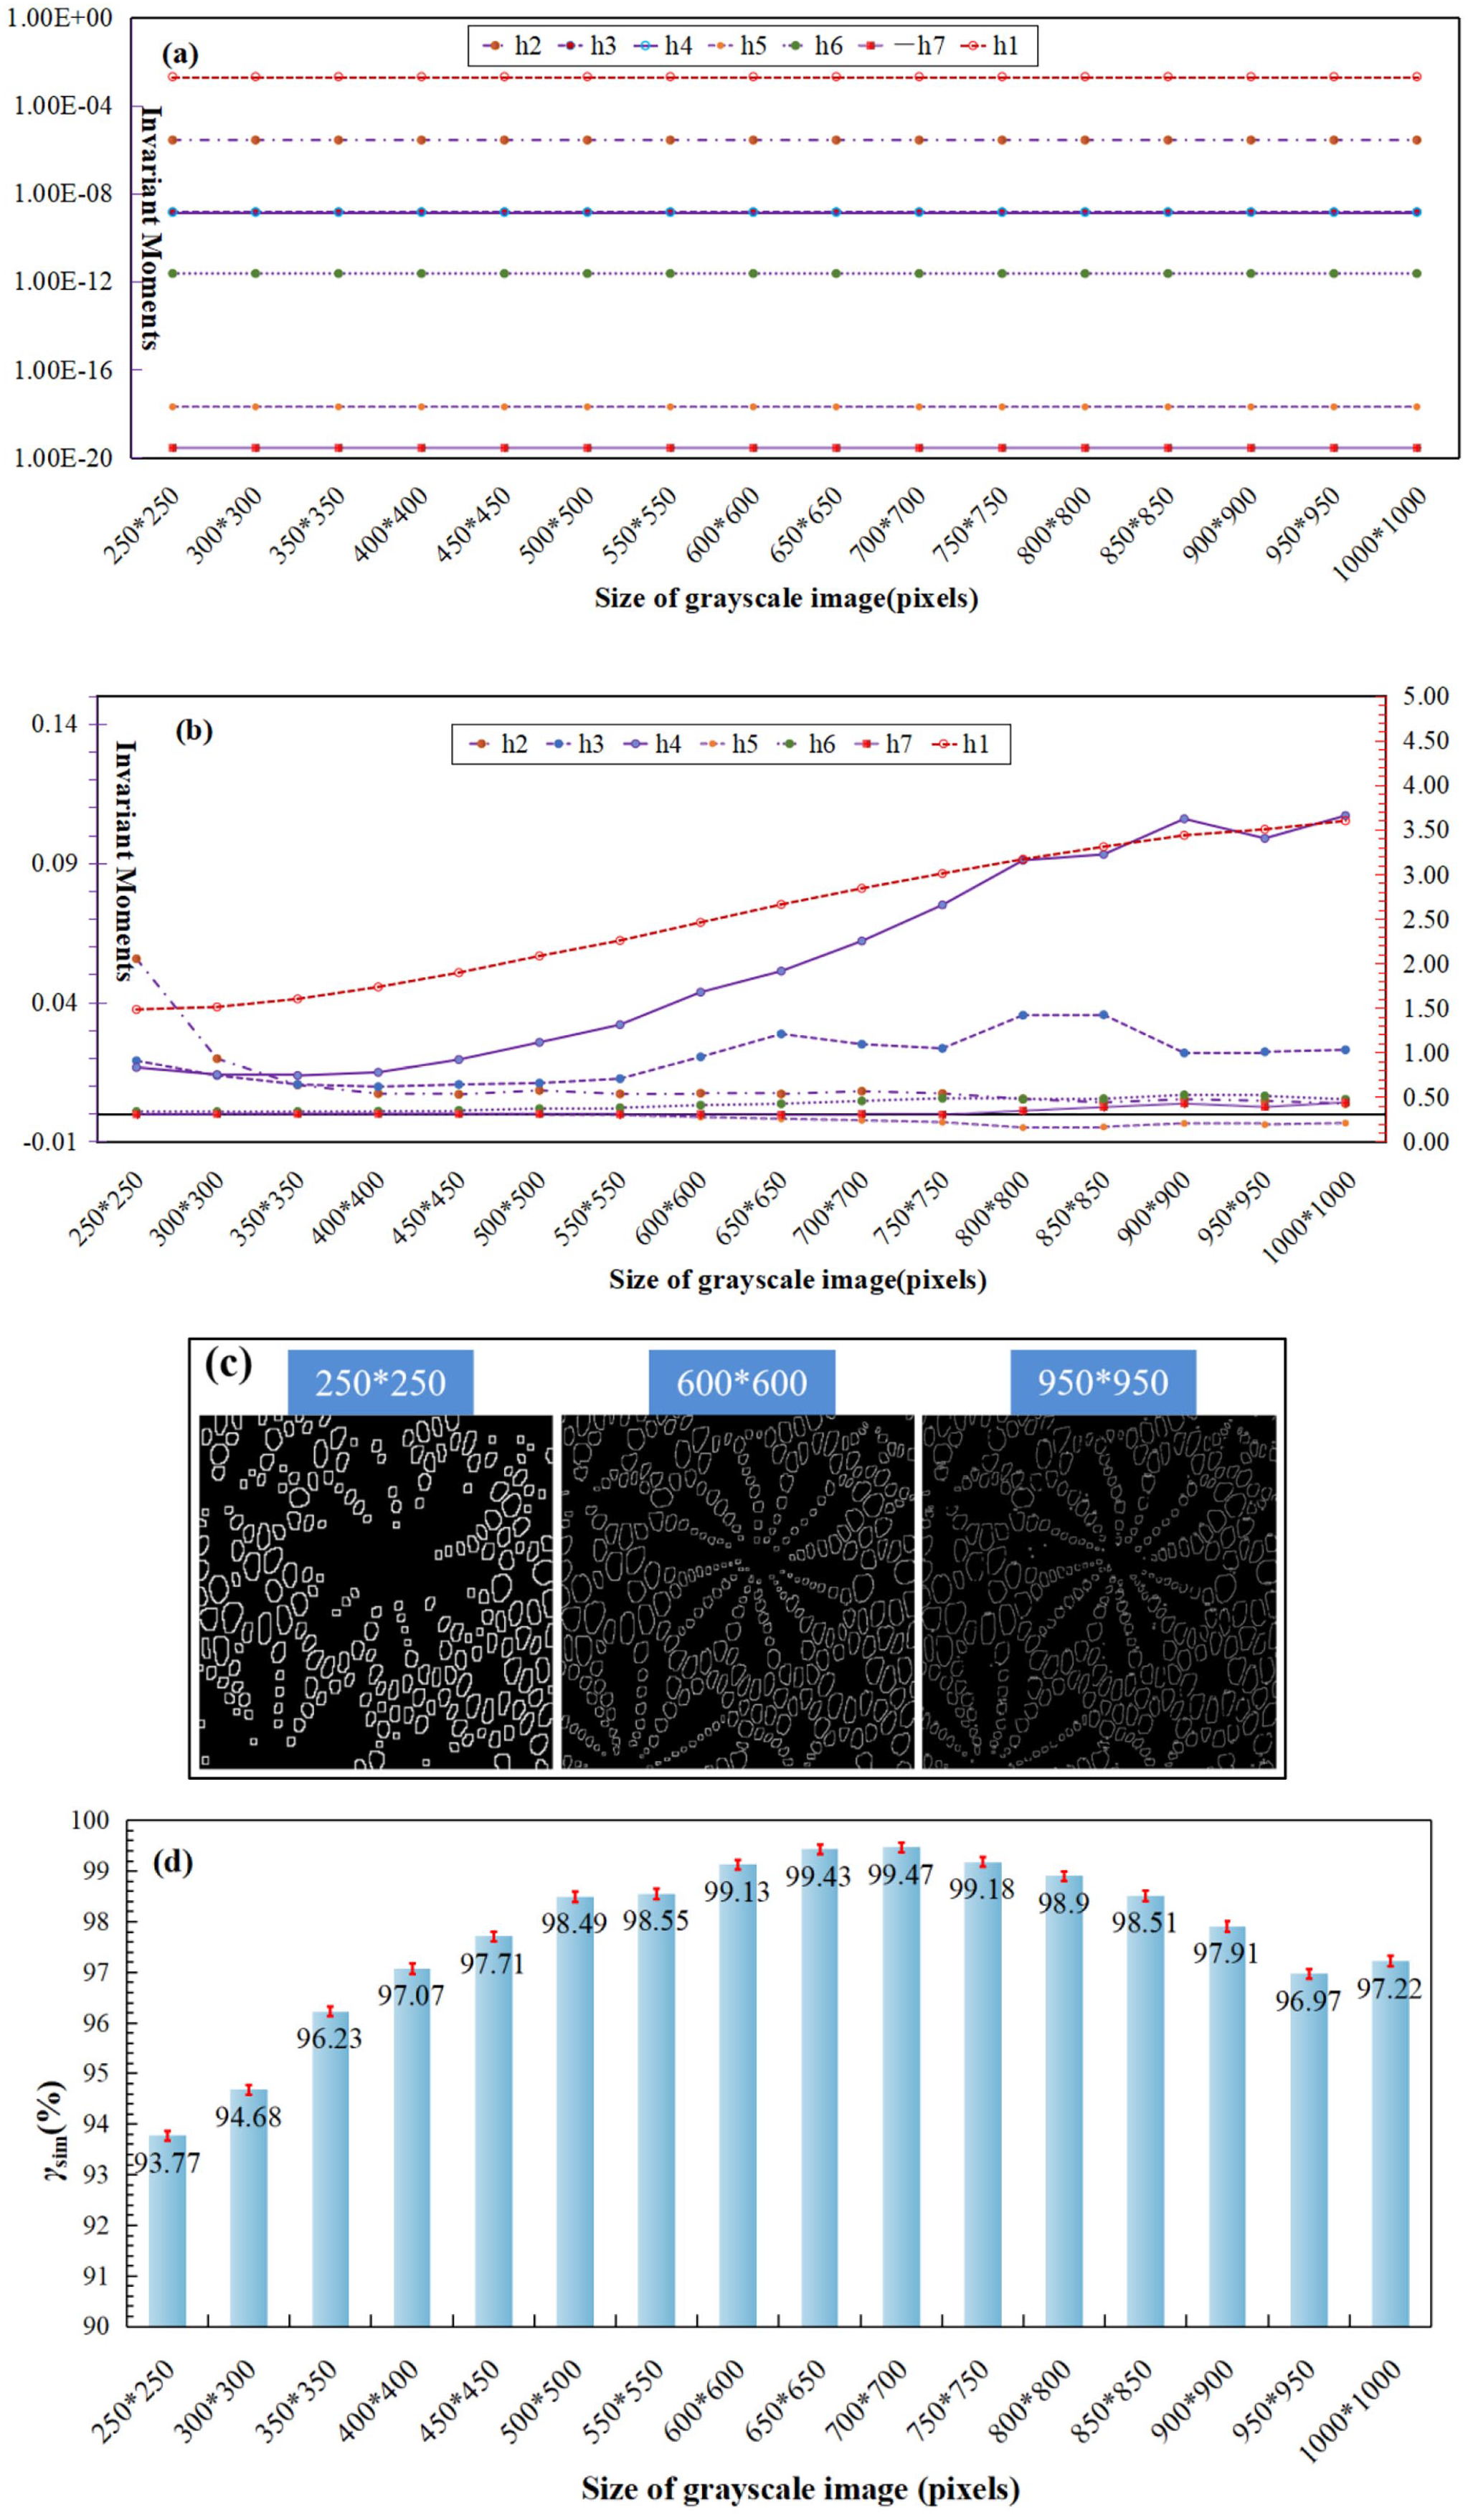
Resizing results of: (a) Hu invariant moments of S1P and (b) S1P-5, (c) mesh contours of single-pixel width, and (d) similarities between S1P-5 and S1S-5.
From Figure 9(a), it revealed that with size changing of S1P, seven moments were all invariant to image scaling. This proved good practicability of Hu moments as shape descriptor. In Figure 9(b), with pixels increasing, values of h2, h5, h6, and h7 were approximately invariant and a slight fluctuation of h3 appeared. However, h4 and h1 moments showed a positively linear to the image size. By comparing images in Figure 9(c), it was known that image scaling made an obvious difference on the mesh features in erosion and dilation. This caused omission of necessary mesh data in 250 × 250 pixels scale and interfering with non-target features in 950 × 950 pixels scale. In Figure 9(d), similarity between S1P and S1S was steadily growing from 93.77% with 250 × 250 pixels to 99.47% with 700 × 700 pixels. Afterward, with the size continuously increasing, the similarity slowly began to make a slight drop to 96.97% with 950 × 950 pixels. Although similarity of 93.77% is acceptable, mesh features of S1P with 250 × 250 pixels was quantitatively lost, resulting in obvious difference to the fabricated sample. Therefore, it hardly reflected the simulation accuracy of the mass-spring model. Oppositely, features of non-mesh structures in the image of 950 × 950 pixels were maintained. When erosion, the holes between pattern bar lappings were mistakenly regarded as jacquard meshes to be saved. The similarity of 96.97% couldn’t be used to evaluate the accuracy of the simulation accuracy either. By observing re-sizing results of mesh featured images, the size of S1 was preferred to define from 500 × 500 to 650 × 650 pixels with similarity ranging from 98.49% to 99.43%.
Conclusion
This research has proposed a graphic morphology-based method to quantitatively and effectively evaluate structural deformation simulation results of warp-knitted lace textiles with mass-spring model. Because simulation focused on irregular deformation of jacquard mesh structures, this method used morphological erosion and dilation operations to extract mesh features from both photograph of fabricated sample and simulation image. Then the similarity was quantitatively calculated between these images using shape descriptors. This image-based evaluation approach obtained positive results and good practicability by fabricating Jacquardtronic lace samples and conducting image processing experiments. It effectively avoided defects of subjective visual observation and geometric measurement methods. Conclusions were drawn as follows.
(1)″After erosion and dilation operation, lapping patterns and images colors were eliminated from the simulation and samples images, saving only deformed and irregular jacquard meshes. Based on square structuring elements of 5 × 5 pixels and 3 × 3 pixels, morphological features of jacquard mesh structures were represented with single-pixel mesh contours after conducting a difference operation.
(2)″Hu moments presented invariant performance and good practicability as shape descriptor of morphological feature image. However, unreasonable low resolution caused data omission of small meshes during background erosion. Reversely, unreasonable high resolution mistakenly maintained some non-target lapping holes as mesh structures in erosion. S1 and S2 were respectively re-sized as 600 × 600 pixels and 580 × 580 pixels. Their moment vectors of single-pixel width featured images were sequentially iterated into a similarity equation and solved as 99.13% and 94.51%. The results revealed positive evaluation on deformed simulation with mass-spring model.
(3)″Experiment errors during morphological processing resulted from image capturing and mesh feature extraction. Because of uniform deformation and quite tiny sizes, loops on the image edges were hardly to be precisely and equally selected between sample photographs and simulation images. Additionally, stretched and bent jacquard threads due to stress relaxation and hairiness of DTY yarns probably covered part of a jacquard mesh, interfering recognition of mesh contours.
Footnotes
Declaration of conflicting interests
The author(s) declared no potential conflicts of interest with respect to the research, authorship, and/or publication of this article.
Funding
The author(s) disclosed receipt of the following financial support for the research, authorship, and/or publication of this article: This work was partly supported by the grants (61902357 and 51973027) from the National Natural Science Foundation of China, the Fundamental Research Funds for the Central Universities (2232020A-08 and 2232020D-12), International Cooperation Fund of Science and Technology Commission of Shanghai Municipality (21130750100). This work has also been supported by the Chang Jiang Scholars Program and the Innovation Program of Shanghai Municipal Education Commission (2019-01-07-00-03-E00023) to Prof. Xiaohong Qin.