
Abstract
The slub denim has various appearance styles that attract consumers due to the irregular distribution and long cycle of the slubs in the slub yarn. This characteristic of the slub yarn makes the slub denim proofing that relies on artificial visual contrast time-consuming with a long design cycle. A visual similarity simulation method was proposed for slub denim based on slub yarn images to solve this problem. At first, the yarn images were pre-processed by grey-level transformation, image threshold segmentation, and morphological operations to obtain the yarn core images. Secondly, according to the elastic change of yarn in fabric structure, the elliptic and sine curve models were established to treat the string to obtain the actual yarn shape in the fabric. Then, a light intensity curve function, which consists of a radial curve model and an interlacing point curve model, was established to simulate the light intensity distribution on the yarn surface. Finally, the cover relation of warp and weft yarns was controlled by Boolean matrix, and mean filtering was used to adjust the fuzzy denim fabric images. The experimental results show that the slub denims simulated by the method proposed in this article have a high visual similarity with the actual slub denims. Meanwhile, multiple parameters of the simulation model established in this article can be adjusted to enhance the adaptability of the model and the accuracy of the simulation results.
Slub denim has a distinctive appearance related to the length, thickness, and inter-slub separation distance of the slub. The variations of slub yarn parameters will change the fabric style. The appearances of the same fabric vary obviously at different positions. Slub denims are usually woven from dark slub yarns as warp and white normal yarns as weft. Figure 1 exhibits the diverse appearances of the slub denim. The enlarged views of the fabrics show the characteristic of the colored warp and white weft. The particularity of slub yarn makes the sample preparation or sample imitation of denim fabric complicated and tedious. Traditional slub denim proofing usually adopts a manual analysis of slub yarn parameters. The specifications of slub yarn are obtained by the sample analysis. After trial spinning and weaving, parameters are revised by comparing with the appearance of the denim fabric sample. The proofing process is repeated until it is consistent with the appearance of the sample. The traditional proofing method cannot cope with the flexible production of small batches and multiple varieties. Therefore, the computer simulation of slub denim is necessary to achieve the rapid proofing of the fabric.
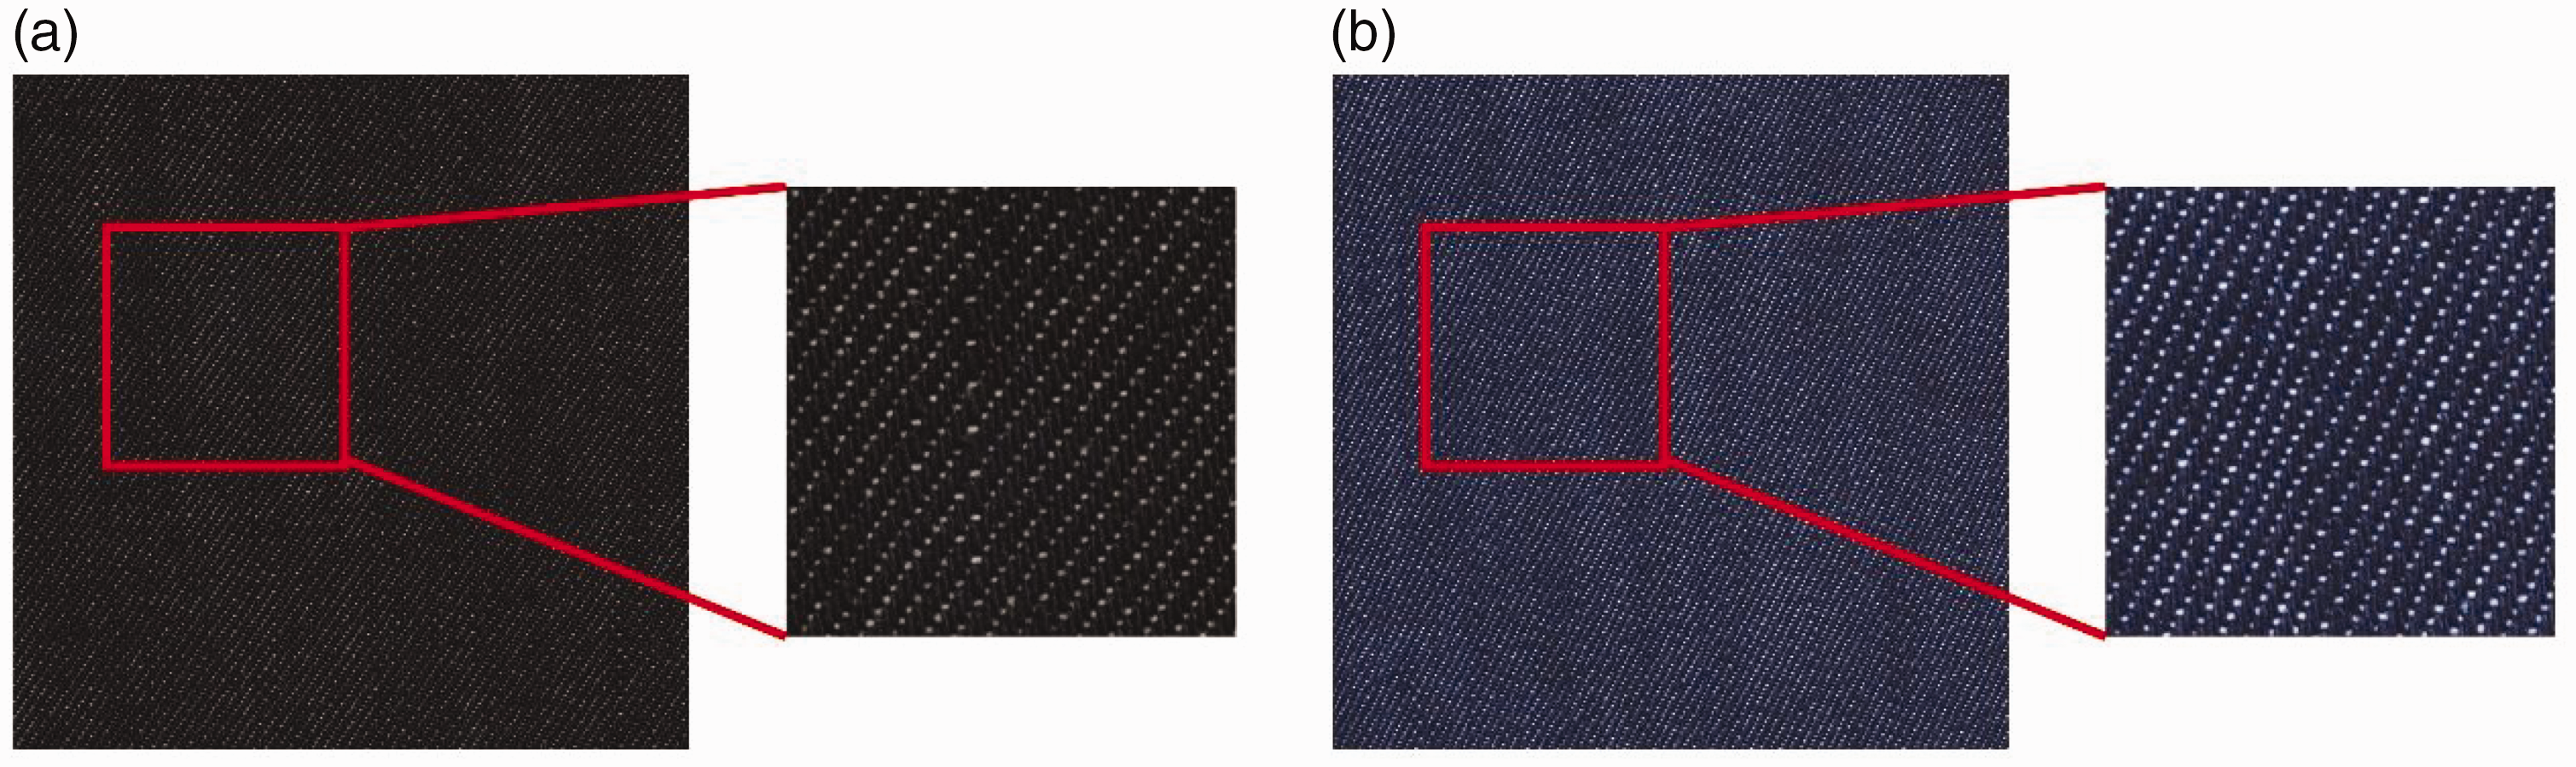
The particularity of the slub denim: (a) black slub denim and (b) blue slub denim.
With the development of computer image processing technology, many researchers have successfully applied it to the textile field, such as uses in fabric defect detection and classification,1,2 fabric wrinkle rating,3,4 fabric and cloth retrieval and classification,5,6 fabric pattern recognition, 7 and so on. Using image technology to simulate digital woven fabric (DWF) can replace the proofing process and predict the woven fabric’s appearance. 8 This method can improve proof efficiency and save considerable labor and material resources. At present, different studies have been carried out to simulate woven fabrics. The initial typical fabric simulations were generally based on yarn images artificially constructed from given or measured yarn parameters by mathematical algorithms.9 –12 These methods could simulate the color and texture of the fabric but were far from the actual fabric appearance. Subsequently, some scholars proposed using real yarn images as the basis for fabric simulation.8,13 –16 These methods generally used a camera or scanner to acquire the yarn images. Then the images were processed and filled into the established fabric models to obtain the simulation results. These methods could provide more realistic results of fabric appearance. However, these methods had some shortcomings. For example, the yarn model could not wholly reflect the shape of yarn in the fabric; the size of simulation results was limited; and the light intensity curve model was missing in the simulation. 8 For normal yarn or colored spun yarn, the methods mentioned above could realize more real fabric simulation. But the limited size and without light simulation methods could not accurately simulate the actual appearance of slub denim due to the dark color of slub yarn and the long cycle period of slub. The simulated results were very different from the actual slub denim visually.
With the development of computer technology, three-dimensional (3D) simulations of the fabrics have been discussed. At first, a mass-spring system was used to simulate fabrics directly.17,18 Subsequently, some scholars established a finite element model of the fabric. 19 Then, the B-spline method20 –22 and the differentiable physical models23 –25 were proposed to simulate yarn-level fabrics. Recently, the behaviors of the fabrics have been brought into focus. The scholars used a novel knitting computer-aided design (CAD) system, 26 the parameterized modeler, and the interactive simulation plug-in 27 or coupled meso-macro simulation28,29 to predict the relaxation, shape change, drape, and mechanical properties of the fabrics. The advantages of 3D appearance simulation of fabrics are the volumetric representation, macro-physical deformation of the fabric, and the realistic rendering results. High-quality yarn models with fiber details can make woven simulation results with more realistic visual effects.30,31 But the coordinate calculations and rendering of hundreds of fibers are time-consuming and memory-consuming. This is especially true for fancy yarns with complex structures (loop yarn, slub yarn, big-belly yarn, etc.). At the same time, the 3D simulation method has very little interaction with the user during the simulation processing. These factors make it difficult for non-professionals to use these methods to complete the simulation of fabric appearance. Two-dimensional (2D) simulation methods for woven fabrics are less specialized and less time consuming, and easier to calculate. The designers can complete a large number of interactive operations when using them. These features make the 2D simulation of woven fabrics more suitable for replacing the fabric appearance design and proofing process in the production of textile enterprises.
This article aims to address the challenges and difficulties in proofing slub denims due to the unique characteristics of slub yarns. These challenges include simulating larger-size results, adjusting fabric parameters and starting points of slub yarn in the model, modifying the existing yarn model, and adding a light model suitable for cotton yarn on its surface. Based on previous studies, this article presents a method for simulating the appearance of slub denim with high visual similarity compared with the actual fabric image. The main contributions of this article can be summarized as follows:
A fast two-dimensional simulation method is proposed for slub denim based on the slub yarn images. Our simulation results have a high visual similarity with the actual slub denims. Compared with existing methods based on the actual yarn images, our method improves the structure model of the yarn in the fabric and adds the light intensity curve model to the surface of the yarn image to make the simulation results have the actual appearance of the slub denim. To enhance the adaptability of the model, multiple parameters of the model can be adjusted manually.
The rest of this article is organized as follows. The second section introduces related works. In the third section, we introduce our methods with detailed descriptions. The fourth section describes the experiment implementation. The experimental results, analysis, and discussion of the methods are shown in the fifth section to verify our method. Finally, the article concludes in the sixth section.
Related works
Generally, 2D simulation methods for woven fabric appearance can be divided into the mathematical model and the actual yarn image method. The first class of methods can simulate woven fabric appearance and design weave patterns, and it also has the function of predicting the final color of woven fabric. For the studies of simulating woven fabric based on actual yarn images, the process is broadly divided into three parts: yarn image capture and pre-processing, resizing the yarn model, and completion of the appearance simulation. Different studies differ in details, such as the yarn pre-processing way and yarn model, and some scholars added the light model to the yarn surface.
Mathematical model method
Several textile CAD systems were developed with different functions in the early research stage. The Scottish College of Textiles (SCOT) weave system 32 could simulate virtually any woven structure and has the unique facility of tying out some of the threads to obtain over-check effects. The textile and weaving industries by GEMS (GEMWEAVE) is a complete computer-aided design and manufacturing (CAD/CAM) system for jacquard weaving. 33 The final output of this system is a set of error-free, automatically punched jacquard cards for the loom. Hill 34 used a reactive/disperse dye system to simulate the color effect of cross-printing of flax/polyester-fiber fabrics. Hoskins and King35,36 developed an interactive database for woven fabrics for twill, satin, diced, herringbone, etc. But the weave could not be more than 16 shafts. Rehr 37 reported a system that could show the appearance characteristics of plied yarns and effect threads. Pascual et al. 12 designed an interactive package for woven fabrics. This software contains a great deal of user interaction. Everything from the determination of fabric weave to the selection of yarn colors and groups is done by users. The final output fabric appearance is achieved by assigning values to continuous pixel points.
Denton and Seth 38 made two improvements to the woven CAD systems. First, the most advanced graphic display and high-quality plotter were selected to make the density range of fabric simulation results more extensive. Second, the authors used a normal Gaussian distribution function to generate random numbers to simulate yarns and adjusted the color according to multiple colors of yarn selected by users. This system simulated the blended-fiber fabric appearances very well. With the continuous development of the woven CAD system, its functions, such as fabric weave design and fancy yarn linear design,39,40 have been perfected and could meet the product design needs of textile enterprises.
Deng et al. 41 started from the following three aspects to improve the system’s simulation results: the model of bending yarn in fabric, the spatial geometry model of interwoven yarn, and the parameterization of different yarns. And these researchers gave full consideration to the appearances of yarns, fabric structures, and parameters. A general model for the appearance simulation of woven fabrics was established, significantly improving the simulation quality. A subsequent study 42 considered the yarn’s reflection when illuminated. The methods proposed by Deng et al. can simulate the fabric appearances closer to actual fabrics. Liu et al. 43 proposed a rendering method based on yarn structure to block fibers in yarn ply. The ply, loop, and short hairiness models were established, respectively. The authors used a texture mapping method based on physically based rendering (PBR) to generate the ply appearance.
Actual yarn image method
Based on the yarn resizing mathematical models, Özdemir and Başer13 –15,44 completed the simulation of the 2D appearance of woven fabrics using photographed actual yarn images. This method is the first to apply actual yarn images to simulate the woven fabric appearance.
Zhang et al. 16 and Pan et al. 45 adopted an environment with a stable light source to capture colored spun yarn images and improved the segmentation processing to eliminate the lighter color around the yarn images. Meanwhile, Zhang 16 and Pan 45 both designed an algorithm for yarn image stitching, which made the models could simulate the large area appearance of the fabric. The improved models had a strong performance, fast simulation speed, and could flexibly adjust the yarn type, warp and weft densities, and simulation starting point of the simulation results. The adaptability of the models was strong, and the simulation results were more realistic. Li et al. 46 thought treating yarn as a cylinder before weaving was unsatisfactory based on a few findings. Their research considered yarn with an elliptical cross-section before weaving and improved the model presented by Özdemir and Başer. 13 By assembling dual charge-coupled device (CCD) sensors along the orthogonal direction of the yarn, a yarn surface-area measurement system (YSMS) was set up to capture the images of yarn along two orthogonal directions. The yarn diameters measured by two CCD sensors were used to calculate the section circumference of the ellipse model. The subsequent yarn resizing and fabric simulation methods were similar to previous methods. The appearance simulation of woven fabric was also realized.
Li et al. 8 proposed a light model for calculating the light intensity at a particular spot point on a surface, which can better show the light shading changes of the yarn interlacing in the plane simulation of fabric. Li et al.’s model matches the surface light intensity distribution of the actual yarn interweaving. Adding the light intensity curve model to the yarn image could make the woven fabric simulation results more realistic.
Methods
Image capture and pre-processing
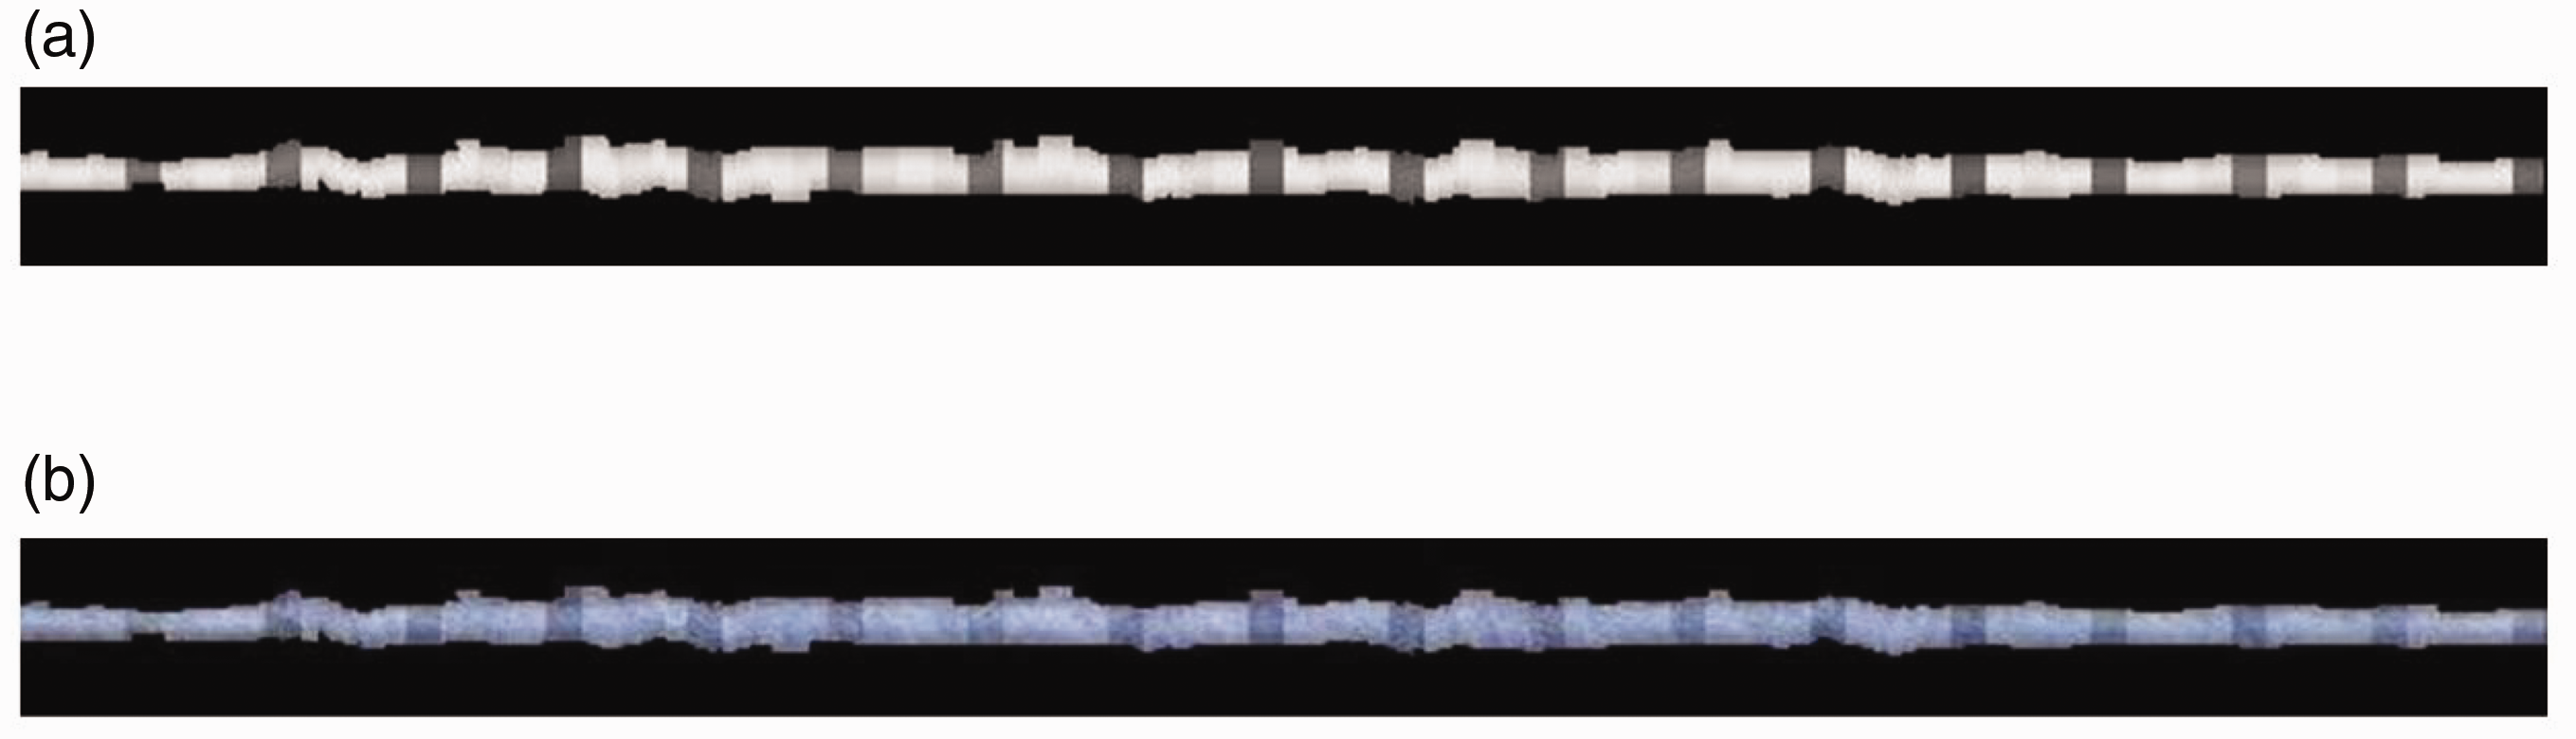
All slub yarns were collected from the factory. The images were captured in red green blue (RGB) mode using a scanner (Canon 9000F Mark II). The light source of the scanner was a white light-emitting diode (LED), which can guarantee a stable capture environment. Image resolution influences the simulation speed and result quality. From preliminary experiments, the resolution was set to 600 dpi in this experiment. Initially, scale calibration was conducted with a ruler. There are 2370 pixels in a range of 10 cm, i.e. the relationship is 237 pixels/cm. The color of the slub yarn is usually dark, so different background boards should be selected according to the color of the yarn. A blackboard was used for blue slub yarn and a whiteboard for dark blue or black. Figure 2 reveals the diagrammatic drawing of slub yarn. Figure 3 shows the results of scanning slub yarns with different colors respectively.
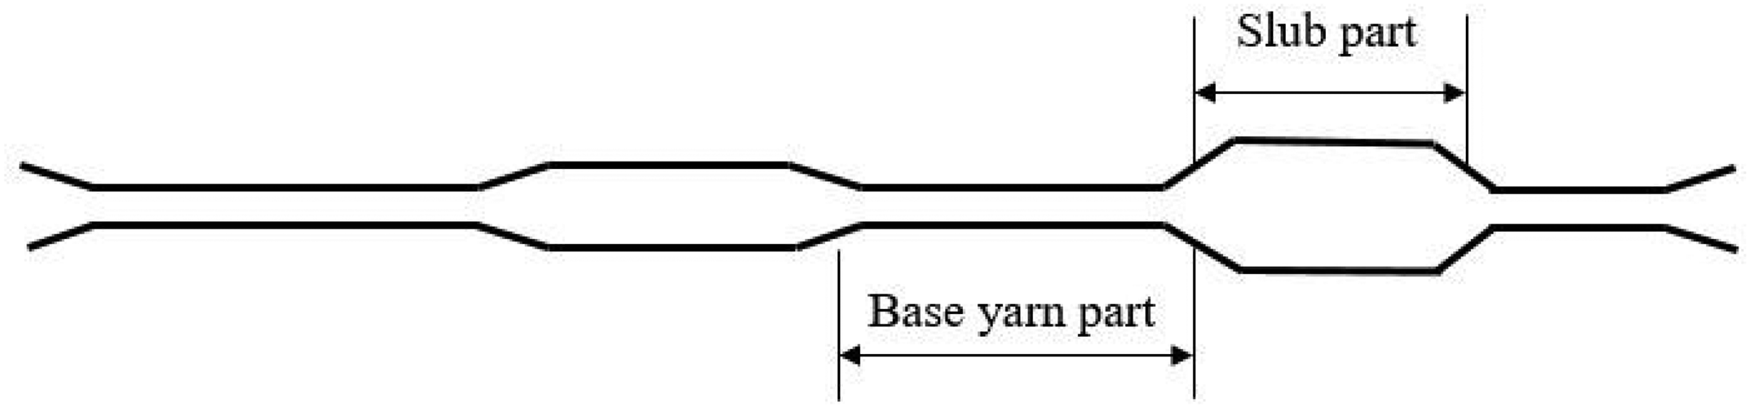
The diagrammatic drawing of slub yarn.
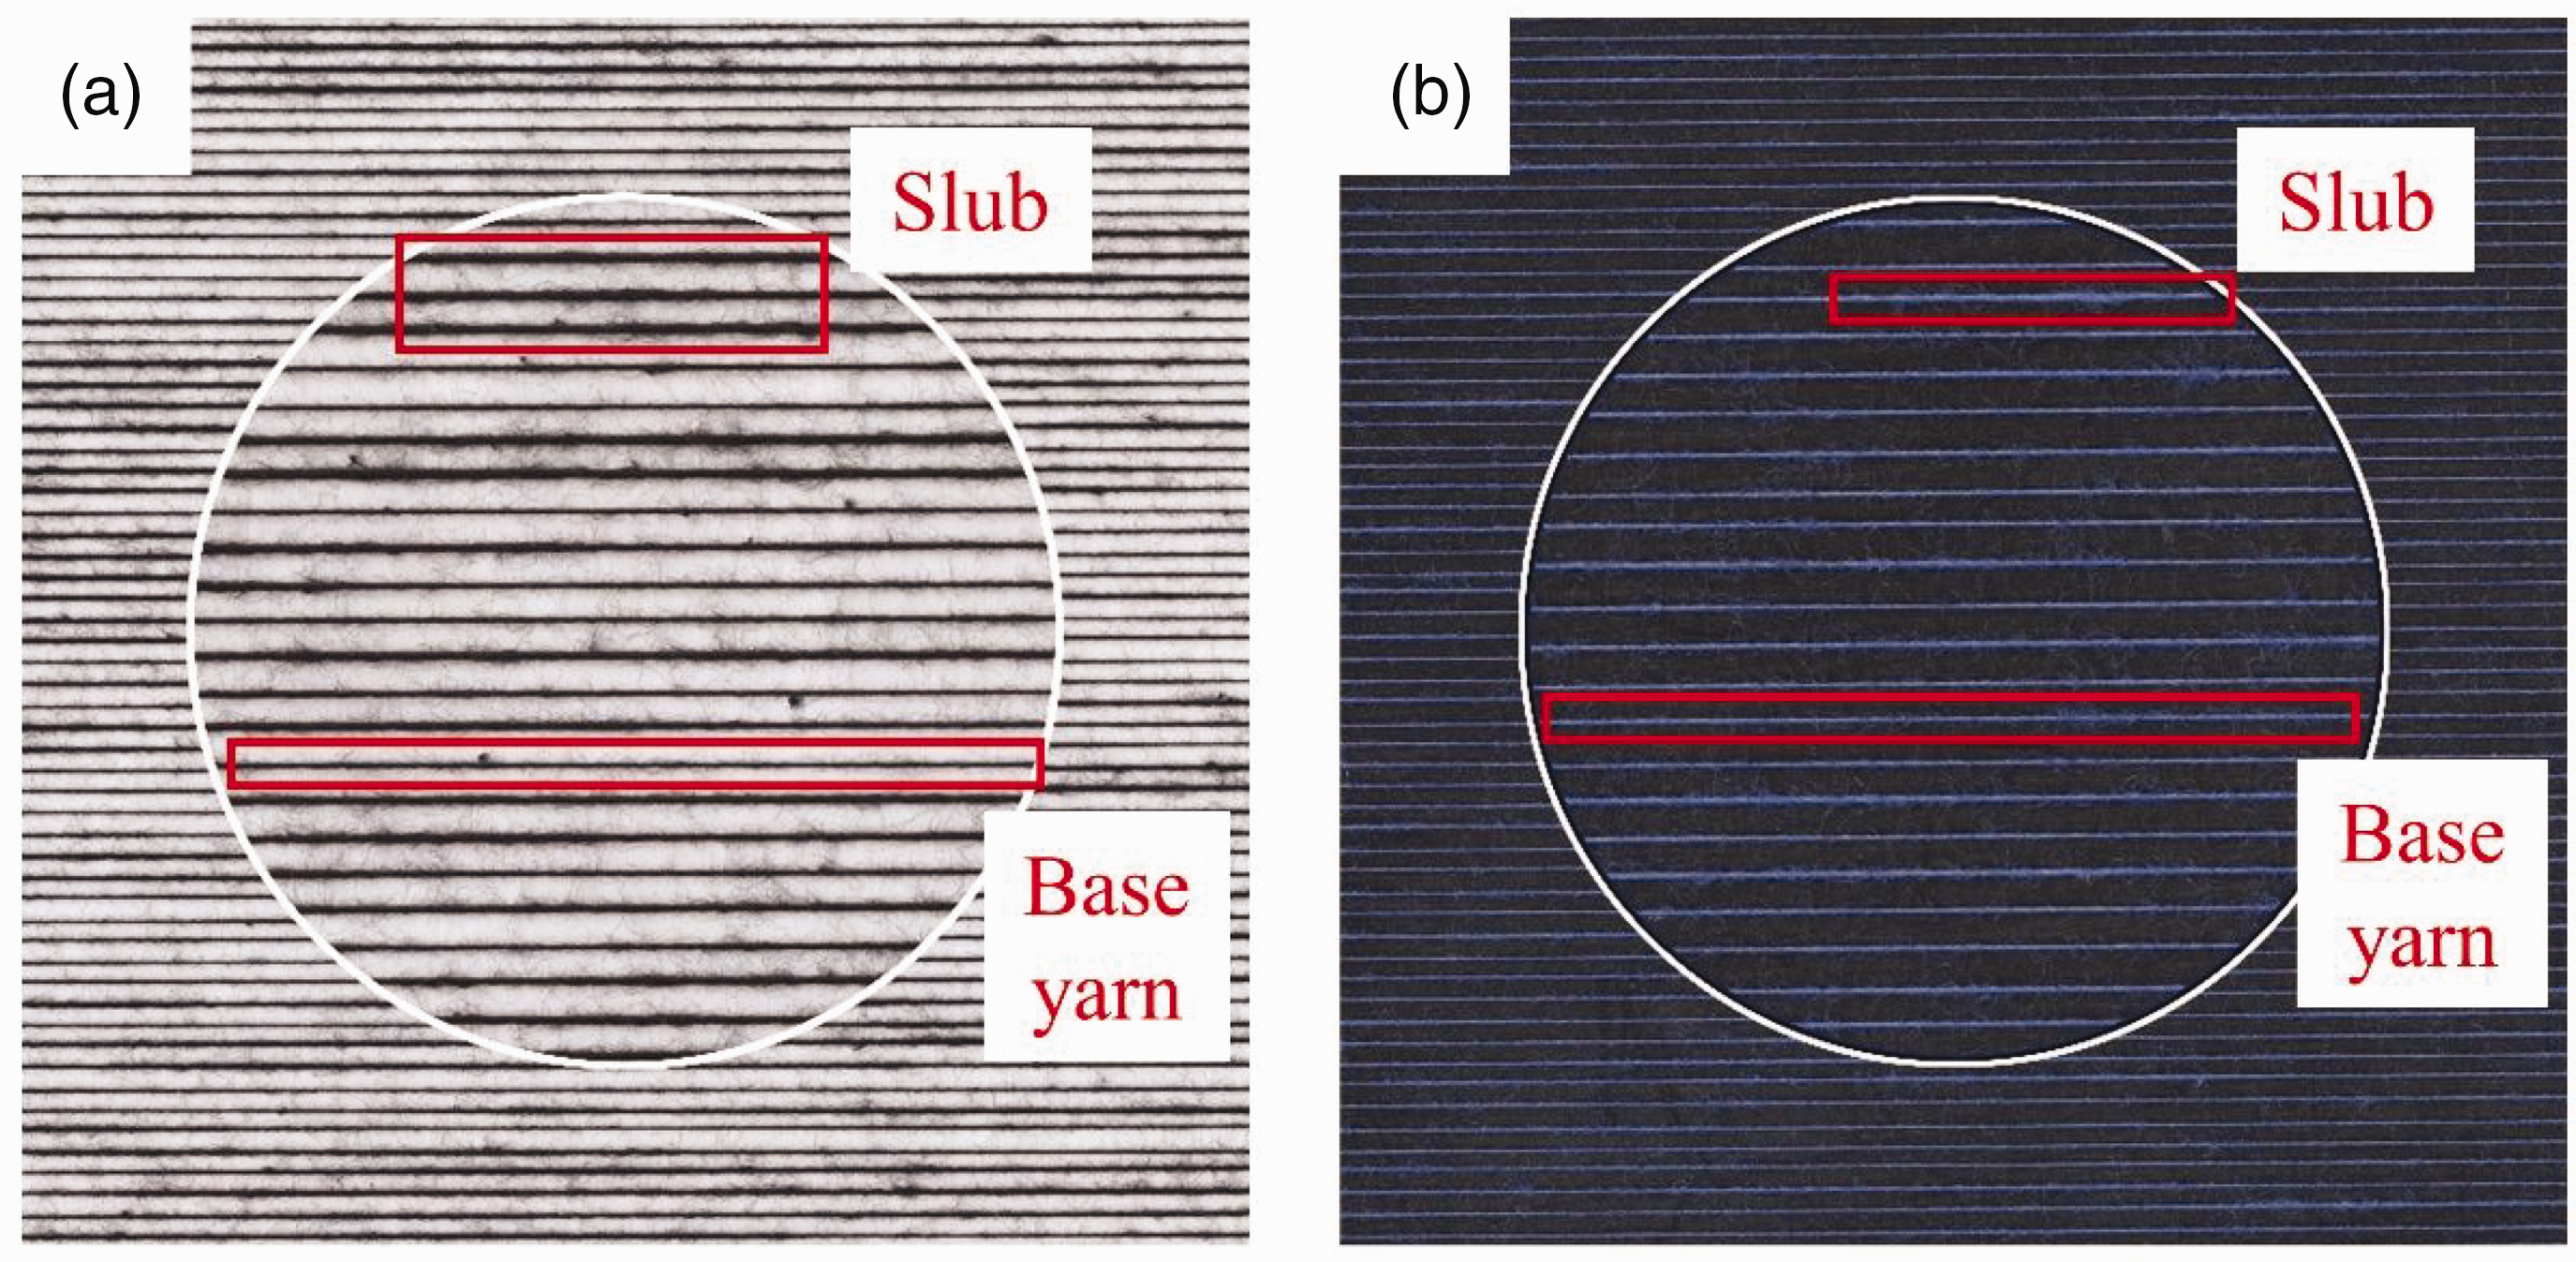
The scanning results for different slub yarns: (a) black slub yarn was captured on the whiteboard and (b) blue slub yarn was captured on the blackboard.
After scanning, the yarn images were cropped to the same size to facilitate subsequent processing. The size was selected as 30 pixels × 2800 pixels. The yarn hairiness could increase the computational complexity of the simulation algorithm and affects the simulation speed and the clarity of the simulation results. Therefore, all yarn images must be pre-processed to obtain the yarn core images for subsequent simulation. Gray processing and threshold segmentation were carried out on the yarn images successively. Then the yarn core images of slub yarns were obtained by executing a matrix point multiplication operation between the obtained binary images and the corresponding original yarn images. It should be noted that the slub yarn is dark in color, so it is difficult to accurately segment the yarn core from the background when using a blackboard. On the other hand, the hairiness of the slub yarn is long and entangled with each other to form neps. It is not easy to segment the hairiness during image segmentation. After preliminary experiments, the threshold segmentation method was adopted as the adaptive threshold method of the mean value. The block size and constant for the blue slub yarn were set to 29 and 4. The block size and constant for the black slub yarn were set to 29 and 29. The morphological open and close operations were added, and the convolution kernel was set to 7. Finally, accurate images of the slub yarn core were obtained. Figure 4 shows part of the pre-processing results of different slub yarns in Figure 3. The original, gray, binary, and yarn core images are shown from top to bottom.
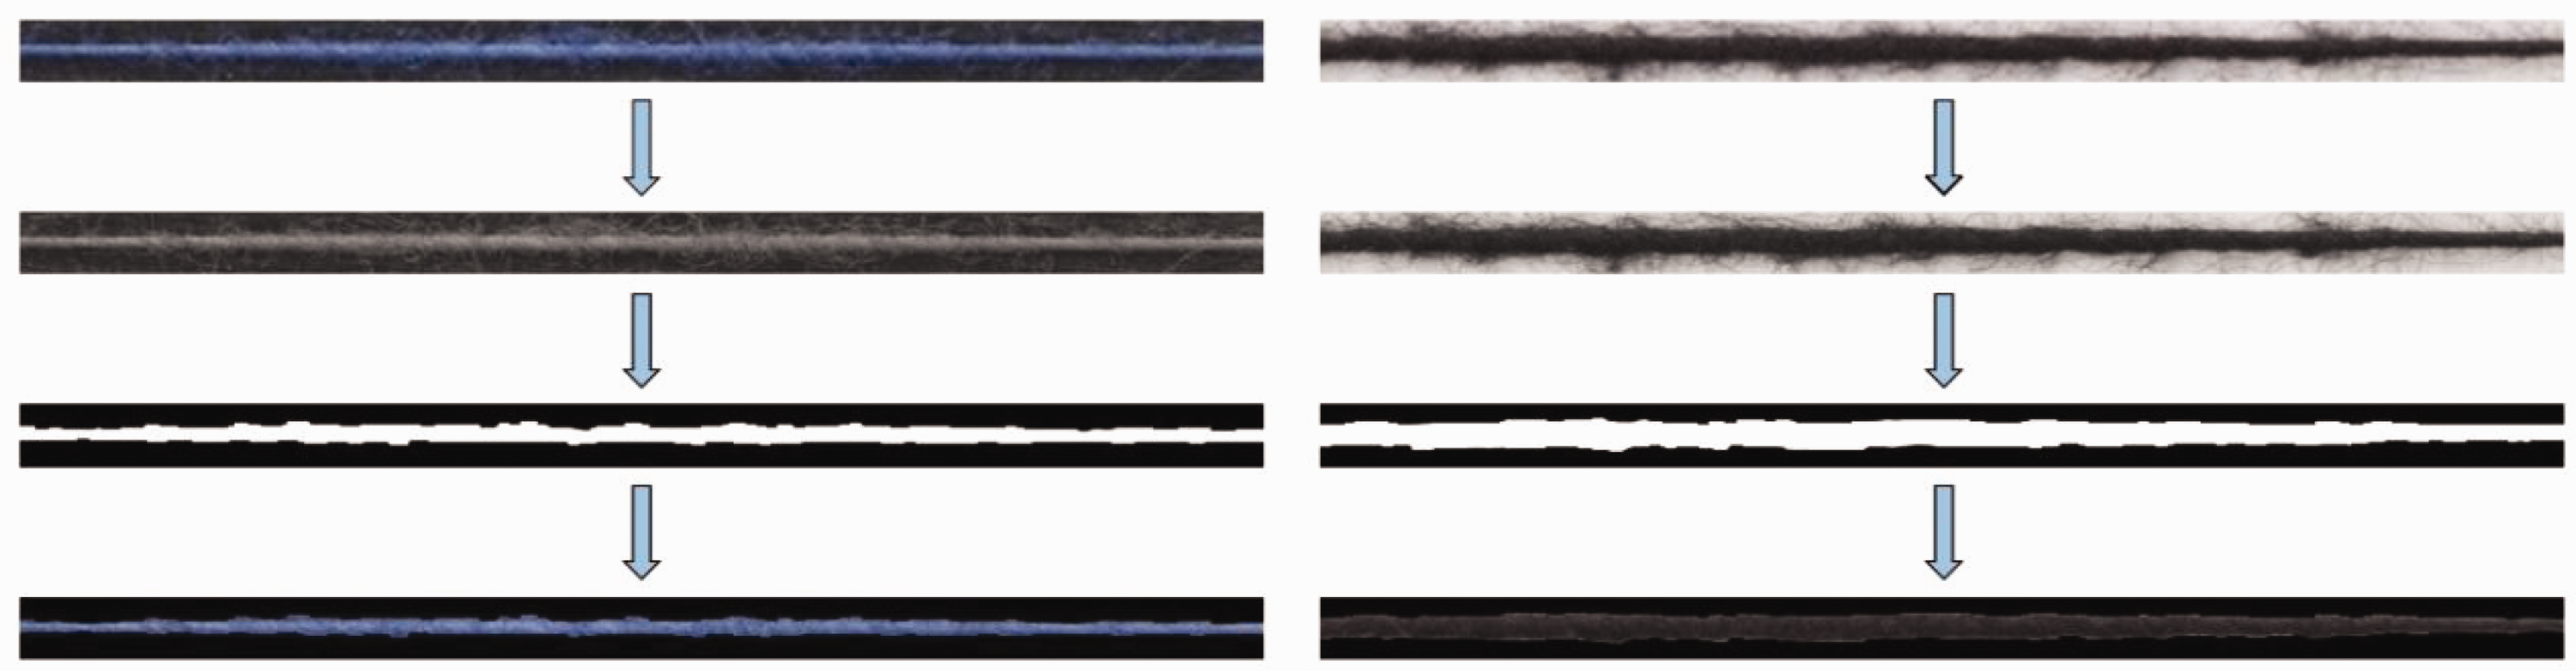
Part of the pre-processing results of different slub yarns.
Yarn model in fabric
Realistic slub yarn images are considered to be the projection of cylindrical surfaces on a plane perpendicular to the direction of viewing and parallel to the yarn axis. But the shape of the yarn cross-section is flattened because of the pressure between yarns, whereas the shapes of yarns in fabric are crimped due to the intersection of crossing yarns resulting in bending deformation. Therefore, it is necessary to adjust the cross-section and radial direction models of yarn first to simulate the slub denim more realistically.
Cross-section model of yarn
The captured yarn images are in free states, and their cross-sections are circular. 47 In the case of yarn structure in woven fabric, yarn cross-sections are flattened due to the warp tension; several shapes have been used to describe the yarn cross-section, like the elliptical section; racetrack section; lens section, etc.48 –50 In previous simulation studies, the elliptical yarn cross-section was accepted by most researchers.8,15,16,51,52 So, the yarns having circular cross-sections would be transformed into elliptical ones to simulate yarn flattening.
The cross-sections of slub yarn in the free state and the fabric are enumerated respectively in Figure 5(a) and (b). Supposing that d1 and d2 represent the diameters of the circular and elliptic cross sections, respectively, a and b are the lengths of the major and minor semi-axes of the ellipse. Then a mathematical model can be established for transforming the yarn cross-section in the following equations (1) to (3):


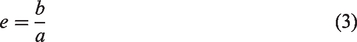
The cross-sections of slub yarn: (a) circular cross-section and (b) elliptical cross-section.
The value of p1 can be obtained as 1.17 when
Buckling-bending model of yarn
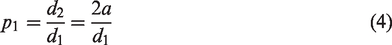
In the woven structure, yarns buckle at the interlacing points because of interweaving with each other. The path yarn follows in fabric structure can be defined by a sine curve to simplify the calculations. 15 The sine curve model can change the buckling shape of yarn with the change of yarn counts and fabric densities, which accords with the actual buckling shape of yarn in fabric.
The most classic weave of slub denim is 3/1 twill, so the models in this article were discussed with this weave as an example. The shapes of the non-interlaced warp yarn and 3/1 twill warp yarn are exhibited in Figure 6(a) and (b). It can be considered that the periodicity of the yarn sine curve is equal to four diameters of yarn. The amplitude of the sine function, the warp buckling height, is 2b. The red curve in Figure 6(b) indicates the arc length S. The projection of arc length S on the X-axis is 2t.
Different shapes of slub yarns: (a) non-interlaced yarn; (b) 3/1 twill yarn; (c) the top-view of non-interlaced yarn and (d) the top-view of 3/1 twill yarn.
The sine curve that the yarn axis follows can be formulated as:
The arc length S, which is the length of the buckling yarn between two crossover points, can be calculated from the equation:
With the top view of the fabric structure, the length of yarn in the fabric is the projection of the sine curve on the X-axis. So the resizing coefficient p2 can be calculated as follows:
As the yarn interweaves and bends in the fabric, its projected length becomes shorter. The same method was used to resize the yarn length, and the resizing coefficient p2 was equal to 0.9. Figure 6(c) and (d) exhibit comparison images of the yarn length in the top view of Figure 6(a) and 6(b).
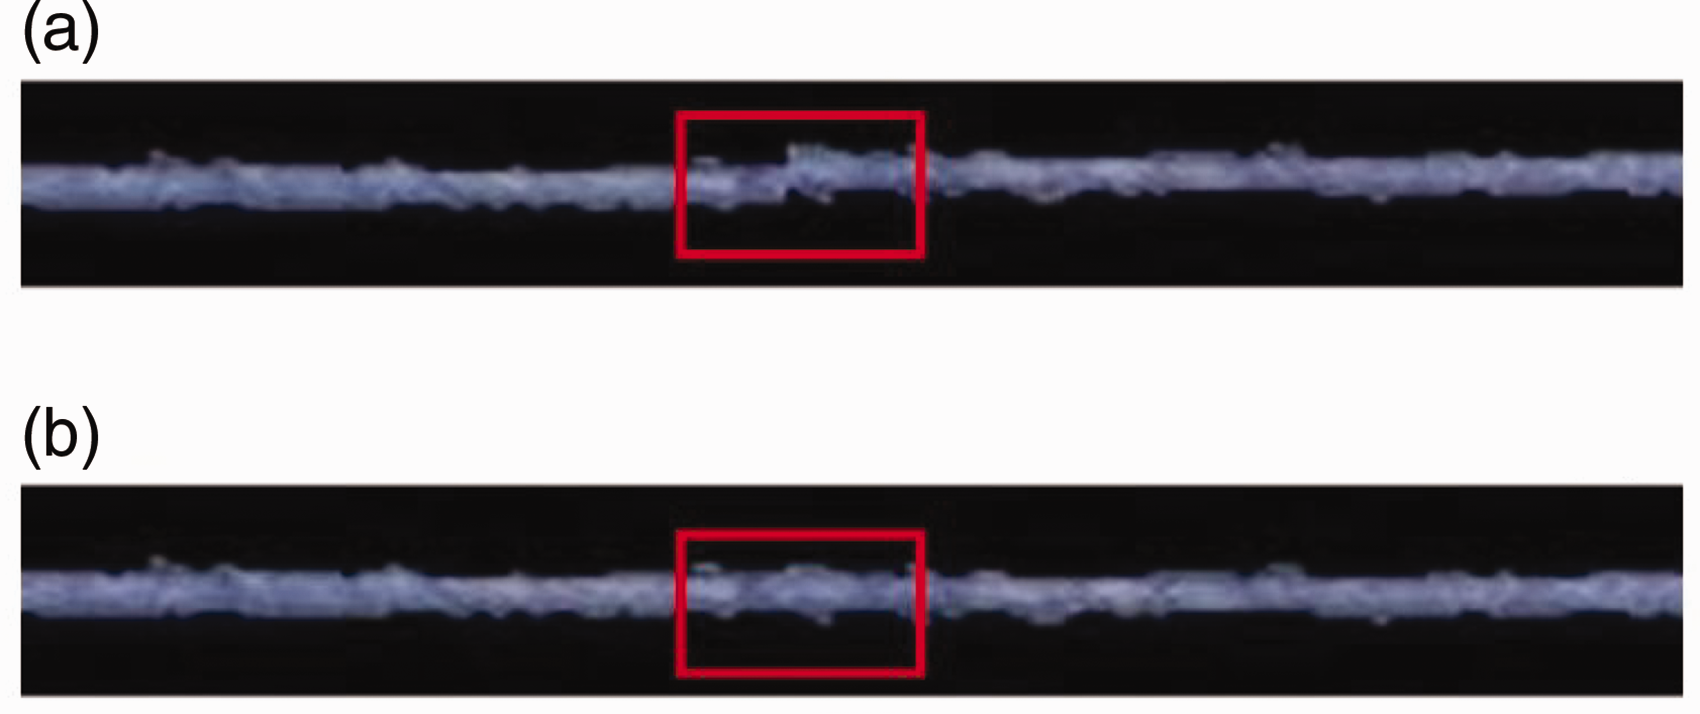
In addition to the buckling states at the interlacing points of yarns, the yarns in fabrics can also bend randomly to the left or right in the radial direction. Therefore, a certain length of the yarn core image is randomly offset by setting the offset and the offset rate. Figure 7(a) and (b) show the states of the slub yarn before and after bending, respectively. By adjusting the cross-section, length, and bending of the yarn, the adjusted result is more consistent with the real shape of the yarn in the fabric. Establishing the slub yarn model is the basis for the realistic simulation results.
The offset of yarn in the fabric: (a) before adding the offset and (b) after adding the offset.
Light intensity curve model
The light intensity curve model is mainly used to calculate the light intensity at a certain point on the surface of an object. 53 In the 3D simulation of fabrics, there are several methods to add fabric surface light models, 54 such as developed analytic reflection models for woven fabrics depending on the underlying weaving for medium distances, 55 fiber-level multilobe scattering models, 56 etc. The rendering methods in these simulations are more advanced and realistic but do not apply to the flat yarn images we use. In our experiments, we chose the actual yarn image as the basis of the simulation, approximating the flat image of the yarn surface as the surface of an elliptical cylinder and using Lambert’s cosine law to assign light intensity, i.e. new pixel values, to its surface to simulate the visual effect of the fabric as uniformly illuminated. The new value is interpolated to each pixel by calculation in the surface-rendering algorithm. This assignment process is the process of adding light intensity to the surface of the object. The yarn images captured by a camera in a light box or obtained by a scanner have a uniform and stable surface brightness. Directly using the captured yarn images for fabric simulations would lead to no lighting changes in the results. Therefore, the light intensity curve model must be added to the yarn surface to simulate fabric more realistically.
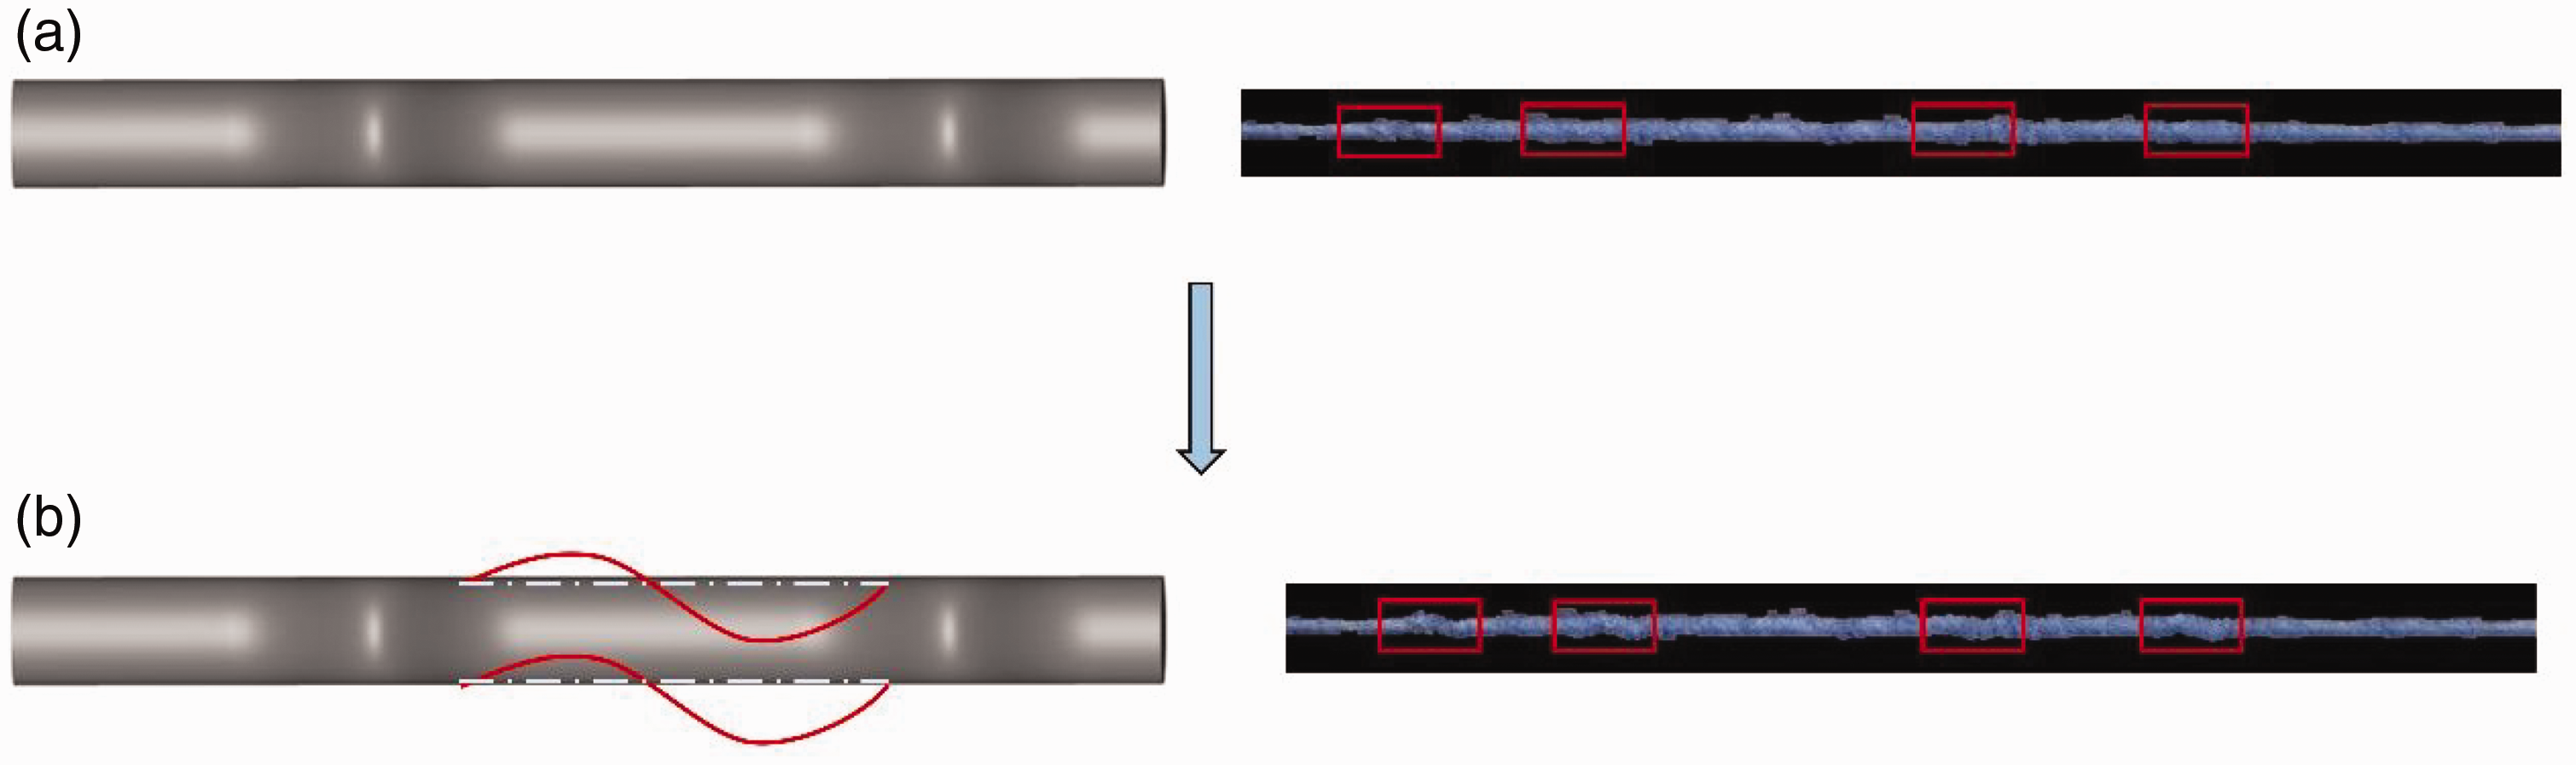
3D simulation methods or software for fabrics usually have their lighting models, as shown in Figure 8(a). However, the lighting model is not accurate. In Figure 8, the light on the yarn surface suddenly disappears at the interlacing point of the fabric marked by a red box, which is inconsistent with the actual situation. To make the simulation results more realistic, an improved light intensity model of the yarn surface was established in this article. This light model is suitable for the cotton slub yarn used in this article.
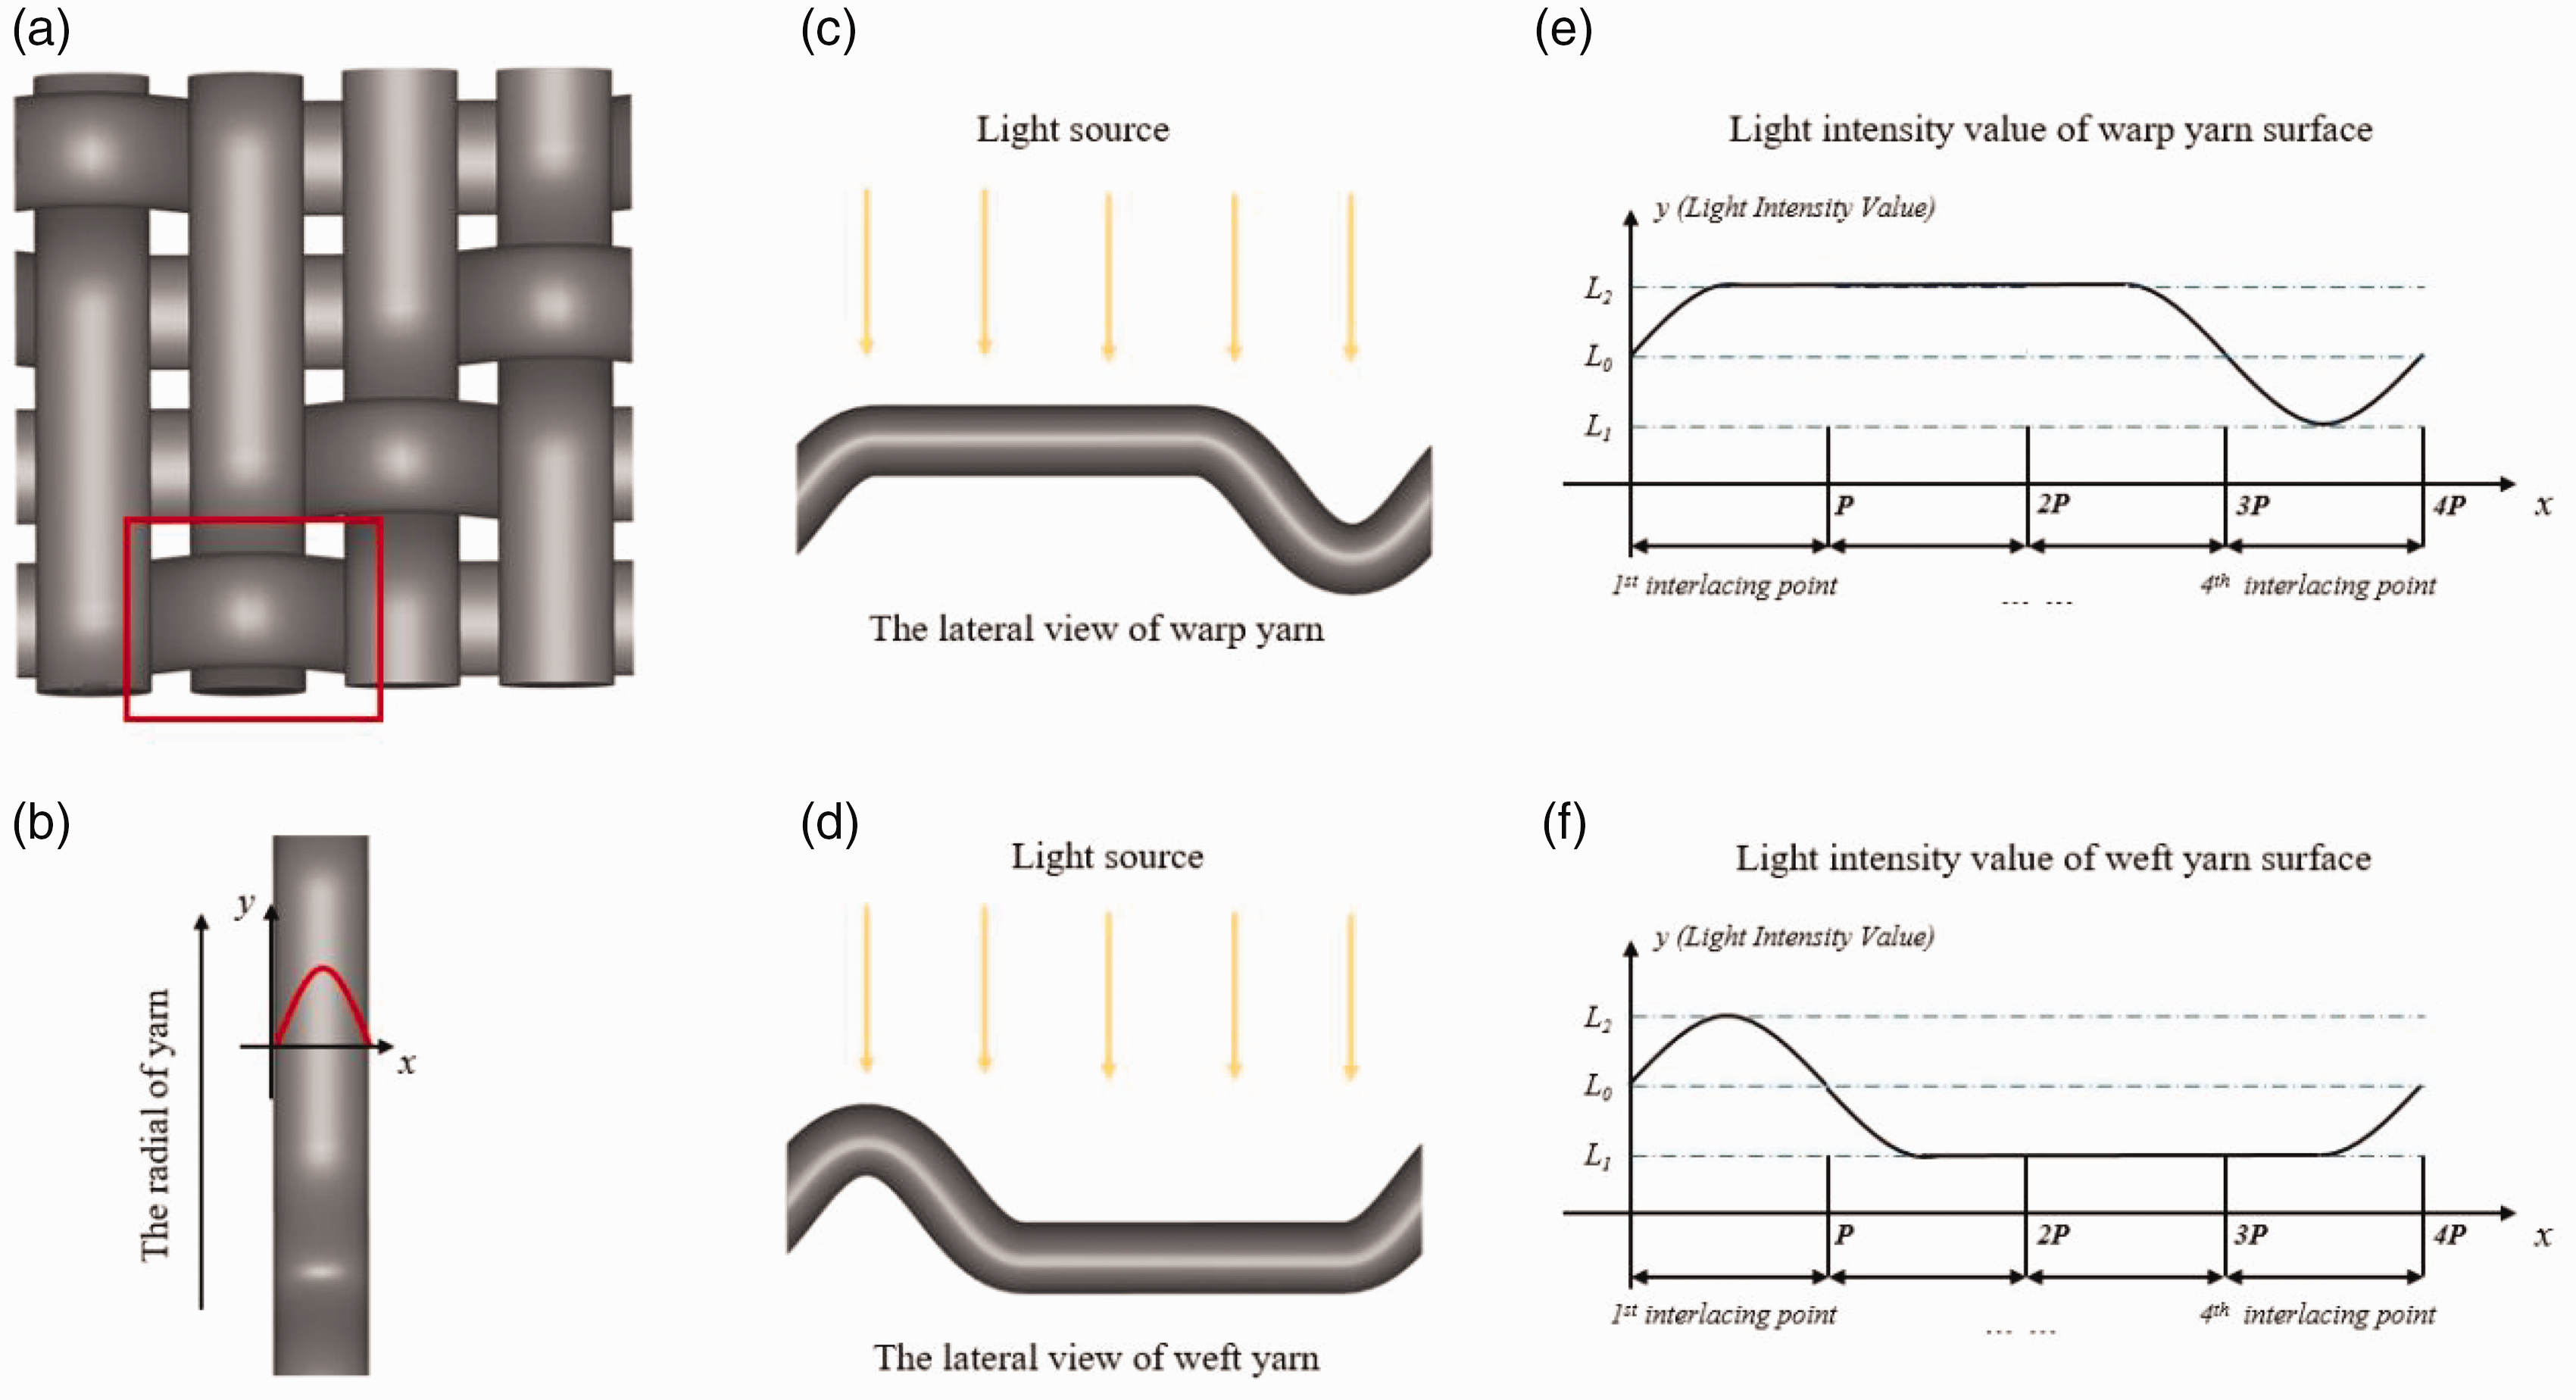
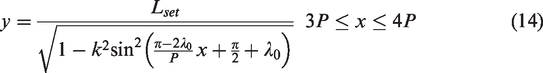
Schematic diagram of light intensity on yarn surface: (a) 3/1 twill of slub denim; (b) the light distribution on the yarn surface; (c) the side view of warp; (d) the side view of weft; (e) the surface brightness distribution curve of the warp and (f) the surface brightness distribution curve of the weft.
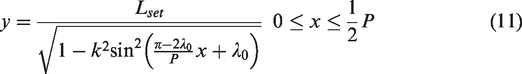
Radial curve model of yarn
As mentioned above, the yarn in the fabric is considered an elliptical cylinder, as shown in Figure 5(b). The diffuse reflection of the yarn surface is usually expressed by Lambert’s cosine law. When the light source irradiates the yarn vertically along the z-axis direction, the light intensity distribution on the yarn surface is shown in the curve in Figure 8(b), which is approximately a cosine curve. That is, the center line of the yarn surface is the brightest, and the light intensity decreases on both sides.
The light intensity of each point on the yarn surface can be calculated by Lambert’s cosine law:

Interlacing point curve model of yarn
To simulate the light distribution in each interlacing point, the light curve can be expressed as


The structure of slub denim is 3/1 twill, as exhibited in Figure 8(a). Figure 8(c) and (d) represent the side views of warp and weft in the fabric. To visualize the intensity of light on the surface of the yarn, we have removed the covering weft yarn (warp yarn) in the picture, and only the individual yarns are shown. When the external light source is vertically irradiated on the fabric surface, the surface brightness distribution curves of the warp and weft yarns are illustrated in Figure 8(e) and (f). The light function curve of the warp yarn surface can be expressed as the following equations:

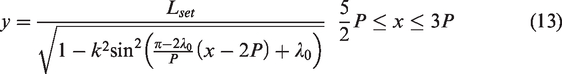
where P is the length of each interlacing point, and Lset is the light intensity coefficient that can be modified.
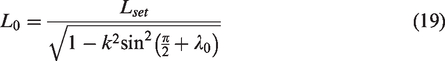
The light function curve of the weft yarn surface can be expressed as the following equations (15)–(18):
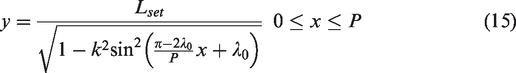
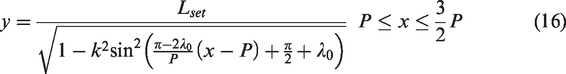

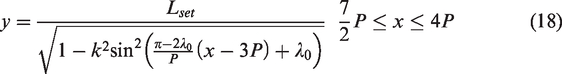
L0, L1, and L2 are given in equations (19)–(21):

These three function curves can first determine the intensity value of each interlacing center line in the axial direction. Then, according to the radial direction model, the intensity value of each interlacing point in the radial direction is calculated according to the intensity value of the center line.
The alignment of the yarn brightness was completed by establishing the radial surface light model of the slub yarn and the light intensity model of the interlacing points in the above two sections. Take the yarn in Figure 7(b) as an example, and the brightness adjustment result is shown in Figure 9.
The adjustment result of yarn surface brightness: (a) curve model of light intensity and (b) light intensity of yarn surface.
Boolean matrix model
A woven fabric weave can be expressed in the form of a 2D binary matrix, 11 and in this paper, it is represented by a Boolean matrix. Boolean matrix is also called a 0–1 matrix; all the elements in the matrix are only 0 or 1. In a woven fabric weave, “0” represents the weft interlacing point, and “1” represents the warp interlacing point.
Supposed a unit pattern Boolean matrix is B (Rj × Rw, Rj, Rw are the number of warp and weft yarns in the unit pattern, respectively), the following equation can represent a unit Boolean matrix:
By repeating matrix B multiple times, the new matrix V(L1 × H1) can represent the entire weave of the fabric. The following equations could infer the new Boolean Matrix:


where i\Rj and j\Rw represent the remainders from a division of i by Rj and a division of j by Rw, respectively. L1 × H1 represents the pixel size of the fabric weave, t1 and t2 are the positive integers.
The woven pattern could be changed by modifying the parameters of the unit pattern matrix, and different multiple repeat Boolean matrices can be calculated by equation (23). Figure 10 reveals the Boolean matrix of the 3/1 twill fabric weave and the simulation result after several repetitions of this matrix.
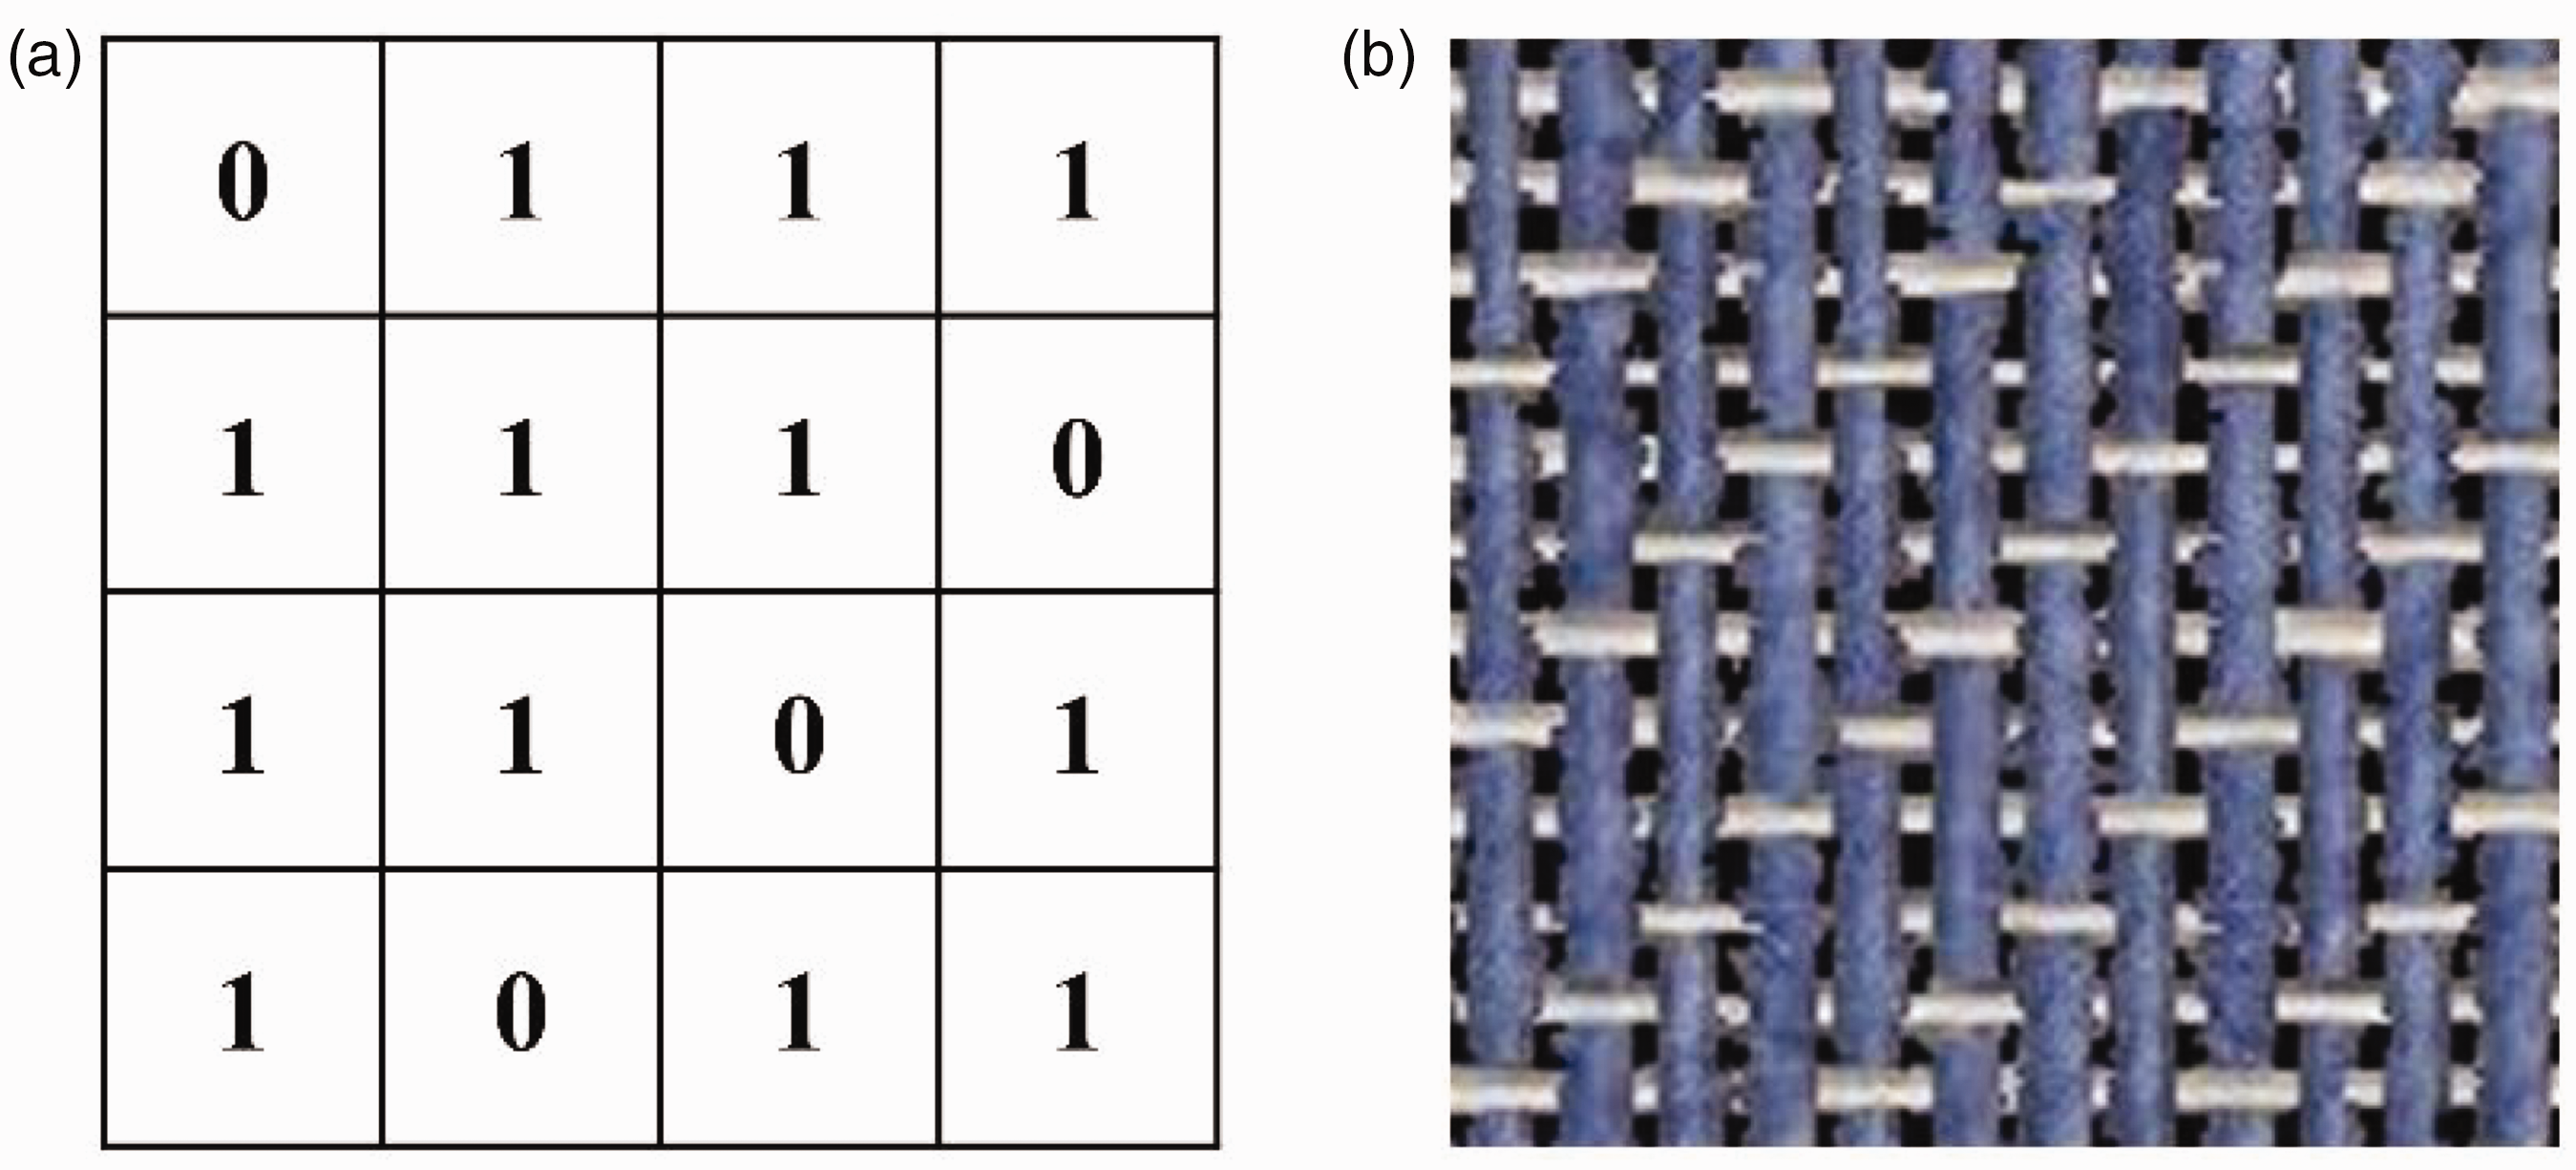
The Boolean matrix and the simulation result: (a) the Boolean matrix of 3/1 twill and (b) the simulation result of 3/1 twill.
Experiment implementation
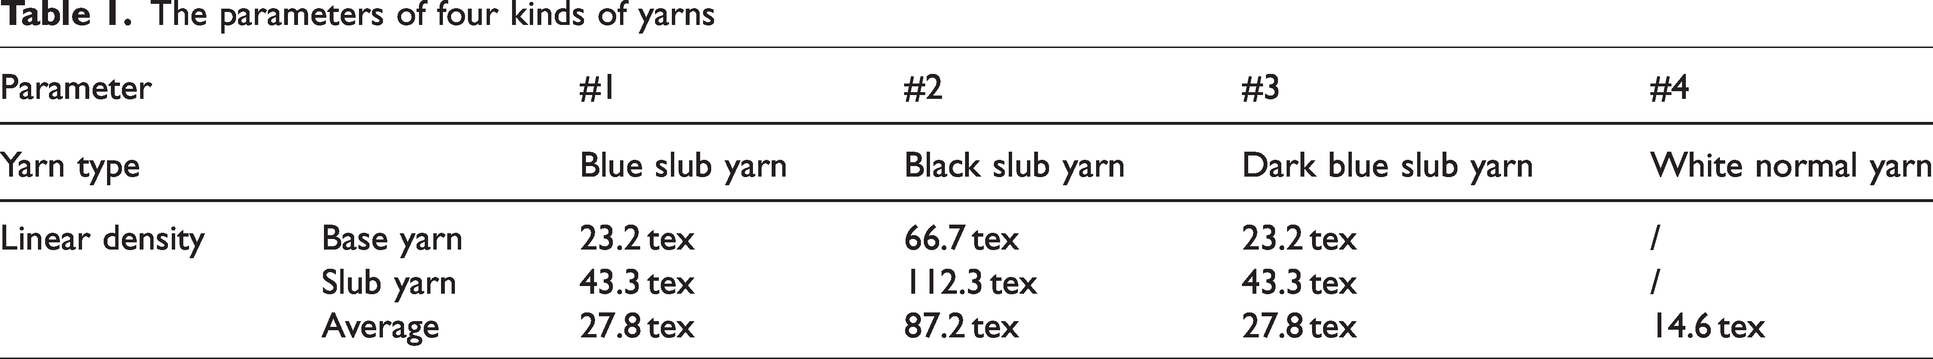
For the simulation of slub denim, three samples of slub yarn and one normal yarn sample were scanned in the experiment. The parameters of four kinds of yarns are shown in Table 1. To ensure that the captured sequential images of slub yarn contain the complete cycle of slubs, more than 200 images of all kinds of slub yarns were collected. Experiments are conducted in a Matrix Laboratory (MATLAB) R2018b compiling environment.
The parameters of four kinds of yarns
The yarn images cannot meet the large-size simulation because the lengths of images collected by scanning are fixed. Therefore, the processed yarn images need to be stitched together to meet the width requirements. Directly stitching yarn images would lead to stitching out of position. So the center lines and center positions of the yarn images were needed to determine the displacement of adjacent yarns. The boundary information of the yarns can be obtained by using the binary images of the yarns shown above. And then, the center line position of each yarn and the center positions of the left and right ends can be calculated. In a binary image, the sum of pixel values in each row was calculated, the index value of the row with the largest sum of pixel values was found, and the average of the sum of index values was taken (if the result was a decimal, grabbing the nearest integer). The result was the position index value of the yarn center line. The average values of the row index with pixel values equal to 1 were calculated in the first and last columns of the image. The results were the center positions of the left and right ends of the yarn. According to the above calculation results, a corresponding displacement was added at the left center of the right yarn to align it with the right center of the left yarn to finish the stitch. Figure 11 exhibits the method comparison of whether the displacement was added or not in stitching. According to the stitching result, adding displacement could avoid the dislocation of stitching.
Comparison of two kinds of stitch methods: (a) before adding the displacement and (b) after adding the displacement.
The procedure of the proposed method is illustrated in Figure 12. The images of the slub and normal yarn were filled into the established model by the image information filling method. The Gaussian noise and mean filtering were used to fuzzy the simulation results. The parameters in Gaussian noise are 0 for the mean and 0.005 for the variance. For mean filtering, we chose a 3 × 3 matrix as the template and averaged the sum of the pixel values of the simulation results to replace the original pixel values. This treatment made the final simulation result more visually similar to the actual fabric. The experimental process and simulation result is shown in Figure 13.
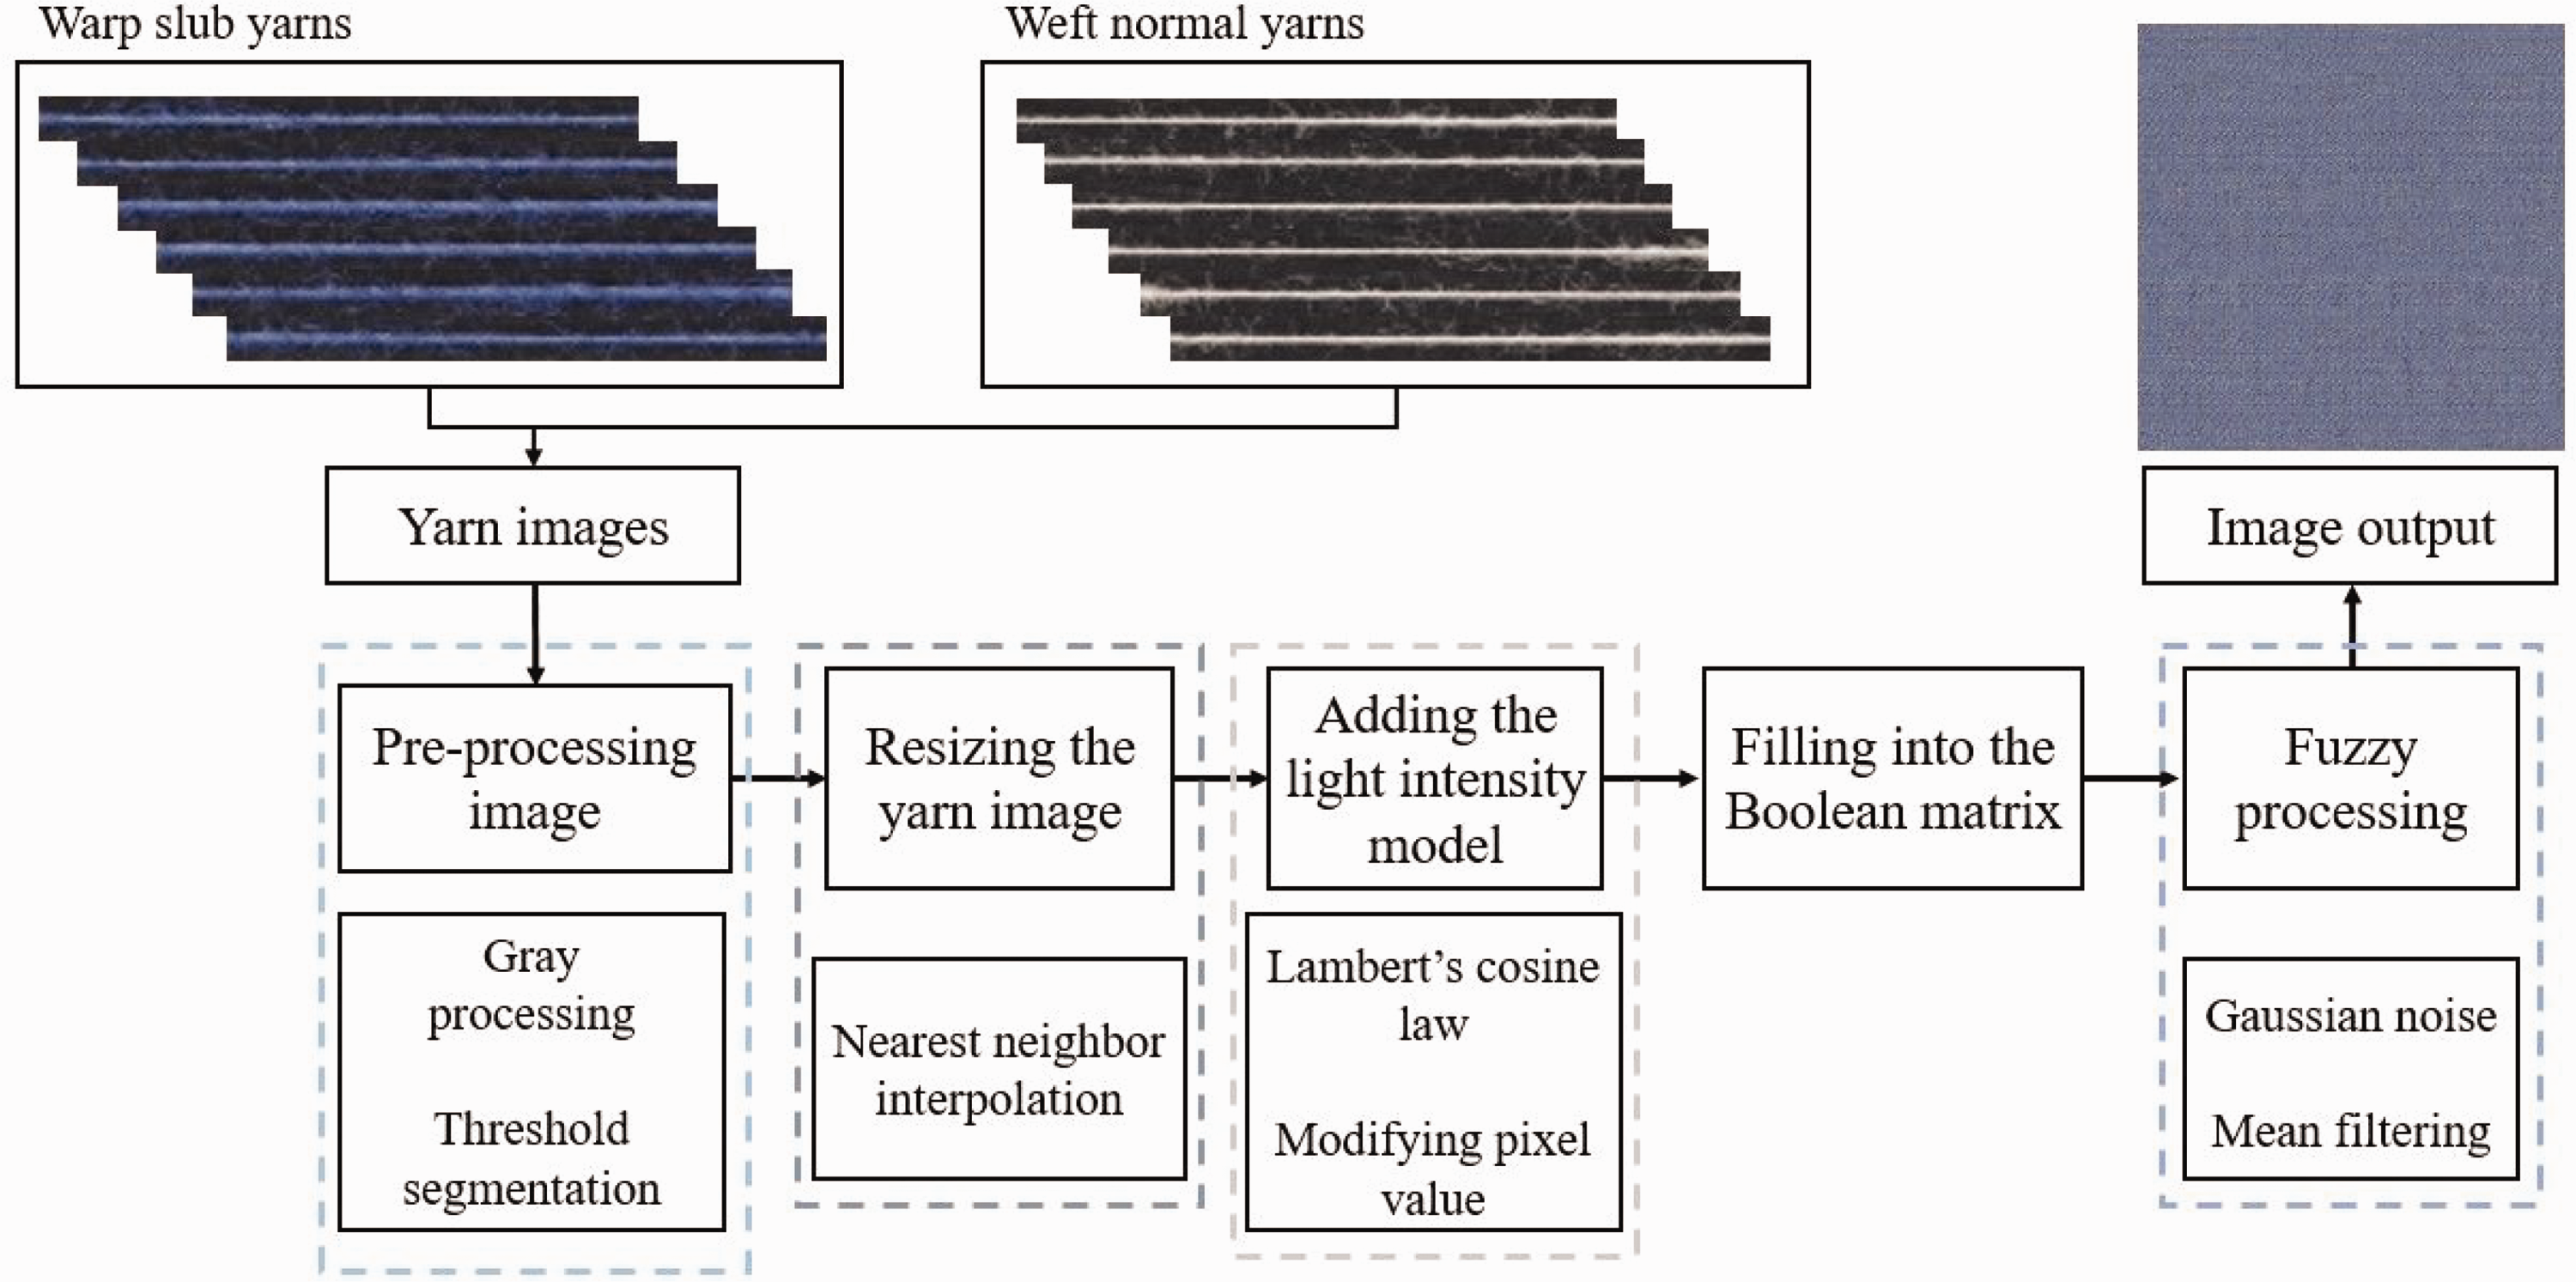
Flow chart of the proposed method.
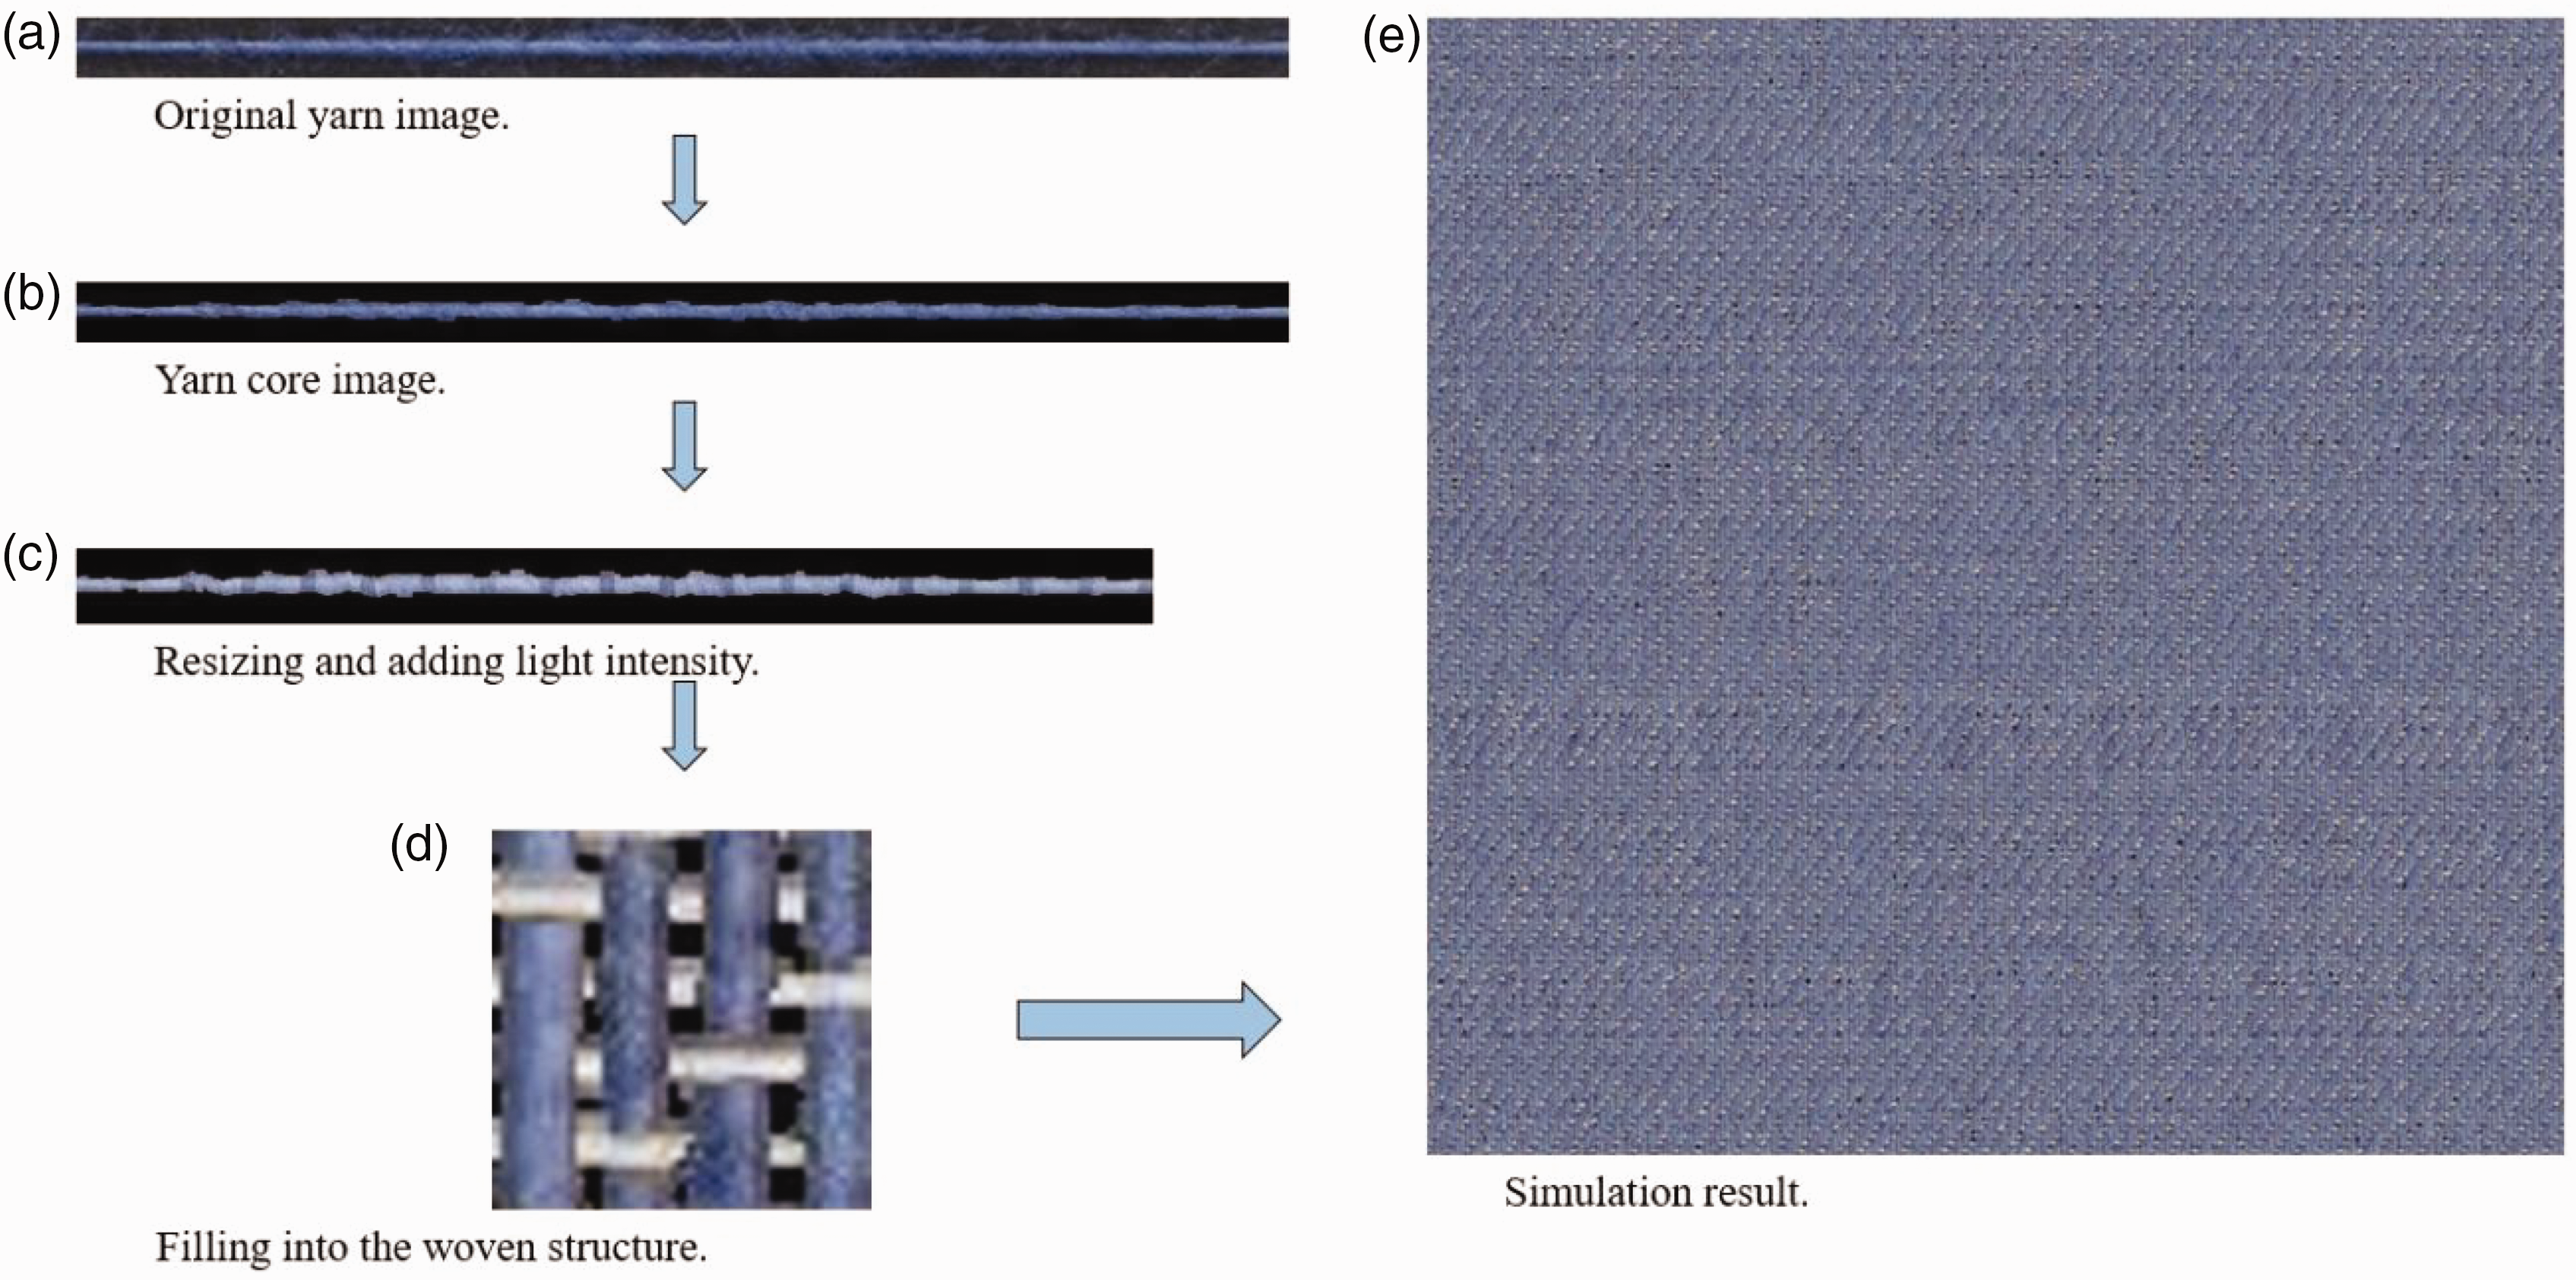
The simulation result.
Results and discussion
To verify the superiority and applicability of the model proposed in this study, yarn types, starting points of simulations, and fabric densities were used as variables to simulate different results. In addition, this experiment was also compared with previous methods.
Different yarn types
Different types of slub yarns (including color, slub parameters, etc.) will change the appearance of the slub denim. In this study, three kinds of slub yarns were used for simulations. Figure 14 reveals different slub yarns and the corresponding simulation results. The simulation result has the appearance of slub denim and can reflect the slub features.
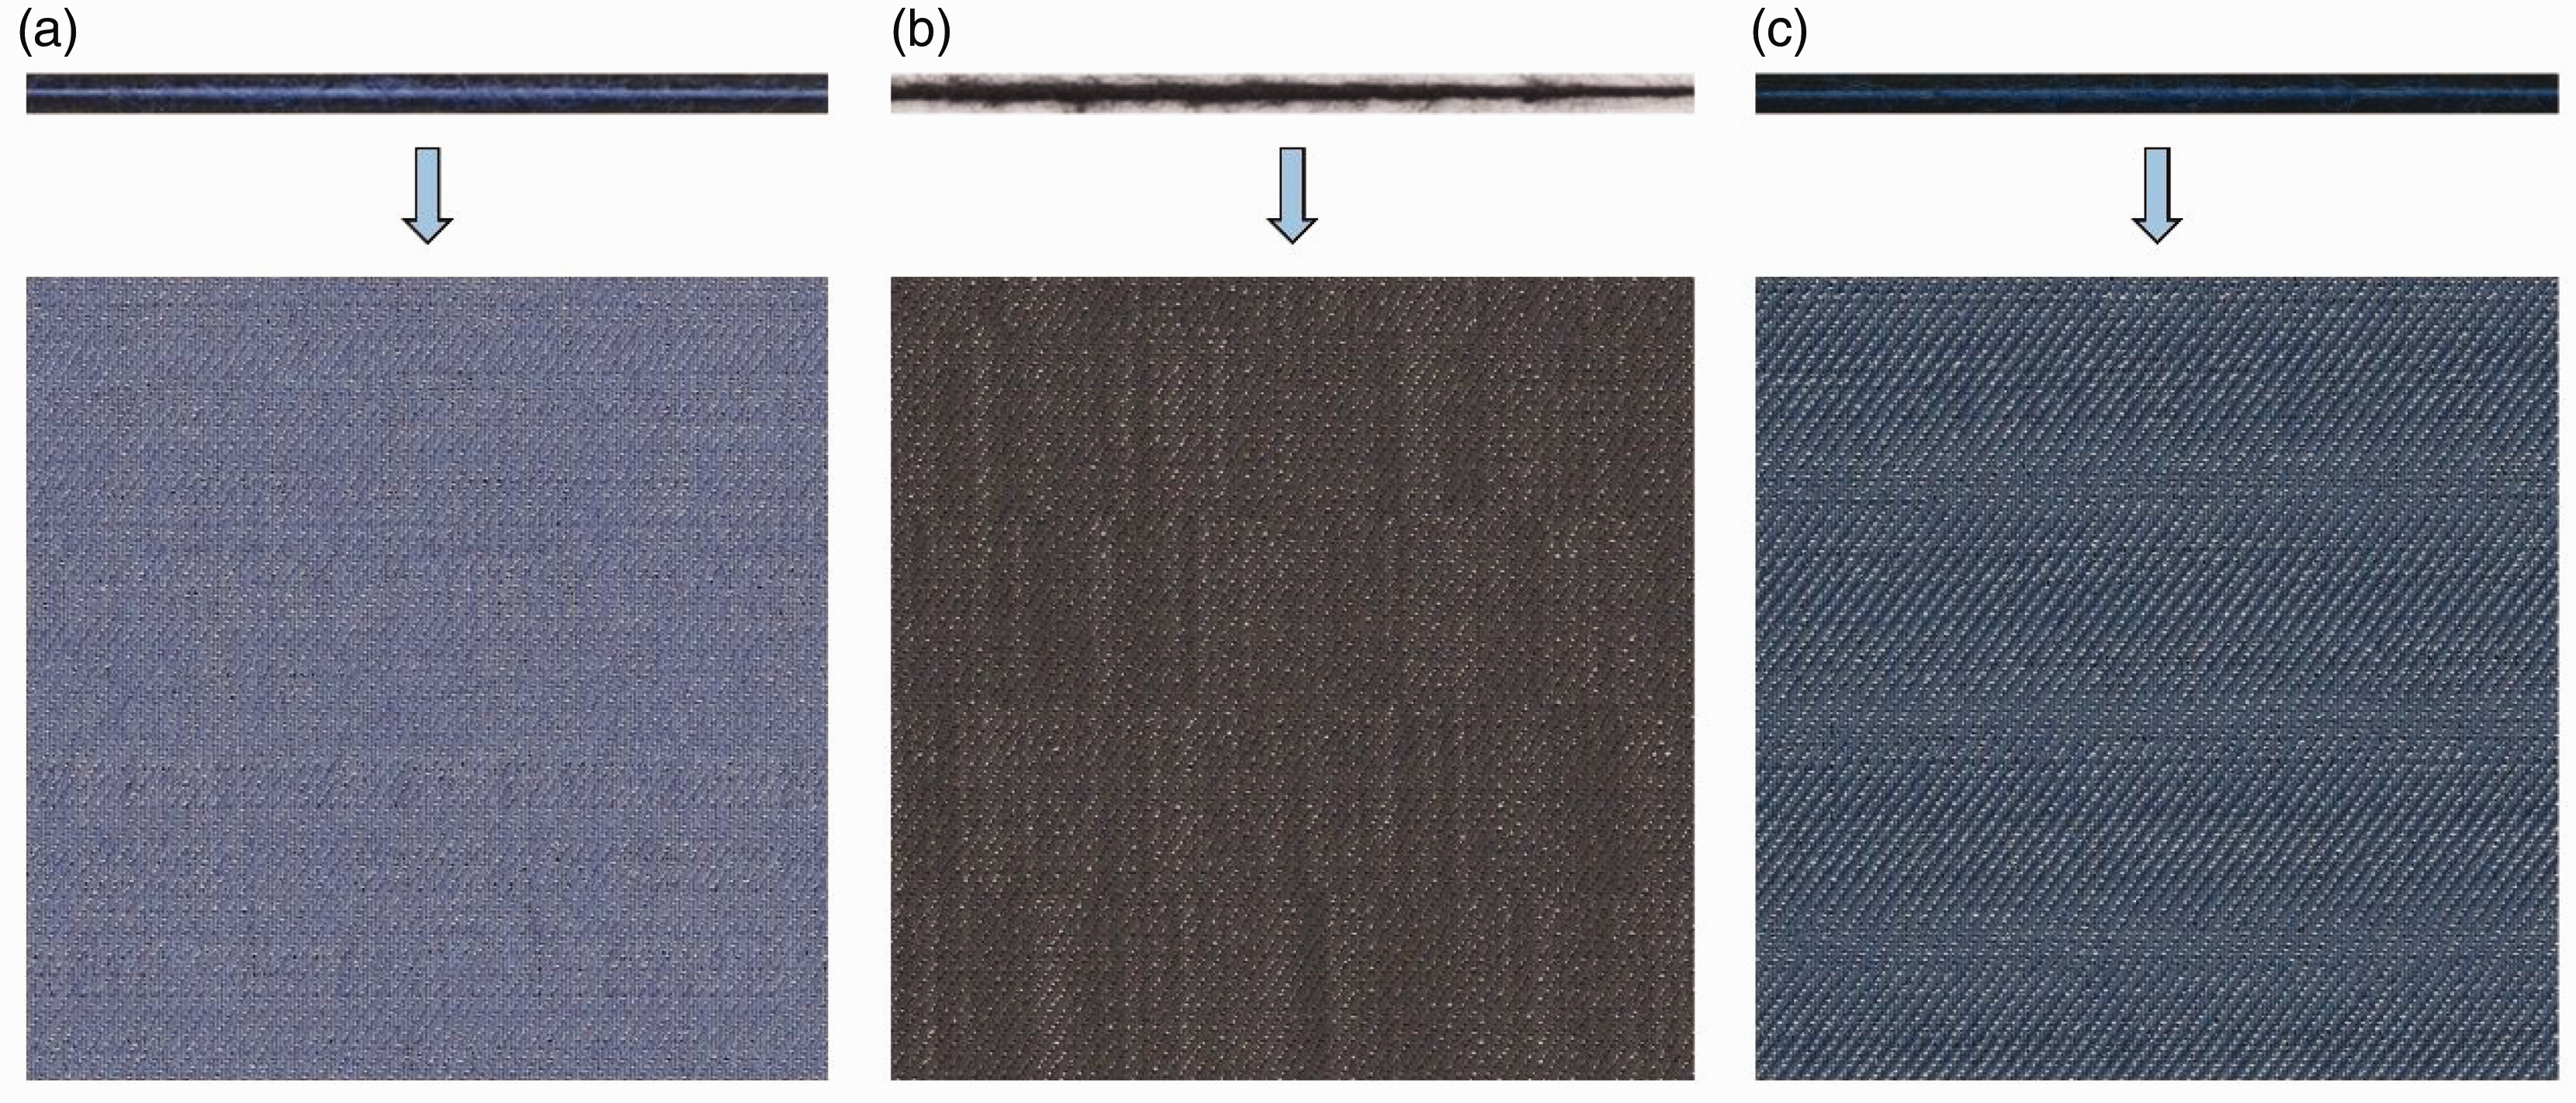
The simulation results of different slub yarns: (a) blue slub denim; (b) black slub denim and (c) dark blue slub denim.
Comparing the three slub yarns, #1 and #2 have different colors and slub parameters. Analyzing the corresponding simulation results, the color and appearance effect of the slub denim in Figure 14(a) is significantly different from Figure 14(b). The yarn count of #2 is small, and the slubs are long and thick. The slub effect is pronounced in the result. The average linear density of #1 is 27.8 tex, and the average length and ratio of the slub are 40 mm and 1.85 times respectively, which are much smaller than the #2 (average linear density is 87.2 tex, average slub length is 135 mm, and the ratio is 1.69 times). So the slub effect in Figure 14(a) is weaker than in Figure 14(b). #1 and #3 have the same parameters but different colors. Figure 14(c) shows that the texture and slub effect of the result are similar to those in Figure 14(a), but there is a significant difference in color between them.
The simulation results can accurately reflect the changes in the yarn color. Meanwhile, the simulation results can also reveal the appearance changes caused by the parameter changes of the slub yarn. When a new fabric sample needs to be imitated, the corresponding fabric image can be obtained by collecting the yarn images used in the sample and inputting them into the model proposed in this article. The results in this section indicate the robust adaptability of different yarn types in this model.
Different starting points
Due to the particularity of slub yarn, different positions of the same denim fabric may have other appearances. In order to improve the accuracy of the simulation results, the starting points of warp and weft yarns can be set in the simulation model proposed in this article. This parameter is set to simulate the appearance of the fabric in different positions.
In this study, colored slub yarn and white normal yarn were used as warp and weft, respectively, to simulate slub denim. When the warp interlacing point is slub, the appearance of the result shows the color of the slubs; when the warp interlacing point is the base yarn of slub yarn, the result shows the colors of the base yarns and weft yarns. It is a unique feature of slub denim. The same yarn types and warp and weft densities were used in the experiments, and the simulation starting points were selected at 0 cm, 60 cm, 150 cm, and 250 cm of the slub yarn, respectively. The simulation results are shown in Figure 15. Changing the starting points of the simulations, the positions where slub or base yarn interlaces with the weft yarn will be changed. The result in Figure 15(d) has the farthest simulation starting point, and its interlacing points contain more slubs than other results. So the color of this simulation result is the darkest, and the texture of the appearance is very different from the other three results. Similarly, the appearance textures of the other three results were changed due to the change of the slub positions. The locations of the slub-intensive areas and the base yarn-intensive areas are different for each result. There are also variations in shades of color.
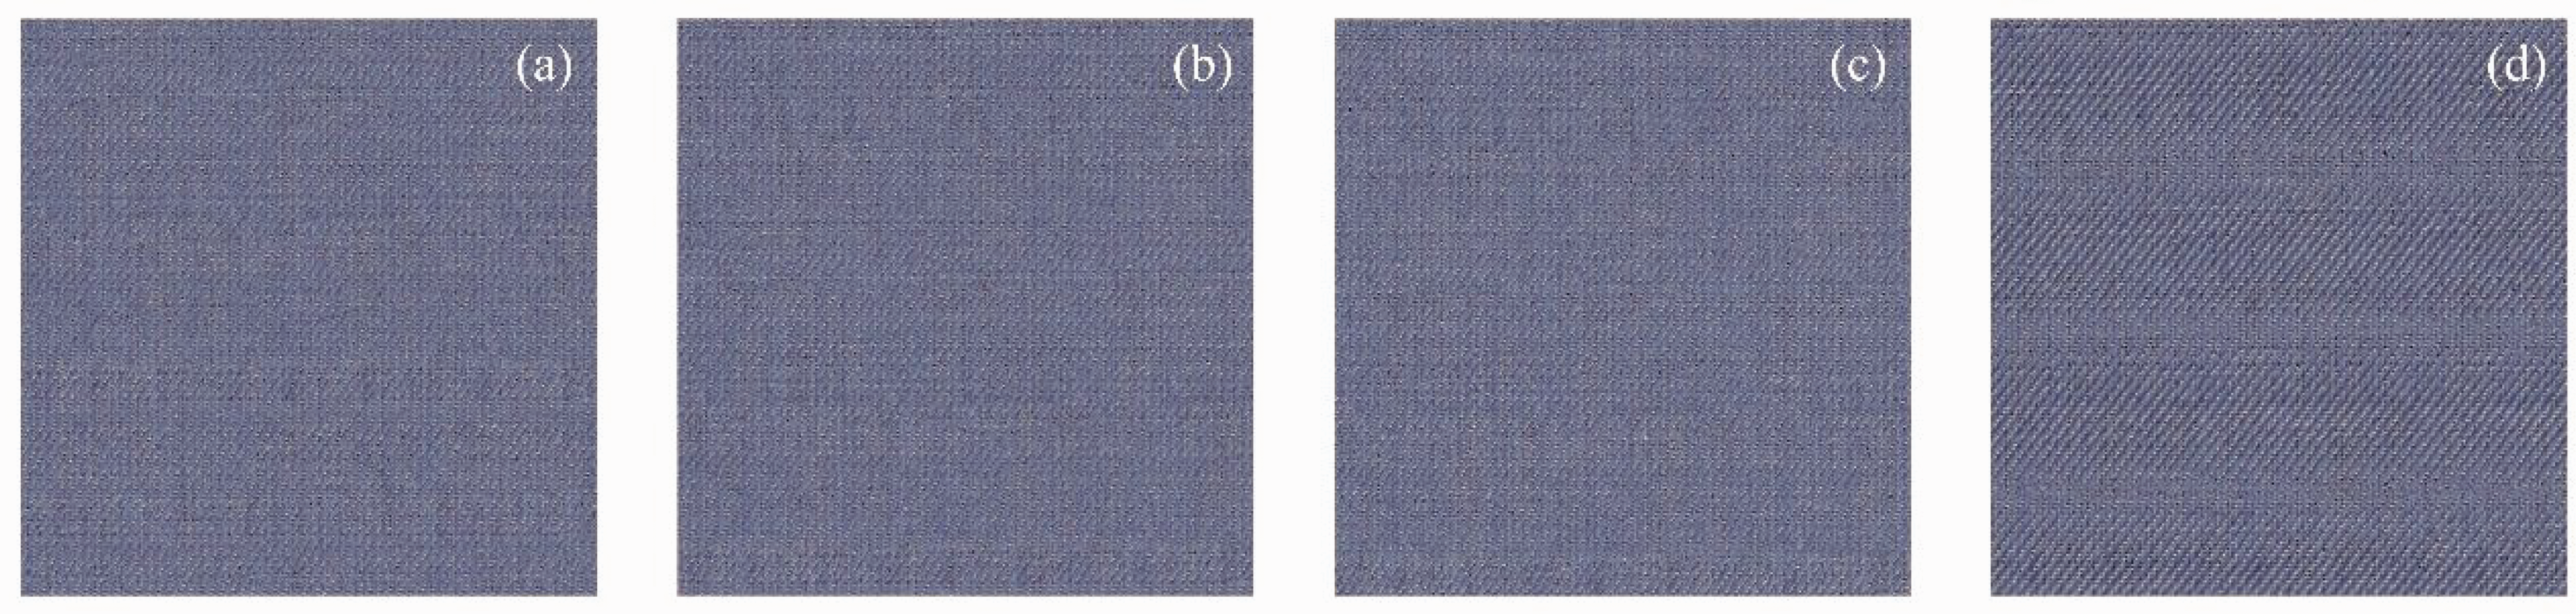
The simulation results of different starting points: (a) starting point 0 cm; (b) starting point 60 cm; (c) starting point 150 cm and (d) starting point 250 cm.
In the model, the simulation starting point can be adjusted by changing the serial number of the starting yarn. Setting the simulation starting point makes it convenient to compare the texture effects of the same slub yarn in different positions of the fabric simulation. The setting of this parameter enhances the adaptability of the model.
Different warp and weft densities
The warp and weft densities are essential parameters that affect the appearance of the fabric. This model can control the densities of the simulated fabrics by inputting the lengths of weave interlacing points. The parameters J and W in the model represent the length of the weft interlacing point and the warp interleaving point length of the simulation results, represented by the number of pixels. The warp and weft densities in the simulation results were calculated according to the conversion relationship between pixels and the actual physical size mentioned in the second section.
In order to demonstrate that this model can flexibly adjust the warp and weft densities of simulation results, the same yarn type and simulation starting point were used in the experiment, and four different density parameters were set. The results are shown in Figure 16. The simulated results are classified as follows: Figure 16(a) and (b) are the heave fabrics with short weave point lengths and high warp and weft densities. On the contrary, Figure 16(c) and (d) have lower warp and weft densities and belong to light fabrics. The appearance difference between the two types of results is pronounced. The yarn space of heave fabric is tight, the result color reflects the yarn color, and the slub effect is obvious. However, the yarn density of the light fabric is sparse, the background color can be seen in the result, and the slub effect is weakened. When the warp density of the simulation results is higher than the weft density (results Figure 16(a) and (d)), the appearances of the results show more warp characteristics; that is, the result colors are bluer, and the slub features are more prominent. In contrast (result Figure 16(b)), the simulation result contains more weft features, the color of the result is whiter, and the slub is not apparent. The appearance of the result Figure 16(c) is intermediate.
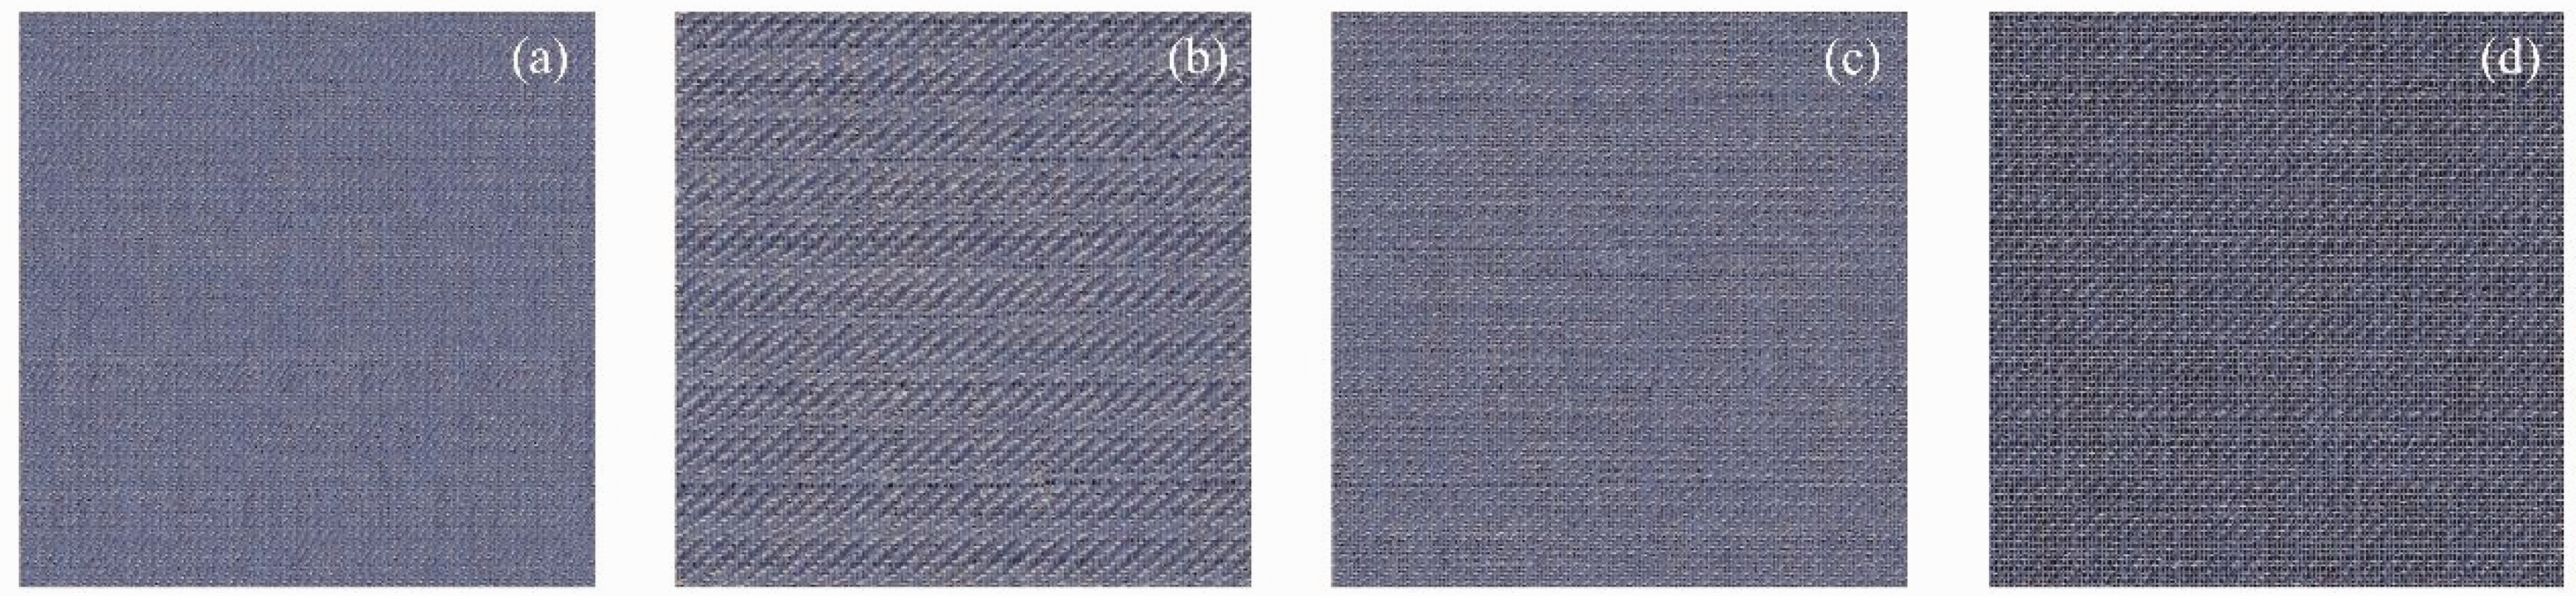
The simulation results with different warp and weft densities. Fabric density: (a) 338 × 237 thds/10 cm; (b) 237 × 338 thds/10 cm; (c) 237 × 237 thds/10 cm and (d) 237 × 182 thds/10 cm.
With different densities, the appearances of the results vary significantly. The simulation results can reflect the change in fabric appearance due to the shift in warp and weft densities.
Comparison results
To prove the results obtained in this article have more actual fabric appearances, two previous methods,8,14 which were based on the information filling method, were compared with the proposed method. The results of the different methods are shown in Figure 17. The results show that the proposed method obtained the best results compared with the other two methods for different samples. In particular, the proposed method substantially accomplishes visual similarity simulations of actual fabrics.
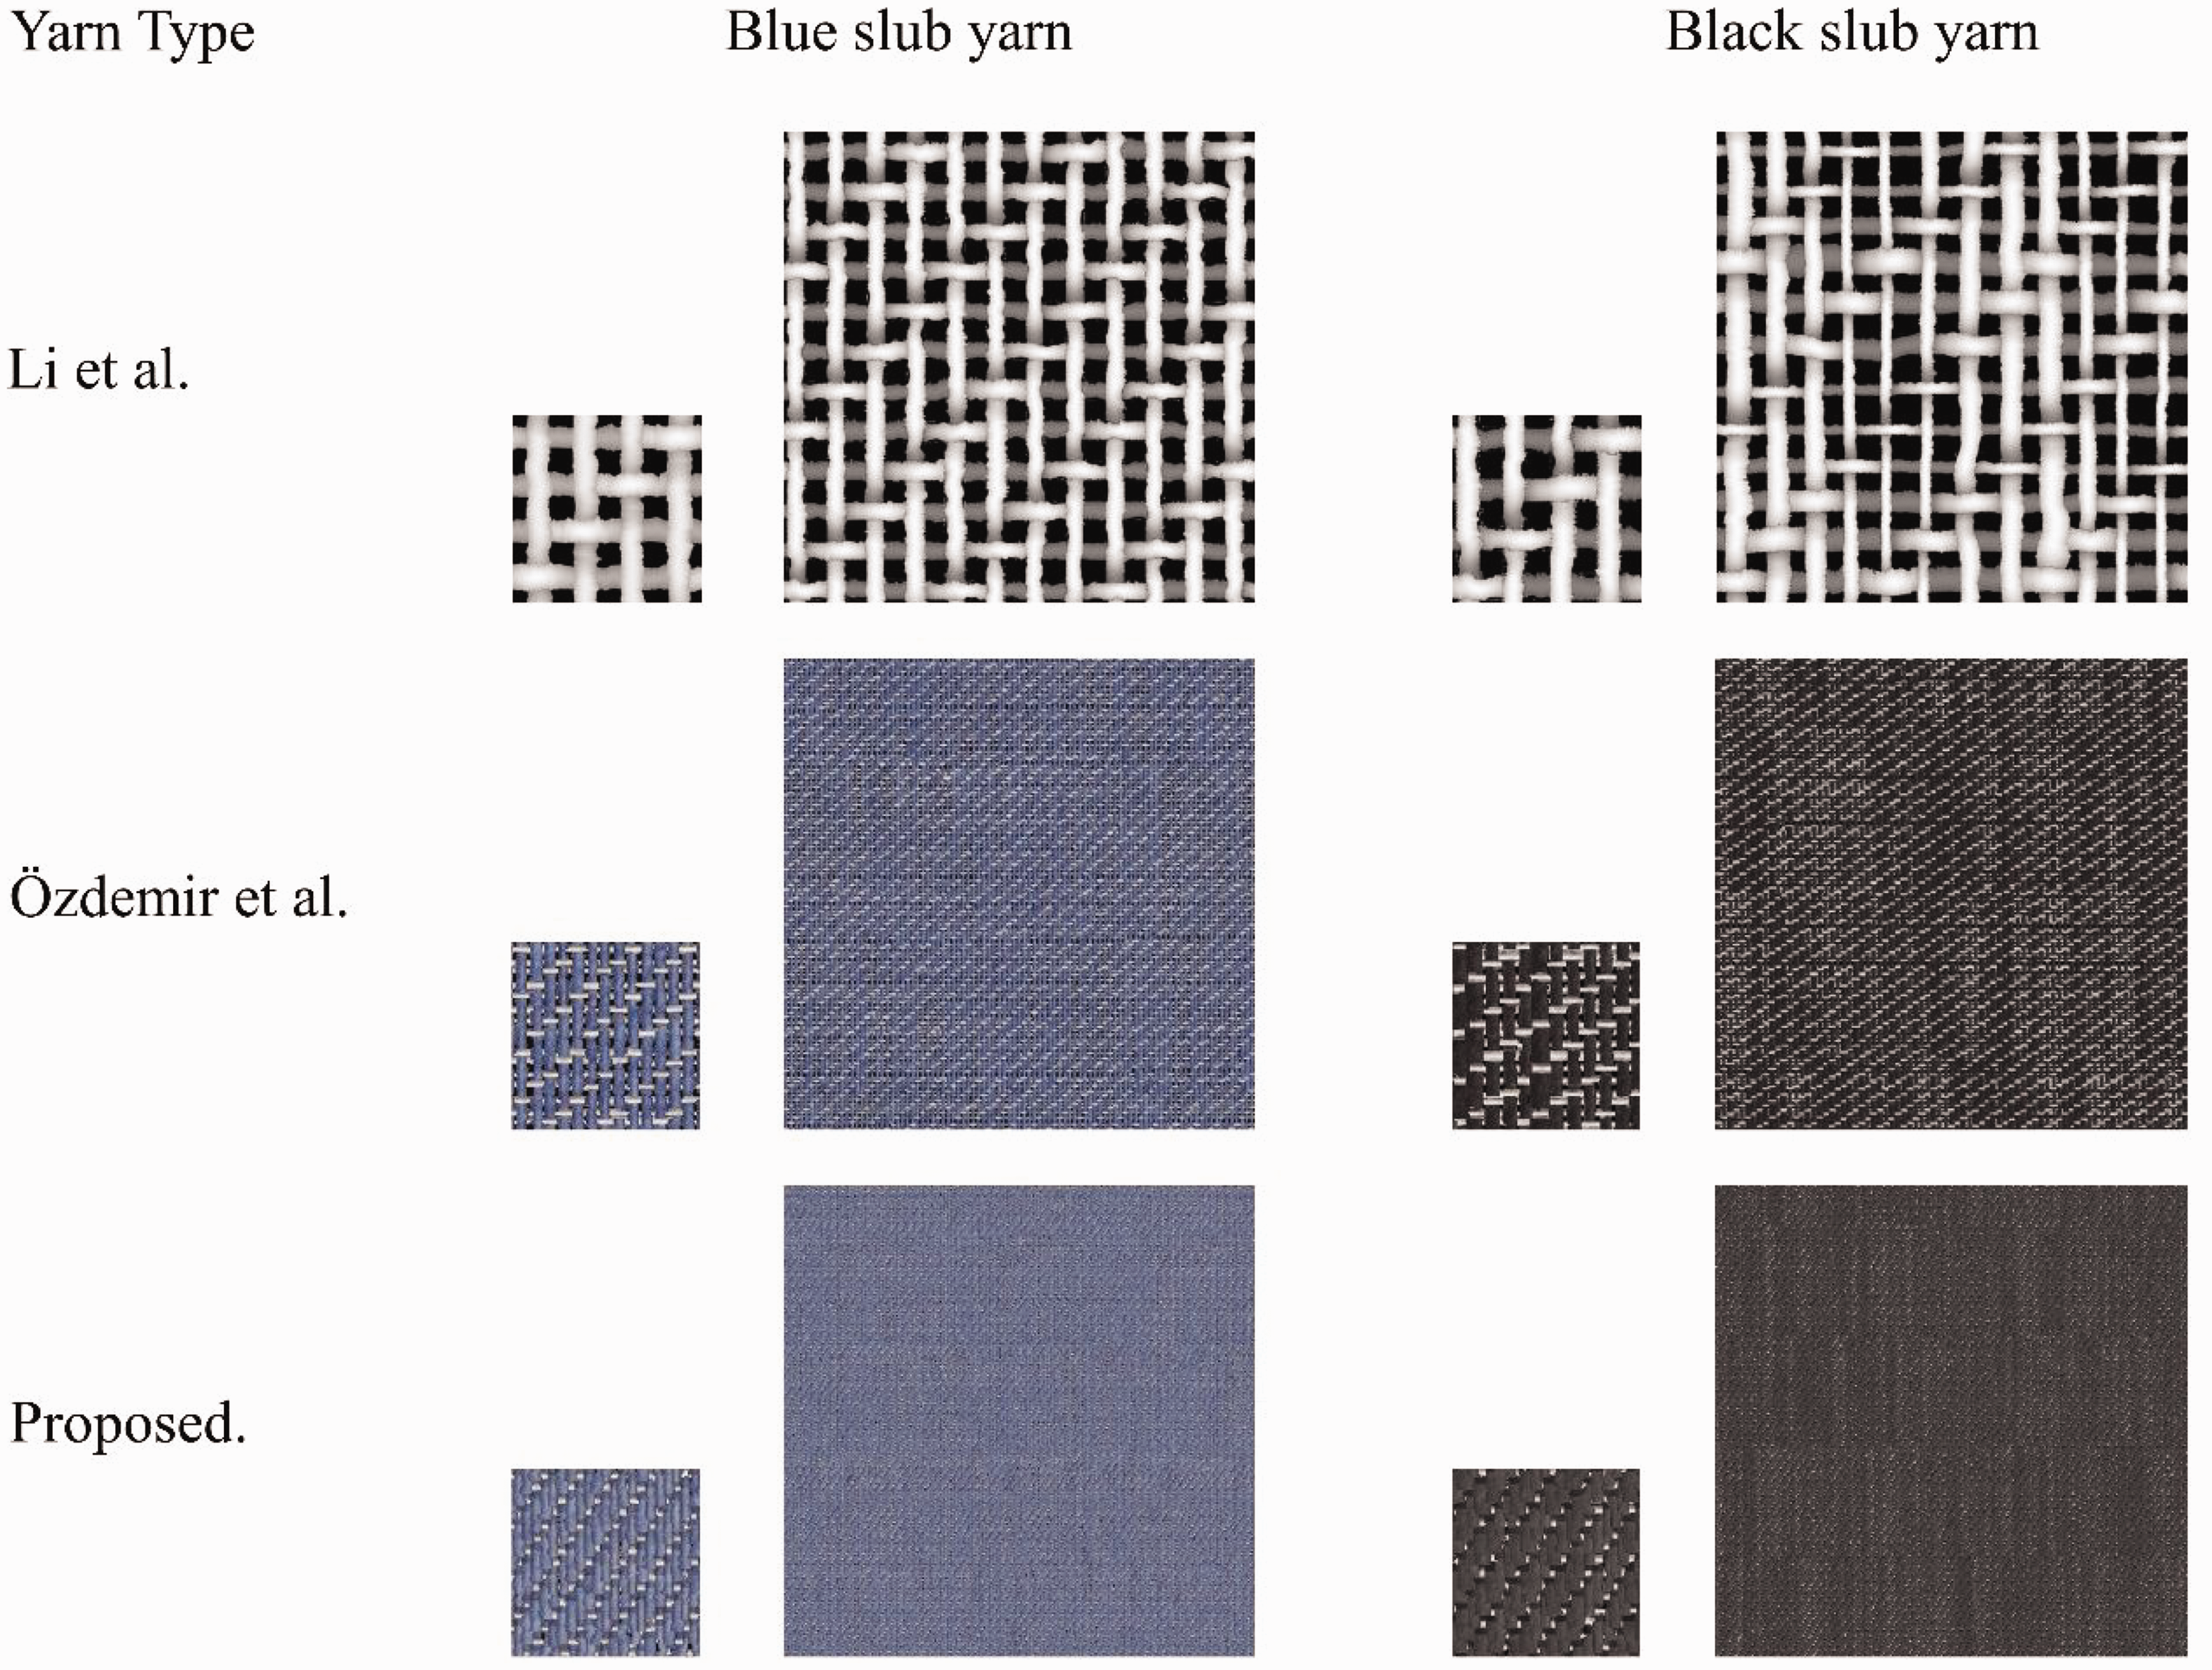
The method used by Li et al. 8 added a light intensity curve model to the yarn surface, resulting in a stereoscopic appearance. But this method aimed to observe the yarn morphologies and fabric structures by using binary images of yarns. In addition, the simulated fabric densities were low. The final results did not have the appearance of actual fabrics. Özdemir et al. 14 created woven fabrics resembling actual fabrics for plain and matt weaves from actual yarn images. However, this model has some defects compared with the method proposed in this article. First, the fabric simulations were not very successful for twill weaves. This is because, in twill structures, a floating section in one direction comes against an intersecting section in the other, and thus a fabric simulation for twill weaves based on sectional fabric geometry enforces uniform spacing between all threads. Second, this method only considered the yarn buckling at the interlacing points without adding the yarn offset. The yarns were arranged neatly in the simulation results without the yarn offset, which did not completely correspond with the actual yarn arrangements. Third, this method lacks a light intensity model. The color of the slub yarn is usually dark blue or black. Using the yarn images directly for simulation without adding the light intensity model would darker the simulation result; the slub effect and fabric texture will not be pronounced. By adding simulated natural light to the yarn, the pixel values of the yarn images are modified to make the texture and slub in the simulation results appear.
The method proposed in this article corrected the previous model’s defects, adding the yarn offset and light intensity curve model of the yarn surface. The simulation results are more consistent with the appearance of the actual slub denim.
Conclusion
This article proposes an effective method for the appearance simulation of slub denim based on image information filling. The slub yarn and denim models were established, the slub yarn image information was filled into the yarn model, and a light intensity curve model was added on the yarn surfaces to complete the appearance simulation of slub denim. Experimental results show that the simulation results obtained by this method are visually similar to actual slub denim and show more superiority over other simulation methods. In order to adapt to the particularity of the slub denim, the parameters in the model can be adjusted, which enhances the adaptability of the model to this type of fabric. This method can provide referential assistance for the production enterprise and save considerable labor and time.
However, the light model is proposed based on the surface reflection rules of cotton yarn. The model needs to be modified if the material of the yarn is changed, or the yarn image is captured in non-uniform light environment. Meanwhile, the proposed simulation method is suitable for woven fabrics with interwoven warp and weft yarns, and is not applicable to knitted or nonwoven fabrics.
Footnotes
Declaration of conflicting interests
The authors declared no potential conflicts of interest with respect to the research, authorship, and/or publication of this article.
Funding
The authors disclosed receipt of the following financial support for the research, authorship, and/or publication of this article: Postgraduate Research & Practice Innovation Program of Jiangsu Province (No. KYCX22_2348).