
Abstract
Ultrasonic welding is a universal, clean, and secure alternative joining method. Alternative joining technologies are used increasingly to fulfill specific functional requirements of the seam, such as fluid impermeability to achieve positive bonding during the assembly of technical textiles. In this research, the effect of important ultrasonic welding parameters on peel strength and weld seam thickness was investigated for flexible and lightweight textile material, which is a valuable innovative hybrid textile for technical applications like architectural, construction, and protective textiles. Three main welding parameters with three different levels were selected based on the preliminary test results of 6 and 12 mm welding widths, and a superimposed type of seam was applied. Light scanning microscopic images were used to examine the effective weld locations and their morphology at the joining interface. The parametric influence of ultrasonic welding technique on-seam quality and their tendencies in the relationship were analyzed. Optimized peel strength yielding parametric levels were also assessed numerically. The result shows that the optimal peel strength value was obtained at a welding speed of 2.318 m/min, power of 119.382 W, and pressure force of 349.729 N for a 12 mm welding width. The weld seam thickness had an inverse relationship with the peel strength, and a higher amount of thickness was reduced to 12 mm welding width than 6 mm. Microscopic cross-sectional image of weld seam indicated that a compressed yarn between the coating material at higher welding power and pressure force in lower welding speed. A nonlinear quadratic numerical model was developed to predict the peel strength, and their results were close to the regressed diagonal line against the actual points. The statistical analysis was carried out to show the significant effect of process parameters on peel strength, whereby the obtained results were statistically significant.
Introduction
Ultrasonic welding is a promising technology used to join thermoplastic materials for different technical applications starting from the late 1960s. Due to its several benefits, the application areas of the process cover several sectors like tents and roofs, automotive, electronics and appliances, medical, and packaging. It recently covers fine clothing too. There are only a few investigations about the parameters of this process and their influence on the quality of the welded seam using continuous ultrasonic welding method, especially for peel strength. And, the mechanism of this technology is not yet fully understood. To clarify these issues further, the paper investigates the effect of welding process parameters on peel strength for one specific material that is commonly used for tents, to recognize some main trends in the relations, to optimize the peel strength, and to assess superior peel strength yielding parametric levels of ultrasonic welding for membranes. The microscopic cross-sectional image is further used to investigate the interfacial microstructure and the bond locations. After a review of the state of the art, materials, methods, and machines used for this study are explained. Various results at different speeds are analyzed and critically commented on.
State-of-the-art
Ultrasonic welding is the joining of thermoplastic materials through the use of heat generated from high-frequency mechanical motion. It is accomplished by converting high-frequency electrical energy into mechanical motion. That mechanical vibration, which along with applied force, creates frictional heat at the plastic components’ mating surfaces (joining area) so the plastic material melts and forms a molecular bond between parts.1–3 Thermoplastic synthetic materials are utilized in ultrasonic welding because the material can make a transition from solid to liquid state and bond. Suitable materials for processing with ultrasonic technology are identified as 100% thermoplastic and thermoplastic blends up to 35% or 40% non-synthetic fiber contents. 4 When welding similar materials, the uniform thickness is a favorable characteristic to weld successfully. 5 Ultrasonic welding technology has been extensively studied in recent years due to the increased popularity of professional outdoor activities like sports and demands for the comfort and safety performance of outdoor equipment. Many outdoor activities need to withstand harsh natural environments, requiring outdoor equipment that is waterproof, windproof, breathable, absorbent, quick-drying, anti-UV, anti-bacterial, and heat insulated, as well as other performance features. Ultrasonic welding technology, due to its pinhole-free feature that gives seams waterproofing and sealing functionality, can be applied not only to outdoor equipment but also to medical protective equipment. 6 Because it prevents contamination and dust production which reduces the risk of infection. Another important ultrasonic welding application in the medical industry is textiles for the items like hospital gowns, sterile garments, masks, transdermal patches, and textiles for clean rooms. 7 It is also applicable in the food industry to create a hermetic seal. It can fasten blister packs and facilitate the manufacturing of a variety of products including toys and disposable lighters. It is used to fuse contact points on cell phones and other consumer electronics that are generally inaccessible with other welding methods. 7
Riedl 8 studied peel and shear strength and tear resistance of ultrasonically sealed coextruded polyolefin films for packaging applications. The author observed that energy and weld force had a significant effect on peel strength for the majority of the materials and the highest peel strength was found at the highest weld forces and highest energies for all materials. And, the peel strength test result ranged from 1.6 to 31 N, and it was generally proportional to weld force and energy. It was expected that excessively high energy, amplitude, and weld force would each increase the rate of internal heating at the faying surface, resulting in excessive squeeze flow and reduced weld strength. Better coupling of the horn to the part at the higher forces is allowing better heating. The higher weld forces may have promoted better alignment between the horn and the anvil, in turn promoting more uniform welding. 8 Nguyen et al. 9 investigated the effects of different roller profiles on the microstructure and peel strength of the ultrasonic welding joints of nonwoven fabrics. The results showed that no welding defects, such as cracks or blowholes, were visible in the melted zone. They reported that both the load and the peel strength were proportional to the welding area and the area ratio. It was found that the peel strength of the welding joints with brick structures were higher than the peel strength in the case of solid line structures. They have also explored that the peel load distribution was opposed to the strength distribution in all cases of the fabricated roller profiles. 9 van Oordt et al. 10 researched the lamination of polyethylene (PE) composite films by ultrasonic welding and investigated the peel behavior and optimum welding parameters. They explored that the increase in pressure, sealing time, and amplitude led to an increase in peel strength. At a certain point, vibration effects occurred or melted PE starts to be displaced leading to an abrupt decrease of the seal strength. 10
Makwana and Patel 11 reviewed experimental investigation of ultrasonic welding on thermoplastic material and have performed ultrasonic welding on polycarbonate (PC) and acrylonitrile butadiene styrene (ABS) materials by varying weld pressure, amplitude, and welding time. They examined tensile strength, weld quality, and microstructure of the welded specimens to the aforesaid process variables. They have also revealed that amplitude is the most influencing factor out of three process variables. 11 Parmar and Pandya 12 performed an experimental investigation of ultrasonic welding on non-metallic material by selecting amplitude, time, and pressure as input variables and have executed ultrasonic welding on the acrylonitrile butadiene styrene (ABS). The effect of these variables has been examined in terms of weld strength and revealed that amplitude is the most influencing factor for welding strength. 12 van Oordt et al. 10 have also revealed four different peel regimes depending on the parameter combination: the first one is interlaminar peeling at low-peel strength with uniform peeling along a weakly bonded PE lamination layer; second, transition tearing at intermediate peel strength showing areas of interlaminar peeling and translaminar tearing; third, translaminar tearing at high-peel strength showing tears through the entire film; and forth, undefined tearing at varying tear strength occurring when vibration effects during welding lead to insufficient contact of the films or high pressures lead to a displacement of PE. It is further important to allow the systematic adjustment of ultrasonic welding parameters for PE films. 10
Rajput et al. 13 studied an experimental investigation on peel strength during ultrasonic welding of polypropylene H110MA by considering weld time, hold time, and amplitude as process variables. They have highlighted the following outcomes based on the experimentation. Amplitude is the most influencing variable followed by hold time and weld time using ANOVA, and it is visible that the amplitude has a significant effect on the peel strength. And the other, the predicted value of the S/N ratio is better than the computed one, and the optimized parametric setting for the peel strength is weld time (1200 ms), hold time (900 ms), and amplitude (75%). Riedl et al.3,8 investigated the peel strength of coextruded polyolefin bags created in a vertical form fill seal machine with ultrasonic end seals. They observed that low energy and amplitude resulted in relatively high strength for the top weld of one material and low production rate resulted in high strength for the top weld of two materials as well as in the bottom weld for two materials. The peel strength for the fifth material was directly proportional to the energy. It was anticipated that peel strength would be generally inversely proportional to weld energy and amplitude, it was also anticipated that welds made with excessively low weld energy and amplitude would be weak as a result of under welding. Results ranged from 1.2 to 14 N for peel strength of top welds and 1.7 to 17 N for bottom welds. However, none of the tests were found to be statistically significant. 8 Rajput et al. 13 stated lap joints of polypropylene using ultrasonic welding and reported the joint’s behavior using Thermogravimetric Analysis (TGA), Fourier transform infrared spectroscopy (FTIR), and Differential Scanning Calorimetry (DSC). Scanning electronic microscopy (SEM) was employed to explore the welded and non-welded areas of the prepared samples. Welding time, pressure, and amplitude have been considered as process variables whereas the weld strength and plasticity were taken as output responses.
Materials and methods
Materials
Hybrid Textile: H5571-0283-ECO, provided by company HEYtex Bramsche GmbH, Germany, was selected and considered as a common tent material. It is one of the professional material series, which stands for extremely robust PVC coated fabrics for light structures such as pavilions, large and warehouse tents to a hall structure roof, or weather protection during all seasons. According to the producer, 14 it has high-quality flame retardant, heat, and cold-resistant properties according to various standards stated in Table 1.
Specification of used material H5571-0283-ECO tentorium 650 15 .

The material is based on a flexible lightweight textile plain-woven fabric, made of 100% polyester, coated with PVC considering the end-use application area. Weight and thickness were measured according to DIN EN ISO 2286-2 and ISO 5084 standards, resulting in values of 639 g/m2 and 0.52 mm, respectively; the rest physical properties are listed in Table 2.
Physical properties of H5571-0283-ECO tentorium 650 material 15 .

Ultrasonic Welding: Ultrasonic welding was carried out using a new generation NUCLEUS ROTOSONIC DX1 continuous ultrasonic machine with the ultrasonic generator of DG1 1000 W and 35 kHz frequency, produced by a company of NUCLEUS GmbH, Germany. It uses titanium sonotrodes with maximum welding width of 12 mm. Whereas, the anvil wheel diameter can be selected as either 40 or 65 mm with 3, 6, or 12 mm welding width depending on the selected anvil wheel. Using sonotrode and anvil wheel, the maximum weld width of 12 mm could be achieved. The machine allows the welding speed range from 1 to 21.4 m/min, welding power from 5 to 1000 W, and welding pressure force from 6 to 510 N. As per the investigation of preliminary experiment on the material, the working range of this material was found in 40–100 W, 1–3 m/min, and 40–300 N for 6 mm welding width and 60–120 W, 1–3 m/min, and 40–350 N for 12 mm welding width respective of welding power, speed, and pressure force. A flat or plain anvil wheel was selected for welding the test samples with a 65 mm diameter by considering its application.
Methods
All measurements were carried out under standard testing climatic conditions at a temperature of 20°C ± 2°C and 65% ± 4% relative humidity according to DIN EN ISO 139 standard. Ultrasonically welded seams were tested according to the peel strength in a warp direction and its morphological structure was used to examine the effective weld locations at the joining interface. The test was selected considering the end-use application of the material. Welding was done for 6 and 12 mm welding widths. During welding, a suitable superimposed type of seam was produced by overlapping one over the other by considering a 15 mm seam allowance 2 which is higher than the width of the anvil wheel. For each 6 and 12 mm welding width, 27 different combinations of welding parameters were used considering three factors and three levels. Based on the preliminary experiments and full factorial design of experiments, the selected levels were 2, 2.5, and 3 m/min for speed, 150, 225, and 300 N for pressure force, and 40, 70, and 100 W for power to 6 mm welding width, while 2, 2.5, and 3 m/min for speed, 200, 275, and 350 N for pressure force, and 60, 90, and 120 W for power were selected to 12 mm welding width. The selected levels were different for 6 and 12 mm welding widths because of the welding process parameter impact on bond strength. The impact of the welding pressure force decreased when the welding width of the anvil wheel increased because the amount of stress developed in the welding area was inversely proportional to the welding width of the anvil wheel.15,16 Similarly, the welding power also affected the amount of energy transferred into the welding area, which was related to the welding width and strongly affected dissipated energy during welding.15,16 This observation was also supported by research 9 according to which both load and peel strength were proportional to the welding area and area ratio.
Adhesive Strength Measurements: The peel strength of the ultrasonically welded sample was tested on the Zwick/Roell-Zmart.Pro tensile testing machine with a constant test speed of 100 mm/min according to DIN EN ISO 11339 standards. The upper and the lower clamping device must be fixed for 25 mm of each unbonded end of the parts to be joined. Because welding was only done on 150 mm and the rest of 50 mm was left unwelded for clamping. The fixture and clamps shall be designed so that, when a force was applied, they moved in a straight line with the specimen as shown in Figure 1(b). The machine provided records showing the traverse movement in millimeters as a function of the force applied. As per the testing standards, the samples were cut into the size of 150 mm × 200 mm in length and width, respectively, and then welded in a weft direction 17 to form a superimposed seam. Then the welded samples were cut into five different 25 mm width samples in the weft direction as shown in Figure 1(a). One hundred and thirty-five samples were prepared for a 6 mm welding width, but 105 samples were tested in the Zmart.Pro tensile testing machine. Similarly, 135 samples were prepared and tested 120 samples out of 135 for a 12 mm welding width. Five samples were taken for each combination in both welding widths. The result was taken from the recorded curve as the average of multiple peaks. The average load can be determined from the curve by drawing the best straight line or by taking the average value between the highest and lowest load in Newtons at least for 100 mm of peeling (the first 25 mm and the last 25 mm were not taken into account) as shown in Figure 1(c), and the average of min-max value was used to achieve more accurate results. The average peel strength was determined in Newtons per 6 and 12 mm bonded sample widths.

Selected prepared welded samples (a), peel strength testing (b), extraction of peel strength result from the recorded curve (c).
Morphological Analysis of Weld Seam: The morphologies of weld seam were observed at 1000 µm using ZEISS light scanning microscope of Axio Cam MRc 5. Once the sample is removed from the main welded sample, it must be mounted and prepared for examination with a light scanning microscope. Three or four samples were mounted by placing them in a cylindrical mold and filling the mold with a resin that embedded the sample and held it firmly during the grinding and polishing operations as shown in Figure 2. Since the selected method was cold mounting, the synthetic epoxy resin inside the mold can be cured or hardened at room temperature 18 within 8 h. Liquid SpeciFix Resin with SpeciFix-20 curing agent was used from SpeciFix-20 Kit to cure the epoxy system at room temperature. These plastic materials embed the sample, and it is transparent. Supporting devices were used to hold it in its proper orientation within the mold until the embedding material had solidified. Once the sample is mounted, the resin block is grounded flat. Thereby, starting with the coarsest grit paper (500, 800, 1200, and 2400), the sample was moved backward and forwards over the paper until a uniform ground finish was obtained. It was then carefully washed under running water to eliminate the scratches completely on the grinding stage otherwise it is difficult to remove in polishing. Polishing was carried out by holding the specimen against the rotating polishing cloth with a diamond paste in the opposite direction. After initial polishing on three-micron diamond paste, the sample was washed in water, rinsed in ethanol, and dried. It was then polished on a one-micron diamond paste for 5 min again. And finally, the sample was carefully washed under running water to remove all traces of the polishing compound and dried before it was ready for examination with the microscope.

Cold mounting process.
Thickness Measurements: Determination of the thickness of the ultrasonic weld seam was carried out on the NUCLEUS ROTOSONIC DX1 ultrasonic machine. The machine itself has the option to analyze the arm position during the continuous welding condition. Thus, the result was taken from the machine directly. During thickness measurement, 105 and 120 samples were measured during welding of 6 and 12 mm widths, respectively. Five samples were taken in each combination for both welding widths.
Statistical Analysis: Design Expert 11 and IBM SPSS were used to evaluate if welding power, speed, and pressure force had a significant influence on the peel strength of ultrasonic weld seam at a significance level of 0.05 (5%) or 95% confidence interval, and to construct the surface plot and actual versus predicted graph, and to develop nonlinear (quadratic) regression predictive model.
Results and discussions
As explained above, the investigated welding process parameters were pressure force, speed, and power for 6 and 12 mm welding widths to show their effect on peel strength and thickness. Using the tensile testing and ultrasonic welding machine, the average peel strength and thickness of the ultrasonically welded seam were determined for 21 and 24 different welding combinations using 6 and 12 mm welding widths, respectively. During welding, only six combinations for a 6 mm welding width and three combinations for a 12 mm welding width were not produce welded seam. The value of the test result was presented in Table 3 in terms of the average force per bonded sample width in N/mm for peel strength and mm for thickness. The average value of five samples is shown in each combination.
Weld seam peel strength (N/mm) and thickness (mm) results for 6 and 12 mm welding widths.

Effect of welding process parameters on peel strength
Figures 3(a) and 4(a) demonstrate the peel strength of the ultrasonic bonds obtained using 6 and 12 mm plain anvil wheels at 2 m/min welding speed, respectively, and the peel strength ranged from 15.28 to 25.40 N for 6 mm welding width and from 19.61 to 34.79 N for 12 mm welding width. The highest peel strength of the bond was obtained at the highest welding pressure force (300 N) and highest welding power (100 W), and the lowest one of the bonds was attained at the lowest welding pressure force (150 N) and the lowest welding power (40 W) for 6 mm welding width at 2 m/min welding speed, cf. Figure 3(a). Whereas for 12 mm welding width, the highest peel strength of the bond was similarly obtained at the highest welding pressure force (350 N) and highest welding power (120 W), and the lowest one of the bonds was found at the lowest welding pressure force (200 N) and the lowest welding power (60 W), cf. Figure 4(a). In both welding widths at 2 m/min welding speed, the peel strength increased with the rising welding pressure force and power to all bonded samples, but a significant difference was observed in all welding pressure forces at the highest welding power (100 W) for 6 mm welding width compared to the other results.

Weld seam peel strength (N/6 mm) of 6 mm welding width at 2 (a), 2.5 (b), and 3 (c) m/min welding speeds.

Weld seam peel strength (N/12 mm) of 12 mm welding width at 2 (a), 2.5 (b), and 3 (c) m/min welding speeds.
In 2.5 and 3 m/min welding speeds shown in Figures 3(b), (c), 4(b), and (c), the peel strength ranged from 14.71 to 20.03 N and from 13.99 to 18.19 N for 6 mm welding width, respectively, and it ranged also from 17.18 to 32.75 N and from 18.5 to 29.2 N for 12 mm welding width, respectively. The peel strength of the bond obtained at the highest welding pressure force (300 N) and the highest welding power (100 W) was the highest, and the lowest of the bond was found at medium welding power (70 W) and the lowest welding pressure force (150 N) for 6 mm welding width at 2.5 and 3 m/min welding speeds, cf. Figure 3(b) and (c). Whereas, the highest peel strength of the bond was similarly obtained at the highest welding pressure force (350 N) and highest welding power (120 W), and the lowest one of the bonds was attained at the lowest welding pressure force (200 N) and the medium welding power (90 W) for 12 mm welding width, cf. 4(b) and (c). The speed affected the peel strength significantly because the welded seam was not produced at the lowest welding power (40 W) with all welding pressure forces (150, 225, and 300 N) in 2.5 and 3 m/min welding speeds for 6 mm welding width, cf. Figure 3(b) and (c), and was not also produced at 3 m/min welding speed for 12 mm welding width, cf. Figure 4(c). However, the impact of the welding speed on peel strength was not too high for the rest of the welding powers (70 and 100 W) in both welding widths. Furthermore, these results will be valid for other types of textile material as well, provided that the material and welding conditions correspond to these aspects: a lower melting temperature difference (<22°C), a high amount of thermoplastic contents (>65%), and thickness in addition to a flexible and lightweight coated/laminated textile. 15 And, ultrasonic welding has to be performed in the working range of welding parameters as part of a high-quality welding process based on a closer welding width and an identical anvil engraving. 15
Effect of Welding Pressure Force: When the welding pressure force increased from the lowest to the highest value at 2 m/min welding speed shown in Figures 5(a) and 6(a), the peel strength of the bond slightly increased and the effect of welding power in peel strength also increased with increasing welding pressure force for both welding widths. Except for the lowest welding power (40 W) of 6 mm welding width, the peel strength slightly increased when the welding pressure force increased at 2.5 m/min welding speed for both welding widths, cf. Figures 5(b) and 6(b). Similarly, the peel strength slightly increased with the rising welding pressure force at 3 m/min welding speed for both welding widths, cf. Figures 5(c) and 6(c), except the lowest welding power (60 W) of 12 mm welding width. The effect of welding power on peel strength was also increased with increasing welding pressure force for both welding widths at 2.5 and 3 m/min welding speeds. Because the purpose of the welding pressure force was to provide contact between the horn and materials to transmit the ultrasonic vibrations and to bond the heated surfaces. Thus, the lower welding pressure force provided poor contact and poor energy transmission. Increasing the pressure force was, therefore, improved the peel strength initially and slightly affected the peel strength until the optimal level; however, the higher pressure force oriented the polymer chains during ultrasonic welding and decreased the peel strength. A too high-pressure force had also damaged the material and reduced the peel strength ultimately. Besides, the coefficient analysis of the main independent variables (pressure force, power, and speed) showed that the pressure force was not a significant predictor of peel strength for 6 mm welding width because of a higher p-value (0.2698), but it was a significant predictor for 12 mm welding width. However, the interaction effect between pressure force and power, and between pressure force and speed was not a significant predictor for 6 and 12 mm welding widths due to the higher p-values (0.7809 and 0.7828) for 6 mm and (0.5467 and 0.8226) for 12 mm, respectively. Square of welding pressure force was not a significant predictor of peel strength for 6 and 12 mm welding widths because of the higher p-values (0.9507 and 0.9907), respectively. From the Pearson correlation analysis, the pressure force had positive correlation values of 0.077 and 0.157 with the two-tailed significant values of 0.373 and 0.068 to the dependent variable for 6 and 12 mm welding widths, respectively. Since the two-tailed correlation was significant at the 0.01 level, the pressure force had an insignificant correlation value with the dependent variable for both welding widths.

Weld seam peel strength (N/6 mm) as a function of pressure force (N) for 6 mm welding width at 2 (a), 2.5 (b), and 3 (c) m/min welding speeds.

Weld seam peel strength (N/12 mm) as a function of pressure force (N) for 12 mm welding width at 2 (a), 2.5 (b), and 3 (c) m/min welding speeds.
Effect of Welding Power: When the welding power increased from the lowest to the highest value at 2 m/min welding speed shown in Figures 7(a) and 8(a), the peel strength of the bond slightly increased and the effect of welding pressure force on peel strength relatively small for both welding widths. Except for the lowest welding power (40 W) of 6 mm welding width, the peel strength slightly increased when the welding power increased at 2.5 m/min welding speed for both welding widths, cf. Figures 7(b) and 8(b). Similarly, the peel strength increased with the rising welding power at 3 m/min welding speed for both welding widths, cf. Figures 7(c) and 8(c), except the lowest welding power (60 W) of 12 mm welding width. The effect of welding pressure force on peel strength was relatively smaller than the effect of welding power with increasing welding pressure force for both welding widths at 2.5 and 3 m/min welding speeds. Because the integrity of a bond is dependent on the correct amount of energy provided, which is governed by power and time. Moreover, the coefficient analysis of the main independent variables (pressure force, power, and speed) proved that the welding power was a significant predictor of peel strength for 6 and 12 mm welding widths. The interaction effect between pressure force and power was not a significant predictor of peel strength for 6 and 12 mm welding widths because of the higher p-values (0.7809 and 0.5467), respectively, but the interaction effect between power and speed was a significant predictor for 6 and 12 mm welding widths. Square of welding power was also a significant predictor of peel strength for 6 mm but not for 12 mm welding width due to a higher p-value (0.1292). From the Pearson correlation analysis, the power had positive correlation values of 0.764 and 0.722 with the two-tailed significant values of 0.000 and 0.000 to the dependent variable for 6 and 12 mm welding widths, respectively. The power had a significant two-tailed correlation value with the dependent variable for both welding widths, because the correlation was significant at the 0.01 level.

Weld seam peel strength (N/6 mm) as a function of power (W) for 6 mm welding width at 2 (a), 2.5 (b), and 3 (c) m/min welding speeds.

Weld seam peel strength (N/12 mm) as a function of power (W) for 12 mm welding width at 2 (a), 2.5 (b), and 3 (c) m/min welding speeds.
Effect of Welding Speed: The peel strength slightly decreased with the rising welding speed from 2 to 3 m/min for all welding pressure forces except for the lowest welding power (40 W) at 2.5 and 3 m/min welding speeds for 6 mm welding width, cf. Figure 5(b) and (c), and 3 m/min welding speed for 12 mm welding width, cf. Figure 6(c). The value at the lowest welding power had become evidence for decreasing peel strength to a large extent with rising welding speed. This is due to insufficient and inefficient energy transmission at a higher welding speed during welding. On the contrary, a too slow welding speed damaged the material and decreased the peel strength, and increased the amount of energy dissipation. Further, the coefficient analysis of the main independent variables (pressure force, power, and speed) showed that the welding speed was a significant predictor of peel strength for 6 and 12 mm welding widths. The interaction effect between pressure force and speed was not a significant predictor of peel strength for 6 and 12 mm welding widths due to the higher p-values (0.7828 and 0.8226), respectively; whereas, the interaction effect between power and speed was a significant predictor for 6 and 12 mm welding widths. Square of welding speed was also a significant predictor of peel strength for 6 and 12 mm welding widths. From the Pearson correlation analysis, the speed had negative correlation values of −0.449 and −0.511 with the two-tailed significant values of 0.000 and 0.000 to the dependent variable for 6 and 12 mm welding widths, respectively. Thus, the speed had a significant two-tailed correlation value with the dependent variable for both welding widths, because the correlation was significant at the 0.01 level.
ANOVA Analysis: A multiple correlation coefficient (R) showed a 90.9% and 93.9% correlation between the dependent variable (peel strength) and independent variables in the model summary analysis of nonlinear regression for 6 and 12 mm welding widths, respectively. Thereby, a higher correlation (more than 50%) between each other was investigated for both welding widths. The amount of variance accounted for or explained by the main independent variables (pressure force, power, and speed) with their interaction effect on the dependent variable was 92.09% and 94.31% for 6 and 12 mm welding widths, respectively. The correlation coefficients (R2) were very higher (more than 80%), thus the fitted models can be used to predict the relationship between the independent variables and the dependent variable. Thus, polynomial curve fitting was applied to represent the relationship between the independent variables and the dependent variable, and fitting aptness was assessed by comparing the coefficient estimation (R2). The higher the coefficient, the better the model was fitted to the experimental data. Generally, the model was significant, and the independent variables were a significant predictor of the dependent variable at F(9) = 21.98, p = 0.0001, and R2 = 0.9209 for 6 mm welding width, and F(9) = 31.31, p = 0.0001, and R2 = 0.9431 for 12 mm welding width using ANOVA analysis of the quadratic model. From model fit statistics, the Adjusted R2 = 0.8790, Predicted R2 = 0.7994, and Adequate Precision = 14.7544 for 6 mm welding width, and Adjusted R2 = 0.9130, Predicted R2 = 0.8552, and Adequate Precision = 19.4364 for 12 mm welding width were found. When the difference between Adjusted R2 and Predicted R2 was less than 0.2, the model was fitted, and the difference was found as 0.0796 for 6 mm, and 0.0578 for 12 mm welding width. Adequate precision measures the signal-to-noise ratio, and a ratio greater than 4 is desirable. Thus, the ratio of 14.754 and 19.436 indicated an adequate signal for 6 and 12 mm welding widths, respectively. Both models can be used to navigate the design space.
A nonlinear (quadratic) regression predictive model of peel strength was developed based on the three main welding parameters and their interaction effect with three different levels. If the main independent variables and their interaction effect, cf. Table 4, is not a significant predictor of peel strength, it will be considered as zero or neglect their effect on the developed numerical model. Thus, a multiple nonlinear regression predictive equation of peel strength was expressed for 6 mm welding width, as presented in equation (1), because the effect of pressure force (F), pressure force square (F2), pressure force and power (F × P), and pressure force and speed (F × V) were not a significant predictor of peel strength. Further, the peel strength surface plot was constructed to show the design points above and below the predicted value in Figure 9(a) to (c) for 6 mm welding width at welding speeds of 2, 2.5, and 3 m/min, respectively.

Coefficients analysis of dependent variable (peel strength) for 6 and 12 mm welding widths.


Surface plot of peel strength for 6 mm welding width at 2 (a), 2.5 (b), and 3 (c) m/min welding speeds.
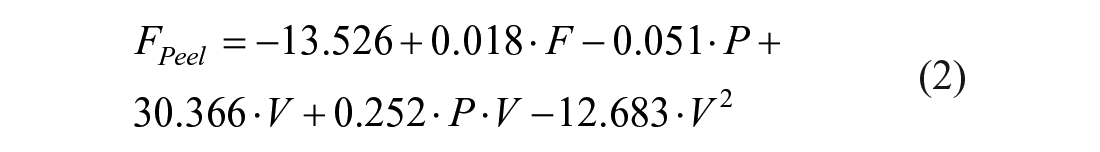
Considering the significance value of main independent variables with their interaction effect given in the coefficient analysis of Table 4, the effect of pressure force square (F2), power square (P2), pressure force and power (F × P), and pressure force and speed (F × V) were not a significant predictor of peel strength, and their effects were neglected in the developed numerical model. Thus, a multiple nonlinear regression predictive equation of peel strength was expressed for 12 mm welding width, as presented in equation (2). Based on equation (2), the peel strength surface plot was constructed to show the design points above and below the predicted value in Figure 10(a) to (c) for 12 mm welding width at 2, 2.5, and 3 m/min welding speeds, respectively.

Surface plot of peel strength for 12 mm welding width at 2 (a), 2.5 (b), and 3 (c) m/min welding speeds.
The actual equation factors were used to develop both equations rather than the estimated coefficient; thus, the levels should be specified in the original units for each factor. The surface response factor (peel strength) could be predicted for the given level of each factor according to these equations. However, this equation should not be used to determine the relative impact of each factor because the coefficients were scaled to accommodate the unit of each factor, and the intercept was not at the center of the design space. Furthermore, the actual verse predicted value of peel strength is illustrated in Figure 11(a) and (b) for 6 and 12 mm welding widths considering zero as no-weld, respectively.
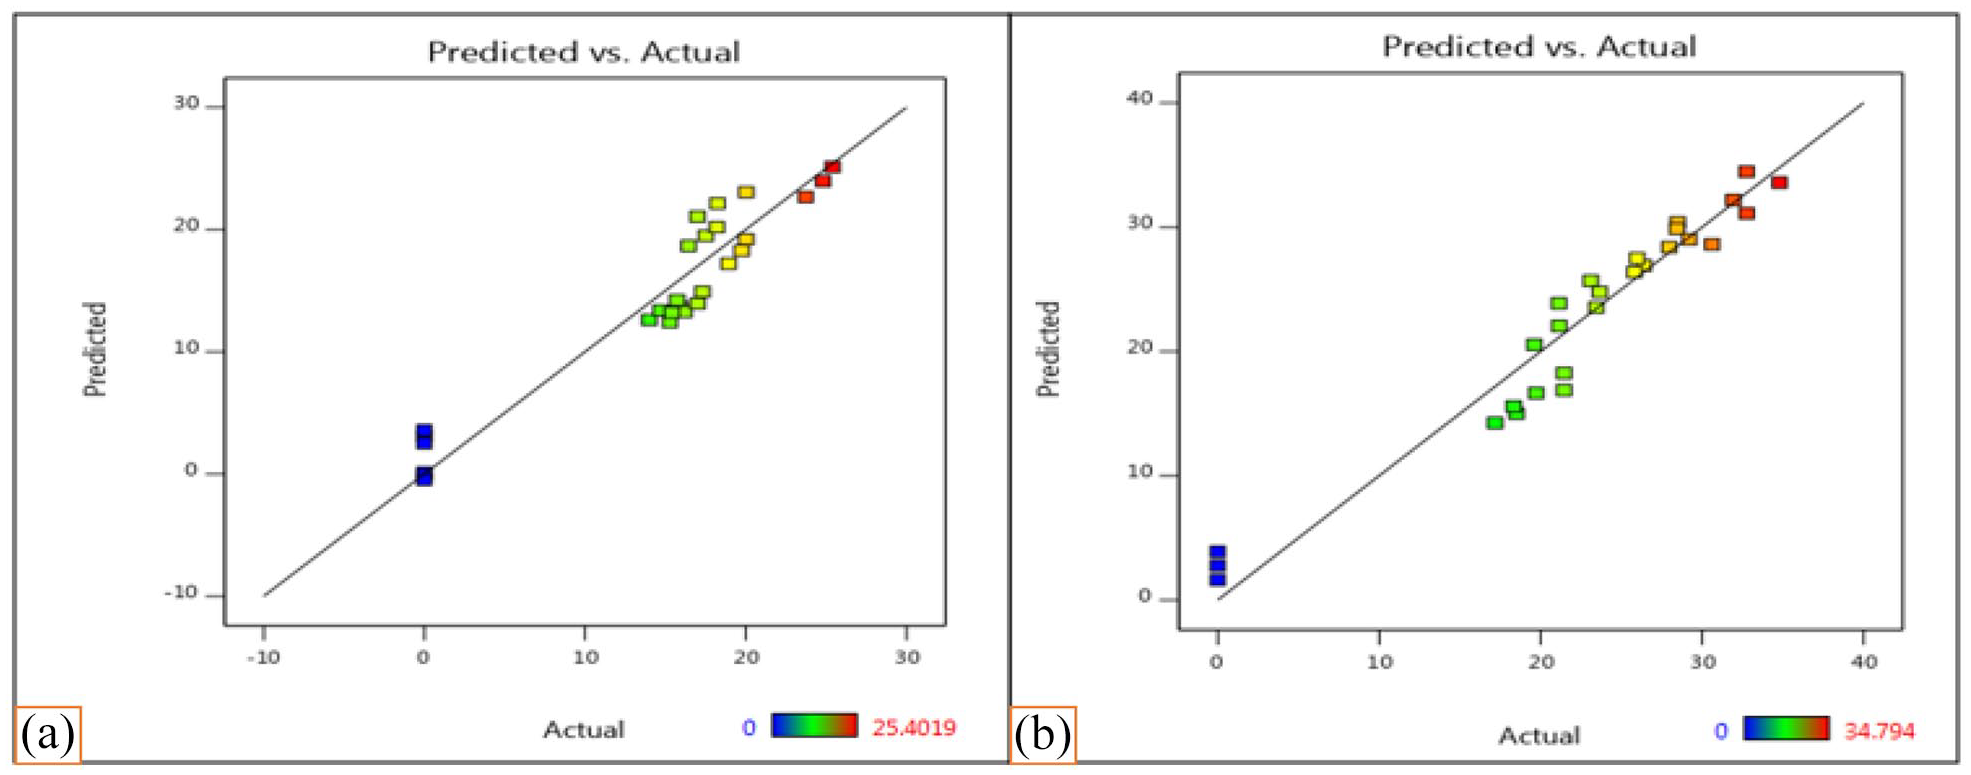
Actual vs predicted peel strength of 6 mm (a) and 12 mm (b) welding widths.
Statistical optimization: Considering welding pressure force, power, speed, and peel strength as constraints, the peel strength was optimized numerically using Design Expert 11. The goal, importance, and lower and upper limit of all constraints were set before starting the optimization step. The goal of each constraint was selected among the available options (i.e. maximize, minimize, in range, equal to, and target). Based on the preliminary test results of the material, the upper and lower limit was set for 6 and 12 mm welding widths. The importance of each constraint can be set in value starting from one up to five. Thus, the goal of peel strength was set to maximize the result within the lower to the upper limit (13.99–25.4 N) for 6 mm welding width, and (17.18–34.79 N) for 12 mm welding width considering their importance as five out of five. While the goal of each welding pressure force, power, and speed was set within the range, and their limit was set (150–300 N, 40–100 W, and 2–3 m/min) for 6 mm welding width and (200–350 N, 60–120 W, and 2–3 m/min) for 12 mm welding width, respectively. As the result, the optimal value of peel strength (25.278 and 34.798 N) was obtained at welding speeds of 2 and 2.318 m/min, powers of 93.803 and 119.382 W, and pressure forces of 300 and 349.729 N for 6 and 12 mm welding widths, respectively. According to these results, it would be suggested that the optimal parameters in the ultrasonic welding process should be based on the numerical optimization results. In this numerical optimization, 80 and 79 numbers of iterated possible solutions were generated and ordered by their desirability for 6 and 12 mm welding widths, respectively; and the value of desirability is between 0 and 1. The best optimal welding combination was only selected out of the possible solutions for each welding width. Since the welding power was related to the cost and speed related to production, the optimal solutions found numerically indicated a lower production rate with medium power-saving efficiency. The contour plot for desirability and peel strength are constructed at optimal welding speeds of 2 and 2.318 m/min for 6 and 12 mm welding widths as shown in Figures 12 and 13, respectively.

Contour plot of desirability (a) and peel strength (b) for 6 mm welding width at an optimal welding speed of 2 m/min.

Contour plot of desirability (a) and peel strength (b) for 12 mm welding width at an optimal welding speed of 2.318 m/min.
Effect of welding process parameters on weld seam thickness
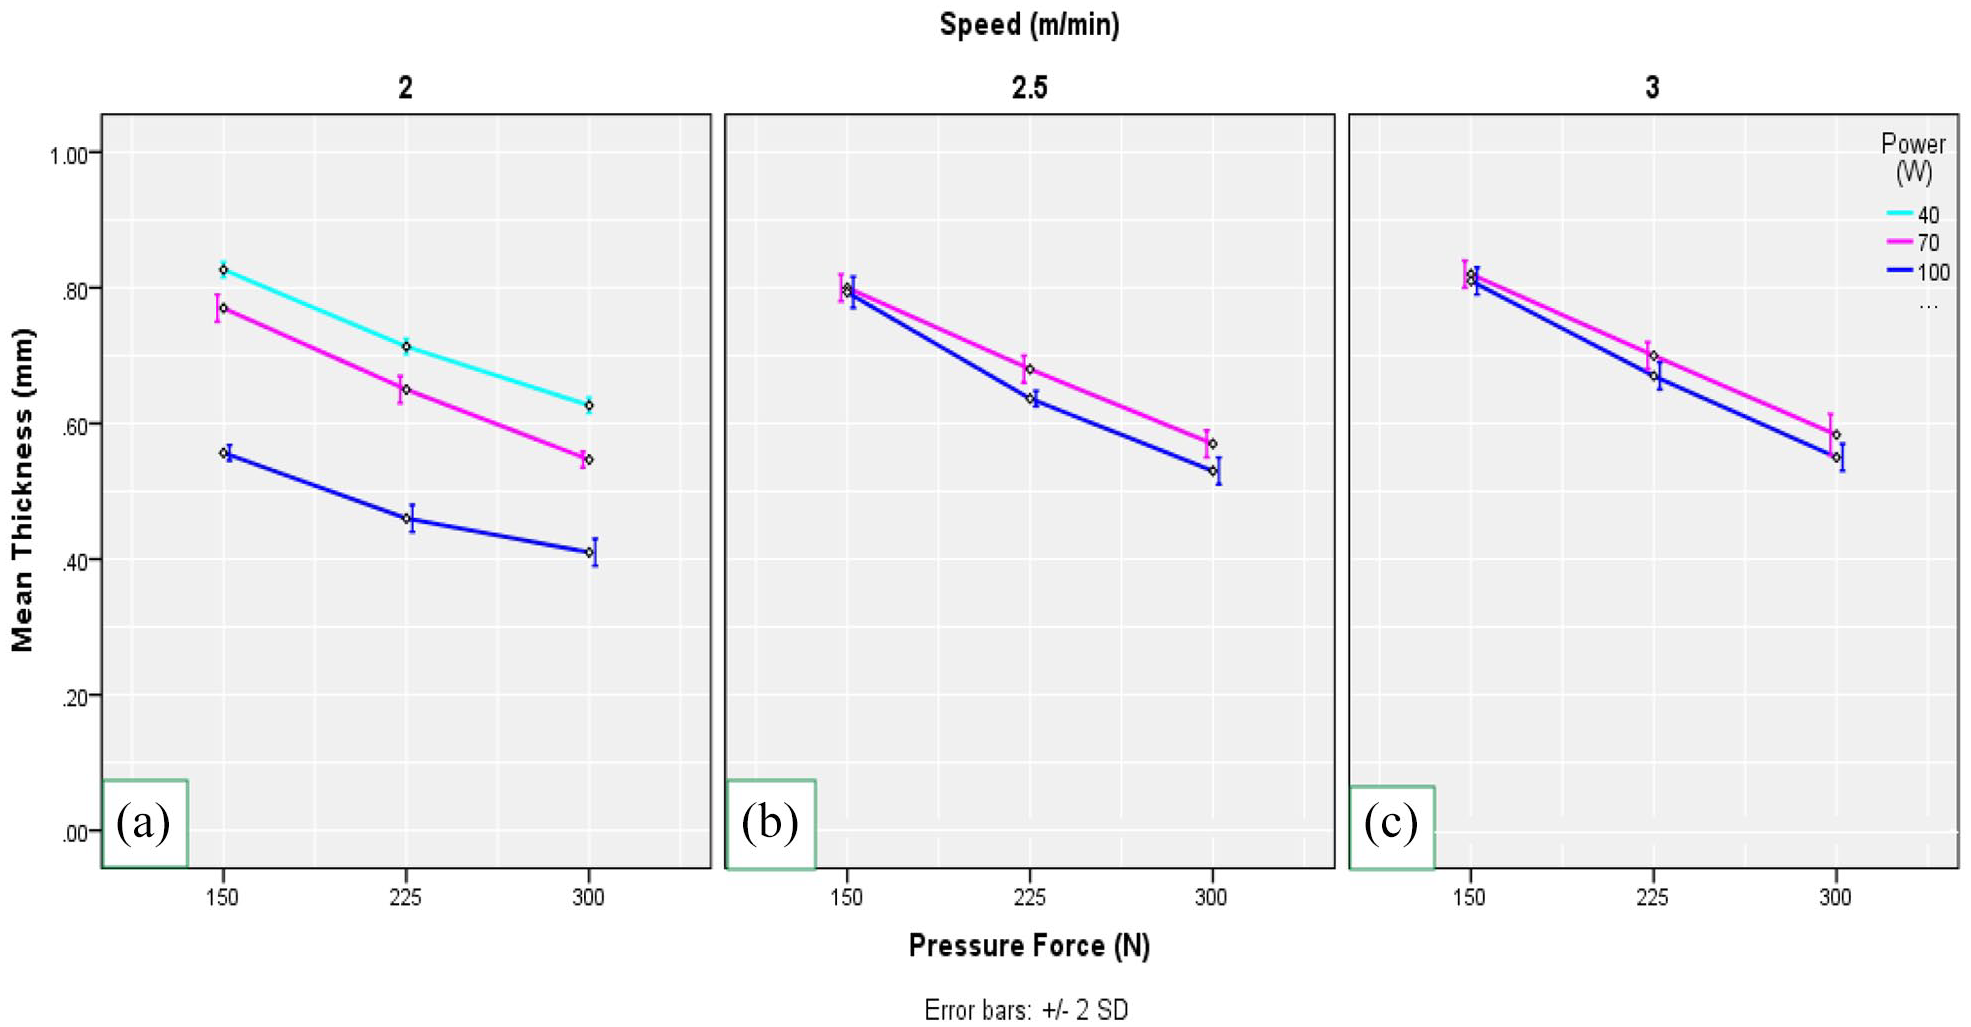
The weld seam thickness was ranged from 0.41 to 0.83 mm at 2 m/min welding speed, from 0.53 to 0.80 mm at 2.5 m/min welding speed, and from 0.55 to 0.82 mm at 3 m/min welding speed for 6 mm plain anvil wheel shown in Figure 14(a) to (c), respectively. It also ranged from 0.51 to 0.74 mm at 2 m/min welding speed, from 0.53 to 0.75 mm at 2.5 m/min welding speed, and from 0.55 to 0.75 mm at 3 m/min welding speed for 12 mm welding width shown in Figure 15(a) to (c), respectively. The highest weld seam thickness was obtained at the lowest welding pressure force (150 N), welding power (40 W), and welding speed (2 m/min), cf. Figure 14(a); whereas, the lowest weld seam thickness attained at the highest welding pressure force (300 N) and welding power (100 W) of the lowest welding speed (2 m/min) for 6 mm welding width, cf. Figure 14(a). For 12 mm welding width, the lowest weld seam thickness was found at the highest welding pressure force (350 N) and welding power (120 W) of the lowest welding speed (2 m/min), cf. Figure 15(a); whereas, the highest weld seam thickness was obtained at the lowest welding pressure force (200 N) and medium and highest welding power (90 and 120 W) of the medium and highest welding speeds (2.5 and 3 m/min), cf. Figure 15(b) and (c).

Weld seam thickness (mm) of 6 mm welding width at 2 (a), 2.5 (b), and 3 (c) m/min welding speeds.

Weld seam thickness (mm) of 12 mm welding width at 2 (a), 2.5 (b), and 3 (c) m/min welding speeds.
When the welding pressure force increased from the lowest to the highest value at 2 m/min welding speed shown in Figures 16(a) and 17(a), the weld seam thickness slightly decreased for both welding widths. Except for the lowest welding power (40 W) of 6 mm welding width, the weld seam thickness was slightly decreased when the welding pressure force increased at 2.5 m/min welding speed for both welding widths, cf. Figures 16(b) and 17(b). Similarly, the weld seam thickness slightly decreased with the rising welding pressure force at 3 m/min welding speed for both welding widths except for the lowest welding power (60 W) of 12 mm welding width, cf. Figures 16(c) and 17(c). Generally, the value of thickness was decreased with the rising welding pressure force and power, but it increased with the rising welding speed to all bonded samples for both welding widths. Thus, decreasing in thickness due to welding was proved in the seam areas. The weld seam thickness had a negative relation with welding pressure force and power, but it had a positive relationship with welding speed. After ultrasonic welding, the highest and lowest value of weld seam thickness had shown a thickness reduction by 20.19% and 60.58% for 6 mm welding width and by 27.89% and 50.96% for 12 mm welding width compared to the material thickness, respectively. This is attributed to the fact that the layer of PVC-coated hybrid textile material was fused under the influence of welding pressure and generated heat during welding. This led to a decrease in thickness and an increase in stiffness of the weld samples. Furthermore, the weld seam thickness had an inverse relationship with the peel strength, and a higher amount of thickness was reduced in the case of 12 mm welding width than that of 6 mm. Approximately, 10% of weld seam thickness reduction difference was observed between 6 and 12 mm welding widths in the lowest and highest value of weld seam thickness.
Weld seam thickness (mm) as a function of pressure force (N) for 6 mm welding width at 2 (a), 2.5 (b), and 3 (c) m/min welding speeds.

Weld seam thickness (mm) as a function of pressure force (N) for 12 mm welding width at 2 (a), 2.5 (b), and 3 (c) m/min welding speeds..
Weld seam morphological analysis
Using a light scanning microscope at 1000 µm magnification power, the selected flexible hybrid textile material had a clearly recognized plain weave structure inside the PVC coating. The image was also used to examine the effective weld locations at the joining interface and the effect of welding process parameters on material for both welding widths. The image showed at the joint interface that the coating material of one material was fused with the other coating material layer during welding. This is due to the melting behavior of coating PVC and woven polyester when exposed to heat. According to these images, both warp and weft yarns of woven polyester fabric inside the coating layer had shown a yarn compressional effect at the joining interface due to the simultaneous influence of welding pressure force and power. When the welding power softened the coating material layer, the welding pressure force simultaneously pressed the material and resulted in yarn compression. And, the effect was more visible on microscopic cross-sectional images of weld seam when the welding power and pressure force were higher at lower welding speed. Although the shape of the yarn was changed due to the compressional force and the ultrasonic heat, the yarn was not broken or cracked, which persisted as continuous media. Because of this, the structure can support the creation of high strength required for welding joints. It was also discovered that a 12 mm welding width had a more effective weld location than a 6 mm welding width. Based on these observations, an optimal transmission of ultrasonic energy to the joint interface and subsequent melting behavior of material was, therefore, important depending on the welding width, geometry, and ultrasonic energy absorption characteristics of the material.1,15,19 Furthermore, the thickness of the weld seam was not uniform throughout the weld seam cross-section, and the heat was not generated equally overall the joint interface. This can be explained by the observation that some of the areas of the PVC coated material layer at the joint interface was totally fused with the other PVC coated material layer, but others still existed as incompletely melted and fused. Since the region of the fused area on the joint interface of the weld seam was large compared to that of unfused, an effective weld location was produced overall the joint interfaces of 6 and 12 mm welding widths using ultrasonic welding techniques through a plain or flat anvil wheel. Figures 18 and 19 show the light scanning microscopic images of 6 and 12 mm welding widths of PVC coated hybrid textile material at weld seam cross-section.

Light scanning microscopic cross-sectional images of the weld seam for 6 mm welding width.

Light scanning microscopic cross-sectional images of the weld seam for 12 mm welding width.
Conclusions
Based on the statistical analysis, welding power and speed were statistically significant welding process parameters to predict weld seam peel strength for 6 mm welding width, whereas the welding power, speed, and pressure force were statistically significant welding parameters for 12 mm welding width. Except for welding pressure force, welding power and speed had a significant correlation value with weld seam peel strength for both evaluated welding widths. It was shown that welding pressure force and power had a positive correlation value, whereas welding speed had a negative correlation value to the weld seam peel strength for 6 and 12 mm welding widths. According to the numerical optimization, the optimal values of weld seam peel strength of 25.278 and 34.798 N were obtained at welding speeds of 2 and 2.318 m/min, powers of 93.803 and 119.382 W, and pressure forces of 300 and 349.729 N for 6 and 12 mm welding widths, respectively. Weld seam thickness had an opposite relationship with the peel strength. It was also shown that welding pressure force and power had a negative correlation value, whereas welding speed had a positive correlation value to the weld seam thickness for both welding widths. Weld seam thickness reduction was observed after ultrasonic welding for both evaluated welding widths. It was found that a higher amount of thickness was reduced in the case of 12 mm welding width than that of 6 mm. Approximately, 10% of thickness reduction was obtained between 6 and 12 mm welding widths. It was also observed that ultrasonic weld seam with 6 mm welding width had a higher peel strength. An effective bond location and plain weave structure inside the PVC coating were observed under a microscope. It was concluded that the shape of the yarn was changed due to the compressional force and the ultrasonic heat. The weld seam thickness was not uniform throughout the weld seam cross-section. It was found that the coated PVC at the joint interface was melted and fused differently, which meant that the heat caused by ultrasonic vibration varied along the cross-sections. Furthermore, the investigated result is important to adapt in the industrial production of outdoor products for technical applications like roof or weather protection. It also enables an uncomplicated, systematic, and rapid choice of welding parameters and helps to circumvent time-consuming peel tests.
Footnotes
Acknowledgements
The authors would like to thank, Institute of Textile Machinery and High-Performance Material Technology (ITM), German Academic Exchange Service (DAAD), Ministry of Science and Higher Education (MOSHE), and Ethiopian Institute of Textile and Fashion Technology (EiTEX) for their valuable support to this research, and appreciate the Nucleus GmbH for allowing us to work on their machine, and also presents a special thanks to Tilo Pilling, Tina Anders, and Jessica Boll for their valuable assistance during production and testing.
Declaration of conflicting interests
The author(s) declared no potential conflicts of interest with respect to the research, authorship, and/or publication of this article.
Funding
The author(s) disclosed receipt of the following financial support for the research, authorship, and/or publication of this article: This research was funded by the German Academic Exchange Service (DAAD) through the EECBP Home Grown Ph.D. Scholarship Program 2019. The article processing charge (APC) was funded by the publication fund of the TU Dresden and Saxon State and University Library Dresden (SLUB).