
Abstract
Continuous ultrasonic welding is one of the new, high-speed and cost-effective methods for joining thermoplastic composites. The purpose of this research is to conduct a quantitative and qualitative study of the process in order to identify and solve challenges in order to achieve high-quality continuous ultrasonic welding in thermoplastics reinforced with unidirectional continuous fibers; specifically GF/PA6. In a quantitative study using the response surface method (RSM), with welding power, speed, and pressure as input parameters and lap shear strength as the response, a statistical design of welding experiments was carried out to obtain the appropriate mathematical equation governing the process and to determine the effect of these factors on shear strength. In a qualitative study, continuous ultrasonic welds were classified based on shear strength into three categories: weak, average, and strong. Using microscopic images of the fracture surface and the cross-sectional area of overlapping adherends, phenomena such as penetration amount, uniformity, voids, and failure mechanisms in joints were studied. Additionally, the relationship between process parameters and these phenomena was investigated. The results showed that the two-factor interaction (2FI) model is suitable (R2 = 0.9061) and the power-pressure interaction being the most effective factor. In contrast, the pressure factors and power-speed interaction were found to be ineffective. Additionally, setting the welding power between 1000–1200 W, the speed at around 30 mm/sec, and the pressure between 0.5–1 MPa leads to high penetration and uniform, high-quality welding. High penetration in strong welds allows the fibers to bear the load, increasing weld strength.
Keywords
Introduction
Polymer matrix composites reinforced with fibers can be categorized based on their matrix as either thermoset or thermoplastic. Although thermoset composites have been widely used in the aviation industry, challenges such as slow manufacturing speed, complex joining processes, and high production costs have prompted various industries, including aerospace and automotive, to shift towards thermoplastic composites in recent years. Thermoplastic composites offer advantages such as meltability, reprocessability, and recyclability. They enable the manufacture of complex parts through various methods such as automated fiber placement (AFP), automated tape placement (ATP), and continuous compression molding (CCM).1–3 Additionally, rapid joining methods based on fusion welding, such as induction welding, resistance welding, and ultrasonic welding, are available for thermoplastics.4–6 Ultrasonic welding is one of the newer methods for joining thermoplastic composites, with High-speed joining being a key advantage over other welding techniques.
7
In this method, ultrasonic waves with a frequency of 20 kHz are generated and transmitted into the composite materials and their interface. Initially, friction between the adherends and the resulting heat causes the polymer in the composite to rise to its glass transition temperature. Next, due to the predominance of viscoelastic behavior in the composite material and the introduction of vibrations, viscoelastic volume heat is generated. This mechanism becomes the primary source of heat production until the material reaches its melting temperature. Subsequently, by applying appropriate pressure, the thermoplastic composite adherends are welded together in a very short time.8,9 The volume flux of viscoelastic heat produced during one cycle of vibration in a thermoplastic composite is given by equation (1).
10
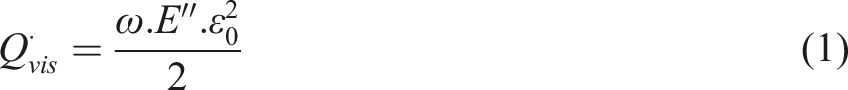
In equation (1),
Limitations such as joining speed and low load-carrying capacity in static ultrasonic welding have led to the adoption of continuous ultrasonic welding in composite structures. Despite the extensive studies on static ultrasonic welding, continuous ultrasonic welding is a relatively new process that has emerged in the last decade and is still under development. Villegas and Rubio 17 demonstrated that welding thermoplastic composite carbon polyether ether ketone (CF/PEEK) to thermoset composite carbon epoxy (CF/Epoxy) using static ultrasonic welding for less than one second, combined with a thermoplastic thin layer co-cured on the composite (CF/Epoxy), prevents thermal degradation of the thermoset resin. Senders et al 18 showed that using a thin, flat energy director with a thickness of 0.08 mm during continuous ultrasonic welding of carbon polyphenylene sulfide (CF/PPS) composites, eliminates the unwanted flow of polymer around the overlapping adherends. Lionetto et al 19 conducted research on static ultrasonic welding of CF/Epoxy to aluminum with a polyamide 6 coupling layer, investigating parameters such as energy, welding force, and the thickness of the coupling layer on the shear strength of the joint. The results showed that adjusting these parameters to create a large interlocking area between carbon fibers and aluminum increases the strength. Additionally, the thermoplastic layer acts as an electrical insulator, preventing aluminum corrosion. Tsiangou et al 20 explored the ability of a polyetherimide (PEI) coupling layer to generate heat without using a separate loose energy director in the static ultrasonic welding of carbon polyetherimide (CF/PEI) and carbon epoxy. Their results indicated that not using a separate loose energy director causes overheating of the coupling layer or CF/PEI, while using a loose energy director increases the shear strength of the weld. Jongbloed et al 21 demonstrated that using a 0.2 mm thick woven PPS mesh energy director in continuous ultrasonic welding of CF/PPS composites increases the uniformity and strength of the weld. In another study, Jongbloed et al 22 investigated the differences and similarities between static and continuous ultrasonic welding. They found that in static welding, unwelded areas gradually decrease and are eventually eliminated as welding time increases, whereas in continuous welding, reducing the welding speed causes unwelded areas to remain nearly constant. Moreover, the optimal welding speed in continuous welding and welding time in static welding are similar. Zhao et al 23 examined the effect of sonotrodes with different diameters in the static ultrasonic welding of GF/PPS composites. The results indicated that using a larger diameter sonotrode leads to a higher heating rate and shorter welding time. They also introduced simultaneous spot welding, which increased productivity and reduced welding time. Jongbloed et al 24 studied the heat produced along the thickness of the CF/PPS composite during continuous ultrasonic welding, revealing that more heat is generated compared to static welding. Furthermore, unlike in static welding, the heat distribution between the upper and lower adherends is not uniform in continuous welding. Brito et al 25 investigated the effect of misalignment in the thermoplastic composite adherends during static ultrasonic welding. They found that increasing the angle from 0.2° to 4.5° decreases power consumption and welding uniformity, while increasing welding time and the possibility of overheating. Additionally, increasing the distance between clamps mitigates the effects of samples misalignment. Jongbloed et al 26 aimed to reduce the voids at the interface between the adherends in continuous ultrasonic welding of CF/PPS adherends by adding a consolidator shoe during welding and exploring parameters such as shoe dimensions, shoe pressure, and the distance between the shoe and the sonotrode. This led to a significant reduction in the number of voids and, an increase in weld strength. Jongbloed et al 27 also investigated the use of a rounded sonotrode in continuous ultrasonic welding of CF/PPS plates, finding that this method decreases temperature at the adherend interface, reduces welding speed and voids, and increases welding force. Gorick et al 28 successfully predicted the shear strength in continuous ultrasonic welding of carbon fiber reinforced with Low Melt Poly Aryl Ether Ketone (CF/LM-PAEK) plates with approximately 72% accuracy using artificial intelligence and a fully connected neural network (FCNN).
Most research conducted so far on continuous ultrasonic welding of thermoplastic composites has focused on woven fiber-reinforced polymers. Recently, this process has also been applied to thermoplastics reinforced with unidirectional fibers, 29 where Köhler et al. investigated the effects of parameters such as welding speed, vibration amplitude, and energy director thickness, as well as their interactions, in continuous ultrasonic welding of unidirectional composites. In their study, the effect of welding speed on the process was examined while keeping vibration amplitude and energy director thickness constant. To explore the interaction effects between these parameters, they also studied changes in welding speed for both higher and lower values of vibration amplitude and energy director thickness. However, the method used in their study increased the number of experiments and lacked the statistical analysis necessary to obtain reliable quantitative indicators for expressing the interaction between the input parameters.
In the present study, a comprehensive statistical investigation is conducted to gain a deeper understanding of how input parameters and their interactions affect shear strength in continuous ultrasonic welding of unidirectional composites. Achieving a suitable quantitative model that specifies the relationship between input factors and their interactions on the lap shear strength obtained from continuous ultrasonic welding is essential for enabling in-situ monitoring of the process. This study focuses on continuous ultrasonic welding of unidirectional continuous glass fiber-reinforced polyamide 6 (GF/PA6). In the first part of the study, a suitable mathematical model is developed using response surface methodology (RSM) and central composite design (CCD) to predict shear strength and assess the effects of welding power, speed, pressure, and their interactions. In the second part, microscopic images of the fracture surface and overlap cross-section of continuous ultrasonic welds are used to analyze phenomena such as penetration, uniformity, joint failure mechanisms, and the relationship between welding parameters and the observed microscopic phenomena.
Experimental procedures
Materials
The thermoplastic composite laminates used in this research are made of polyamide 6 reinforced with continuous unidirectional glass fibers, with a fiber content of 60% by weight. The composite sheets were fabricated using pre-impregnated unidirectional tapes (Prepreg GF/PA6), specifically Toray Cetex® TC910 Nylon 6 fiberglass unidirectional tape, supplied by Toray Advanced Composites. The laminates were first stacked according to a
Continuous ultrasonic welding
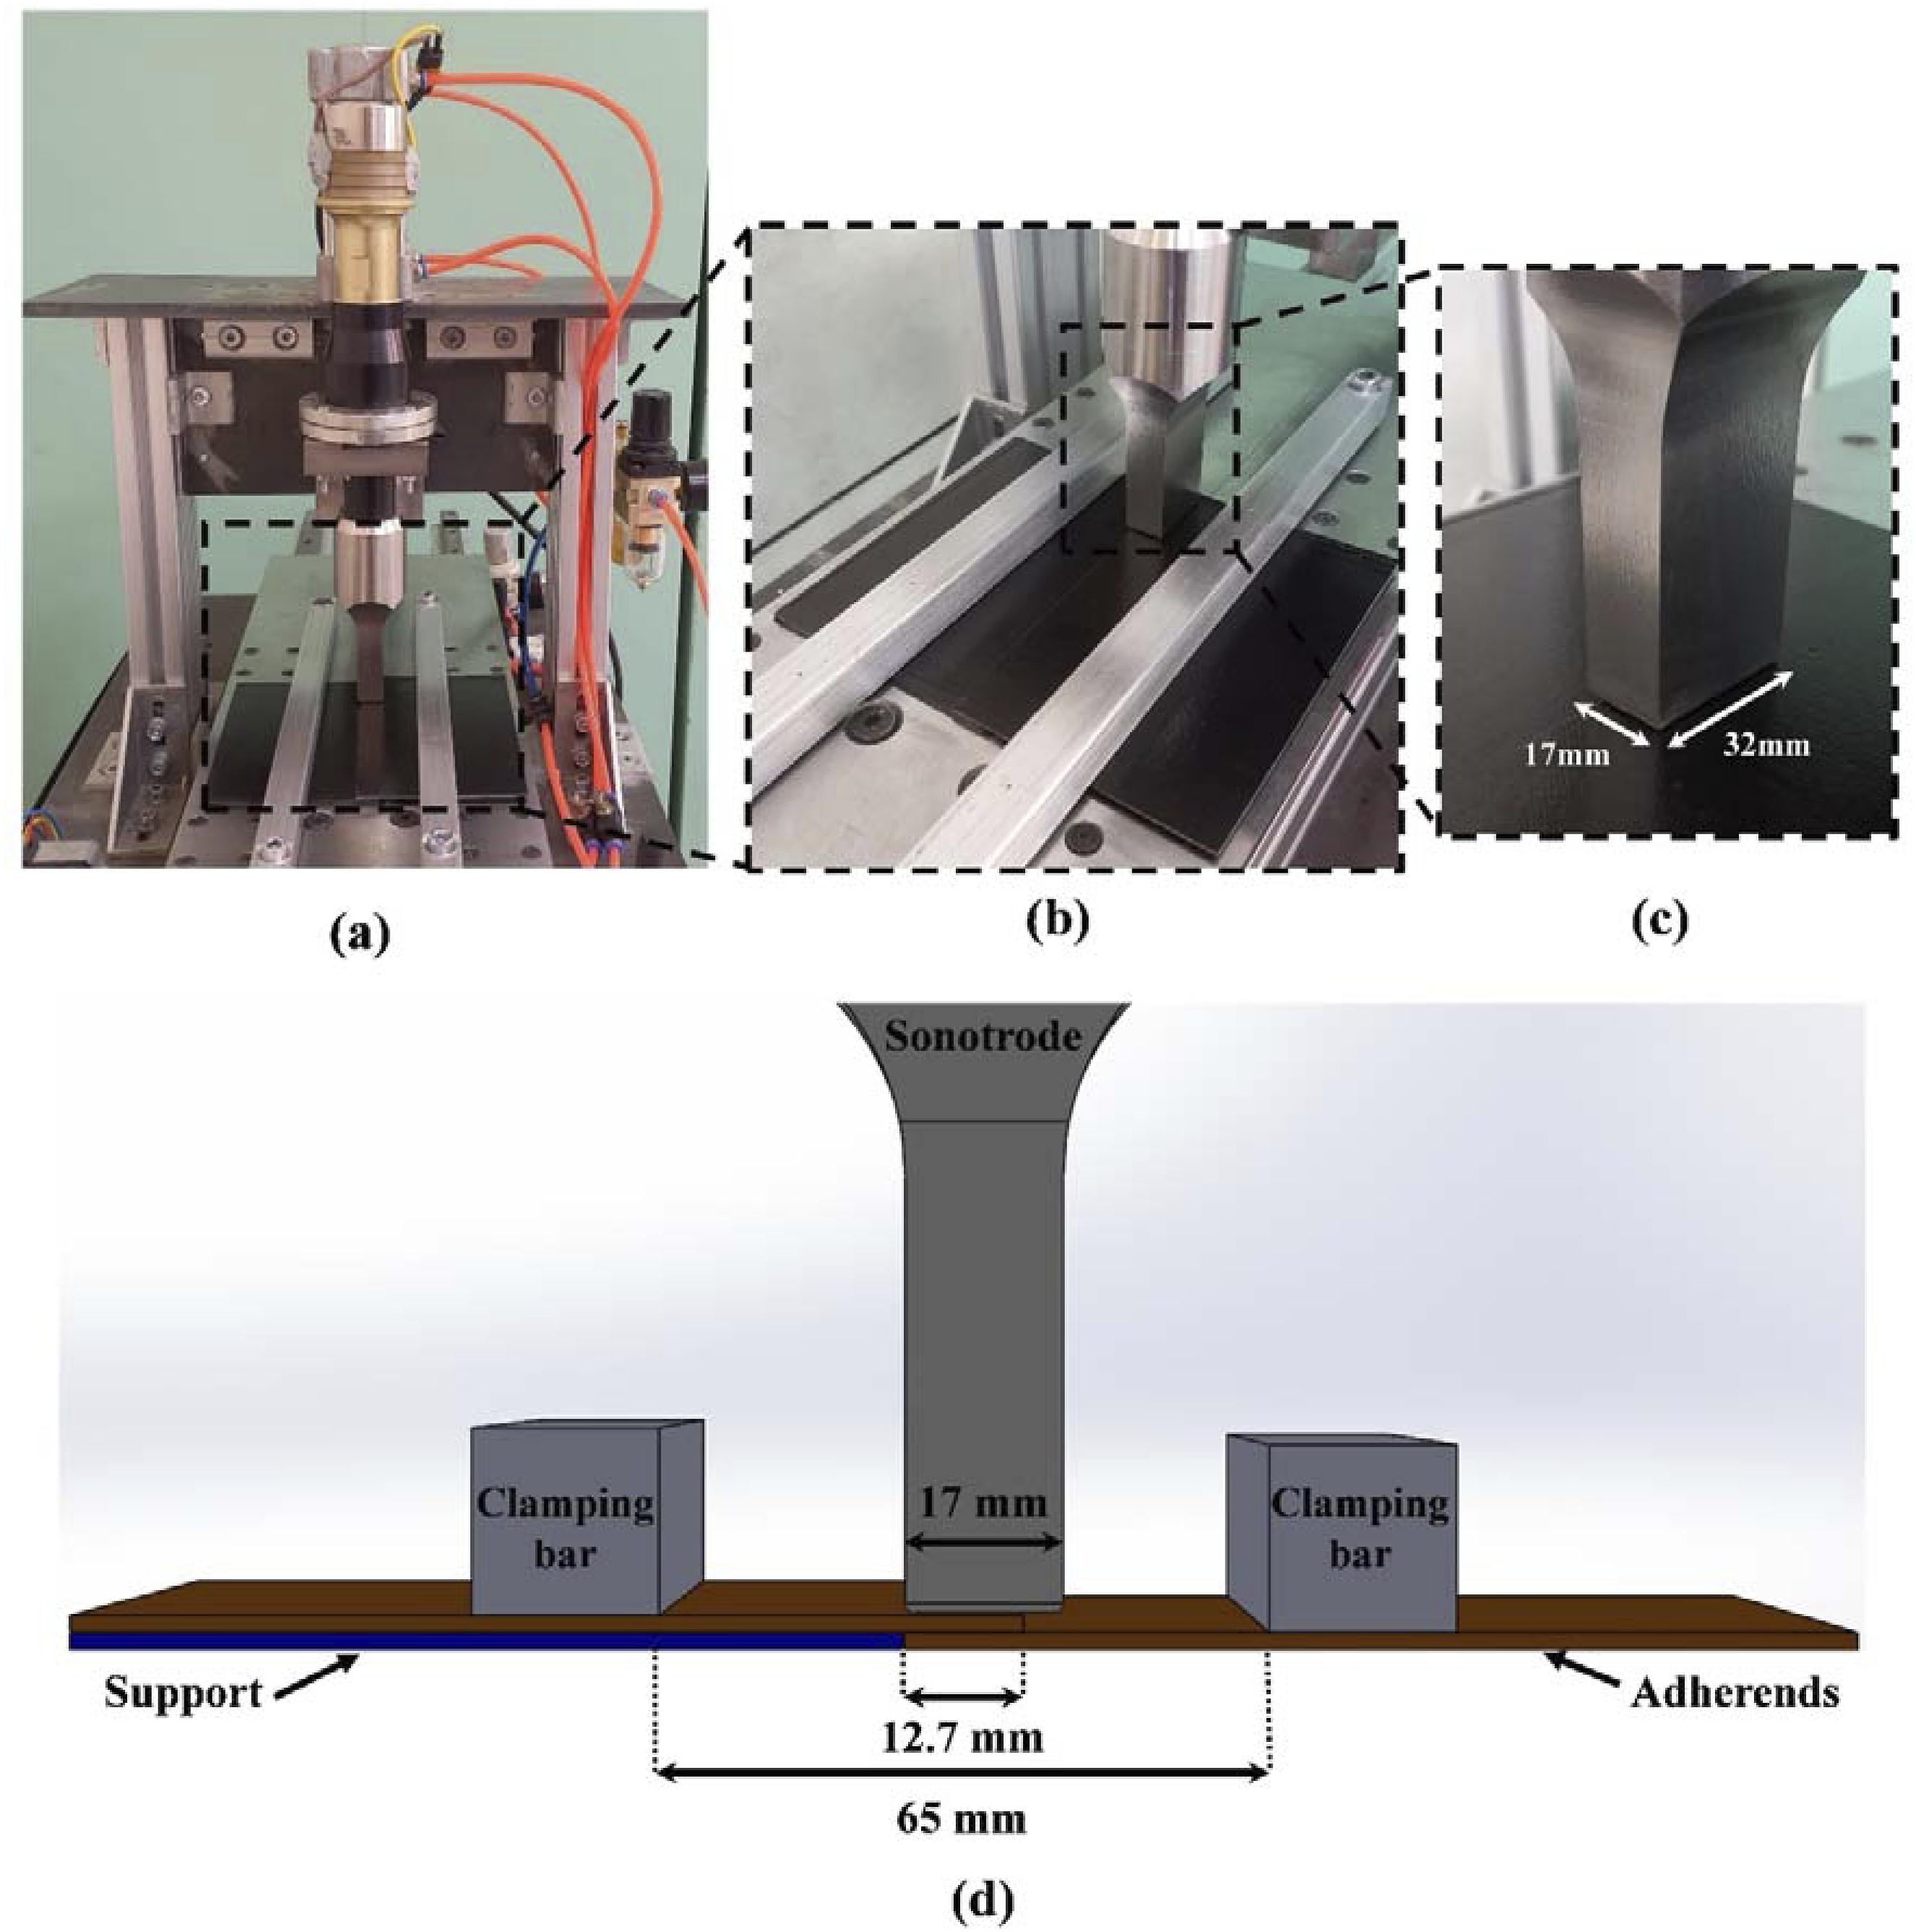
To perform continuous ultrasonic welding of GF/PA6 adherends, First, a continuous ultrasonic welding machine was constructed, as shown in Figure 1. In Figure 1(a), the components labeled 1, 2, and 3 represent the laptop, ultrasonic generator, and air compressor, respectively. Figure 1(b) shows additional components of the device, with labels 4, 5, and 6 indication the ultrasonic head, pneumatic jack, and stepper motor, respectively. The ultrasonic head consist of as a transducer, booster, and horn (sonotrode). The ultrasonic generator used in the setup has a nominal power of 1500 W operates at a frequency of 20 kHz. To perform continuous welding, the machine table can move at any desired speed. The titanium sonotrode has a cross-sectional area of 17 mm × 32 mm. A 1 mm radius fillet is presented on each side, resulting in an effective cross-sectional area of 15 mm × 30 mm. The 30 mm side of the rectangular sonotrode is aligned with the welding line. Figure 2(a) shows the placement of the composite adherends in the fixture. Figure 2(b) depicts the ready-to-weld composite adherends with an overlap of 12.7 mm by 150 mm, and Figure 2(c) provided a view of the sonotrode dimensions. According to Figure 2(d), which provides a more detailed schematic of the sonotrode placement relative to the overlap of the composite plates, the distance between the two clamping bars is 65 mm. Additionally, a 1.75 mm-thick support was used to prevent deflection of the composite plates during welding. Continuous ultrasonic welding machine (a) general view of the machine: 1: laptop, 2: ultrasonic power supply and data logger, 3: air compressor (b) more details of the machine; 4: ultrasonic head, 5: pneumatic jack, 6: stepper motor. Composite adherends ready for welding (a) overview of the ultrasonic system prepared for welding (b) composite adherends inside the clamping system (c) titanium sonotrode and its dimensions (d) schematic of the sonotrode placement relative to the overlap of composite adherends during welding.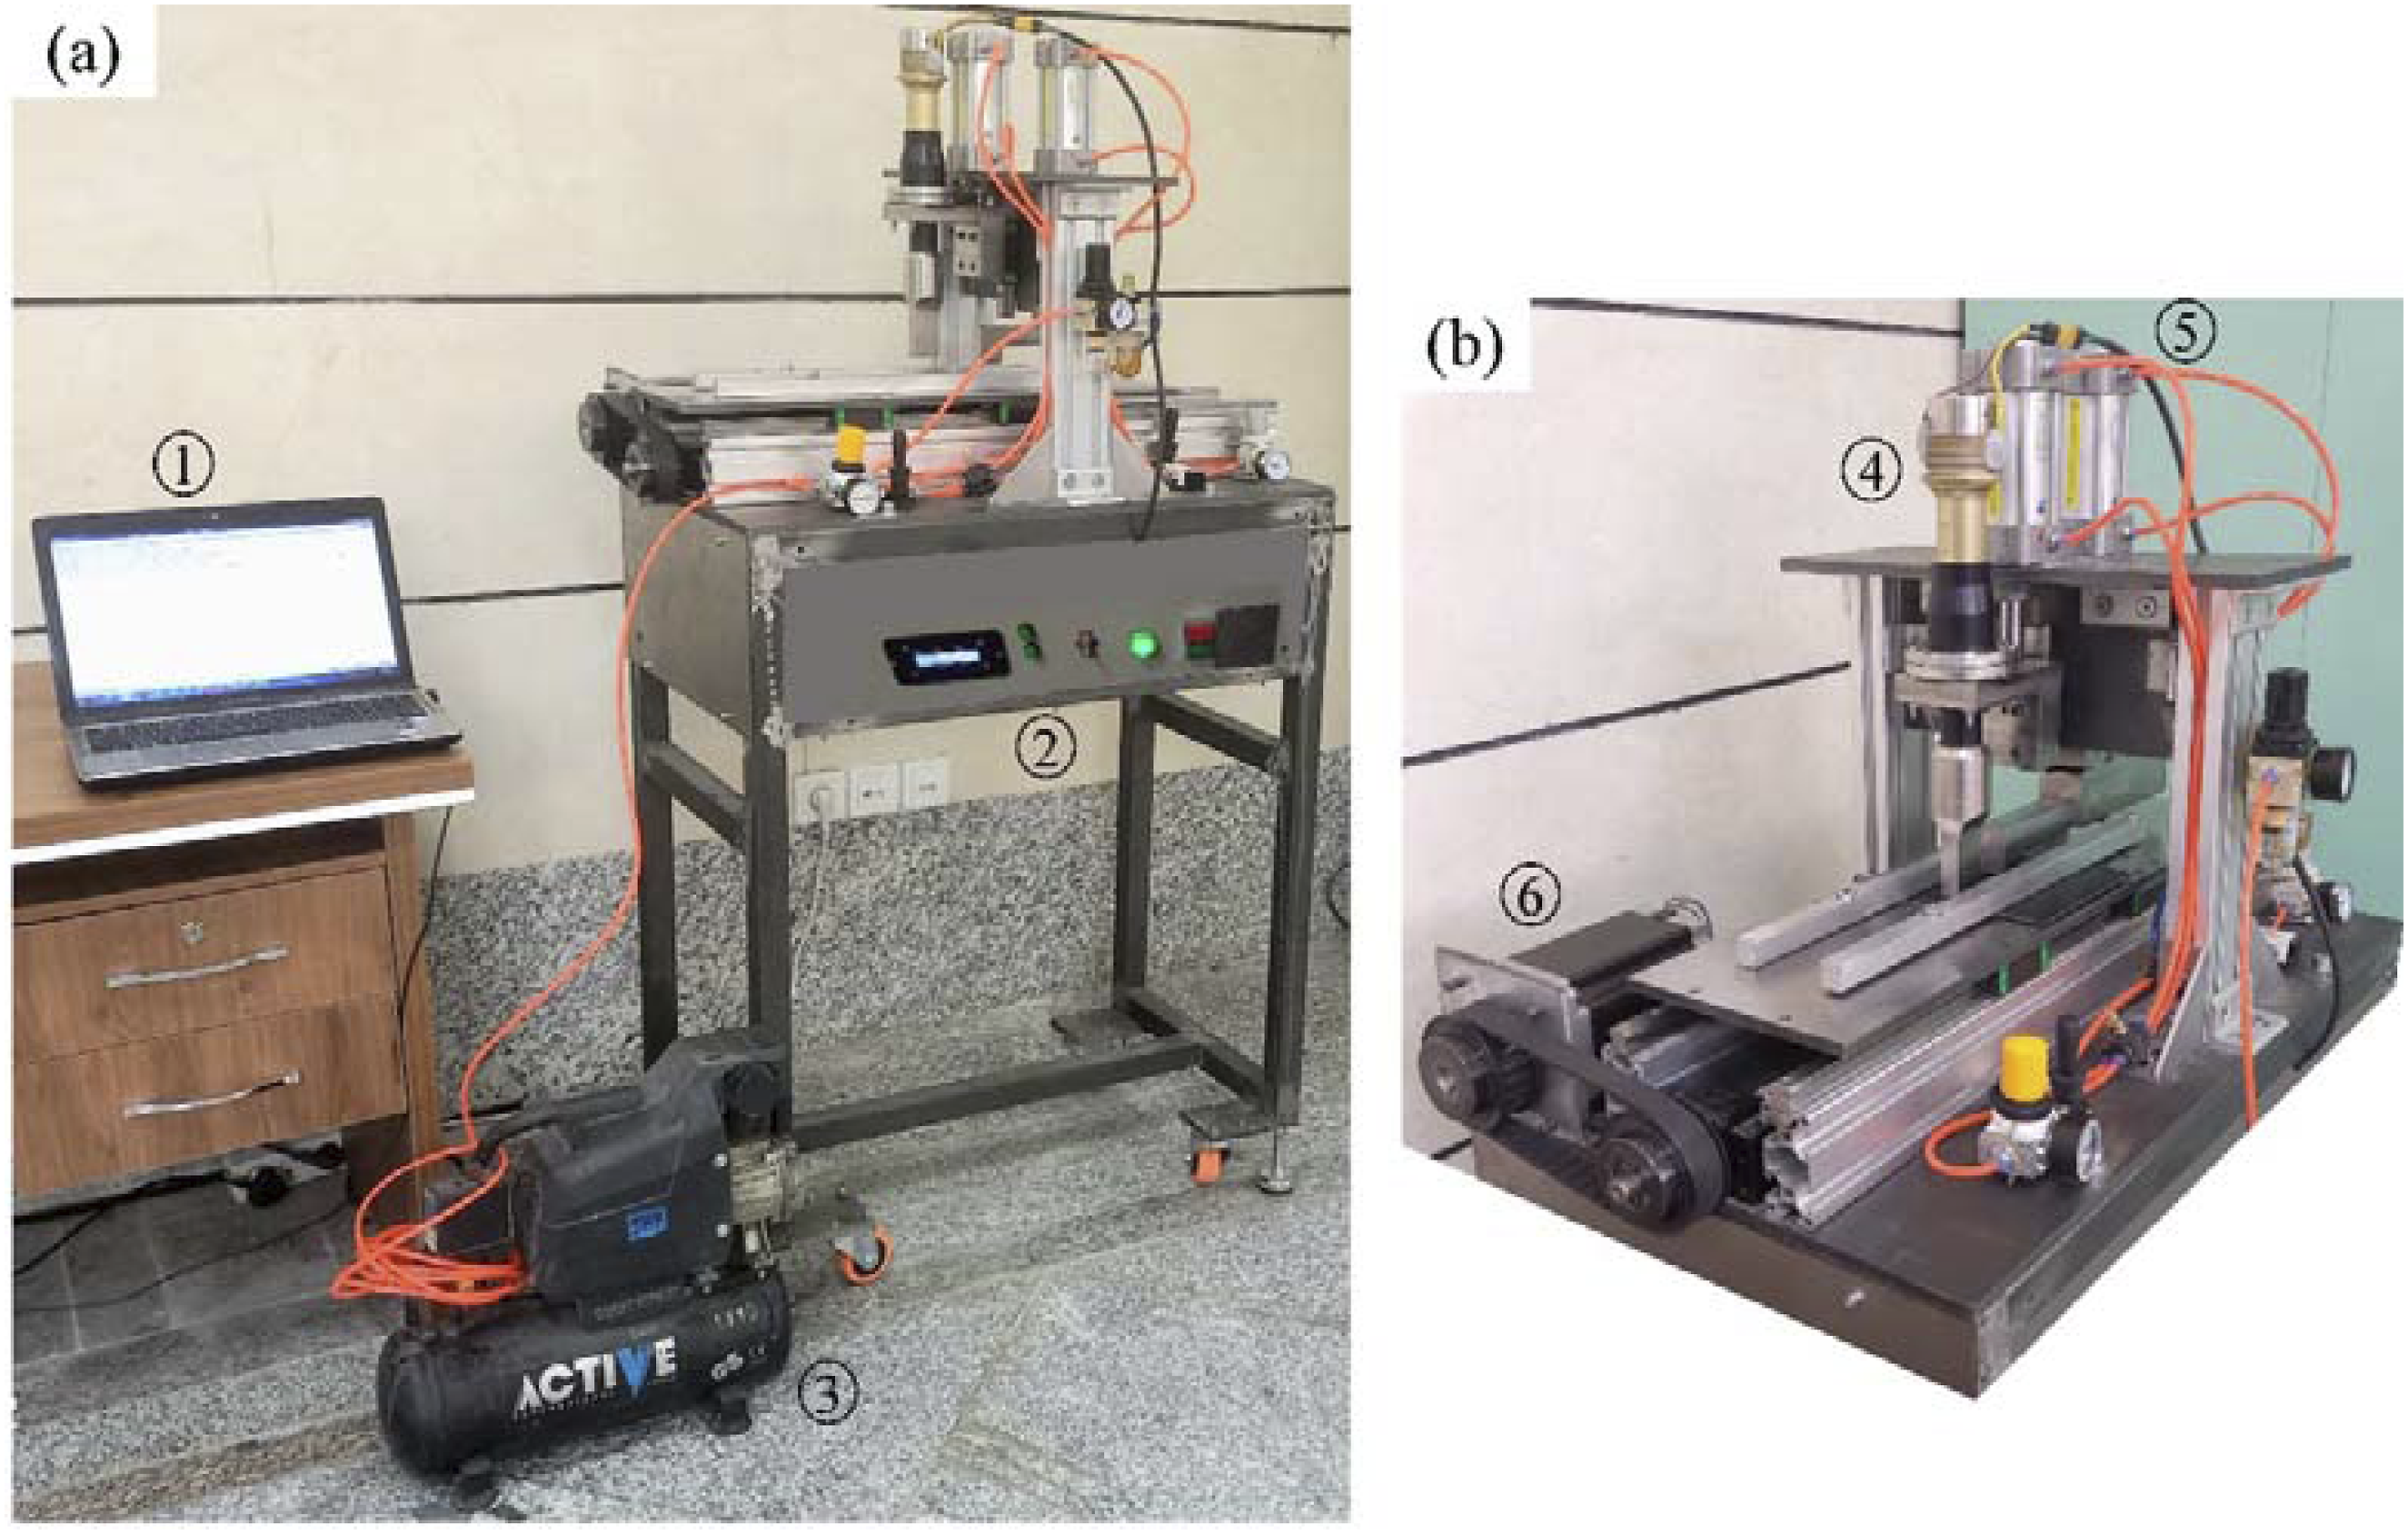
Mechanical testing
To obtain lap shear strength, the welded adherends are cut perpendicular to the welding line. Each welded adherend is cut into six standard samples using a diamond-coated blade and water. The width of the sample at the beginning and end is approximately 30 mm, while the four middle standard samples each have a widths of 20 mm. Due to non-uniformity in the presence of the sonotrode at the beginning and end of the welding line, the 30 mm-wide samples are discarded and excluded from strength calculations and microscopic examination. Of the four standard samples obtained from the continuous ultrasonic welding tests, one was used for the microscopic examination of the overlap cross-section. Next, following to the ASTM D1002 standard, the samples are subjected to a lap shear test with a jaw displacement rate of 1.3 mm/min using the SANTAM 20 kN (STM20) universal testing machine. The lap shear strength is calculated by dividing the fracture shear force, extracted from the force-displacement diagrams, by the overlapping surface area (12.7 × 20 mm). Finally, the continuous welding shear strength for each test is determined by averaging the shear strength values of the three standard samples.
Microscopic analysis
Examining the fracture surfaces and overlapping cross-sections of welded samples is crucial for the qualitative study of continuous ultrasonic welding of composite adherends (GF/PA6). By microscopically analyzing phenomena such as weld penetration, uniformity, changes in fiber direction, void formation, and joint failure mechanisms, the relationship between factors (e.g., power, speed, pressure) and shear strength can be more accurately explained. This approach ultimately leads to a correct qualitative description of continuous ultrasonic welding of the composite (GF/PA6). In this research, microscopic images were captured using an optical microscope with a maximum magnification of 160x and a TESCAN VEGAII scanning electron microscope (SEM) from the Czech Republic. ImageJ software was employed to quantify the voids observed on the fracture surface of continuously ultrasonic-welded joints. To examine the overlapping cross-sections of the welded adherends, areas along the welding line were first identified. Samples were then cut perpendicular to the welding line at the designated location, and the overlapping cross-section was polished using 2000-grit sandpaper to remove cutting artifacts. Before conducting SEM analysis of the fracture surfaces and overlapping cross-sections, these surfaces were coated with gold using an EMITEC K450X device, after which SEM images were obtained.
Experimental design
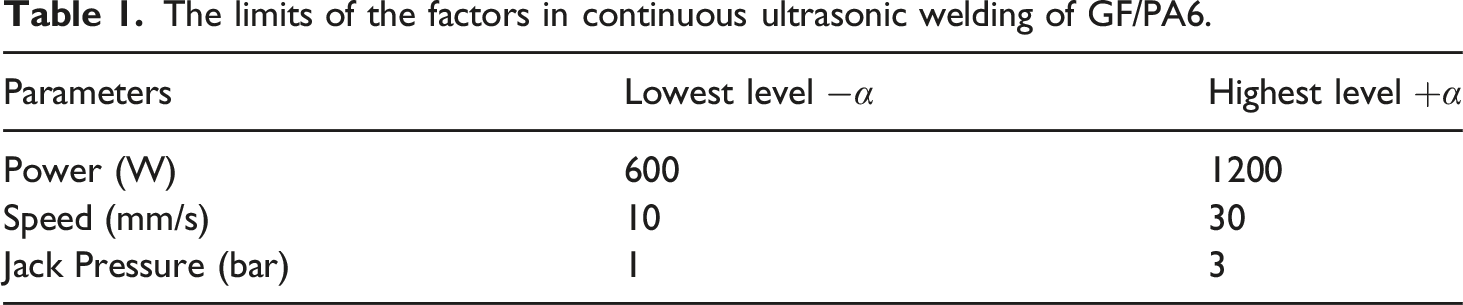
The limits of the factors in continuous ultrasonic welding of GF/PA6.
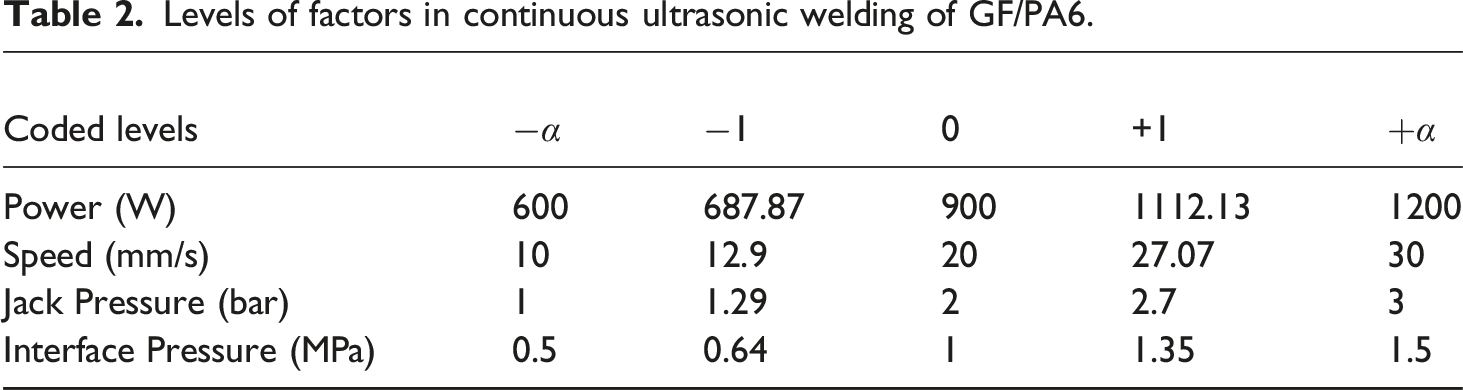
Levels of factors in continuous ultrasonic welding of GF/PA6.
Experimental design and results of the lap shear strength (LSS) tests.
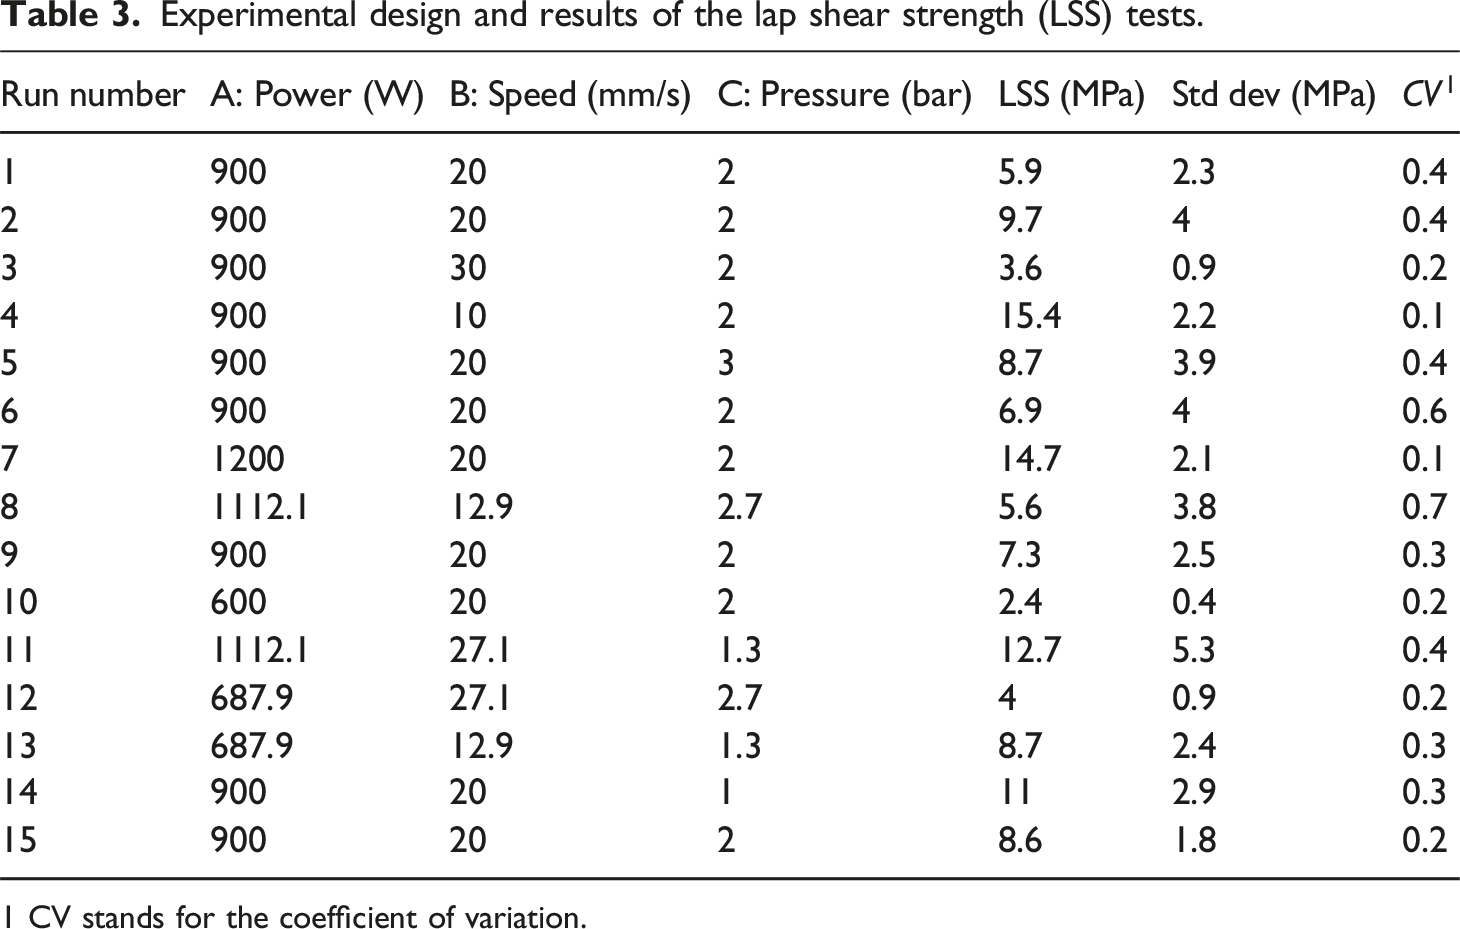
1 CV stands for the coefficient of variation.
Appropriate model
To establish a correct relationship between the input factors and the process response (weld shear strength), a two-factor interaction (2FI) model was used. The general form of this model is expressed in equation (2).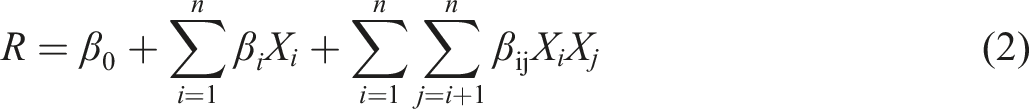
In equation (2), R represents the process response,
Result and discussion
Quantitative study
In this section, the best model for fitting the shear strength data is selected, and the accuracy of the model’s data is verified using Design Expert 7.0.0 software. This process yields the mathematical equation governing the system. Next, analysis of variance (ANOVA) is used to evaluate the magnitude and nature of the effects of different factors and their interactions on the process response.
Model adequacy
To assess the adequacy of the model, the normality of the data, the constancy of variances, and the independence of the data over time were evaluated for the 2FI model.
31
Figure 3 presents statistical charts that demonstrate the model’s adequacy. Specifically, Figure 3(a) shows the normal probability plot for internally Studentized residuals. As depicted, the residuals are randomly distributed around the reference line and are close to it, indicating that the data follows a normal distribution. Figure 3(b) displays the plot of internally Studentized residuals versus predicted values. The residuals are nearly zero and exhibit a random distribution. Additionally, they fall within the permissible range of −3 to +3, validating the assumption of constant variance, which supports the model’s adequacy. Figure 3(c) illustrates the plot of internally Studentized residuals versus welding test numbers. The residuals are randomly distributed and fall within the allowed range of −3 to +3, confirming the assumption of data independence with respect to time. Finally, Figure 3(d) presents the plot of predicted values versus actual shear strength values from the tests. The closeness of the data points to the reference line indicates that the model accurately predicts lap shear strength in continuous ultrasonic welding of the composite (GF/PA6). Statistical plots to check the adequacy of the 2FI model (a) normal probability plot, (b) internally studentized residuals versus predicted values, (c) internally studentized residuals versus test number, and (d) predicted values versus actual values.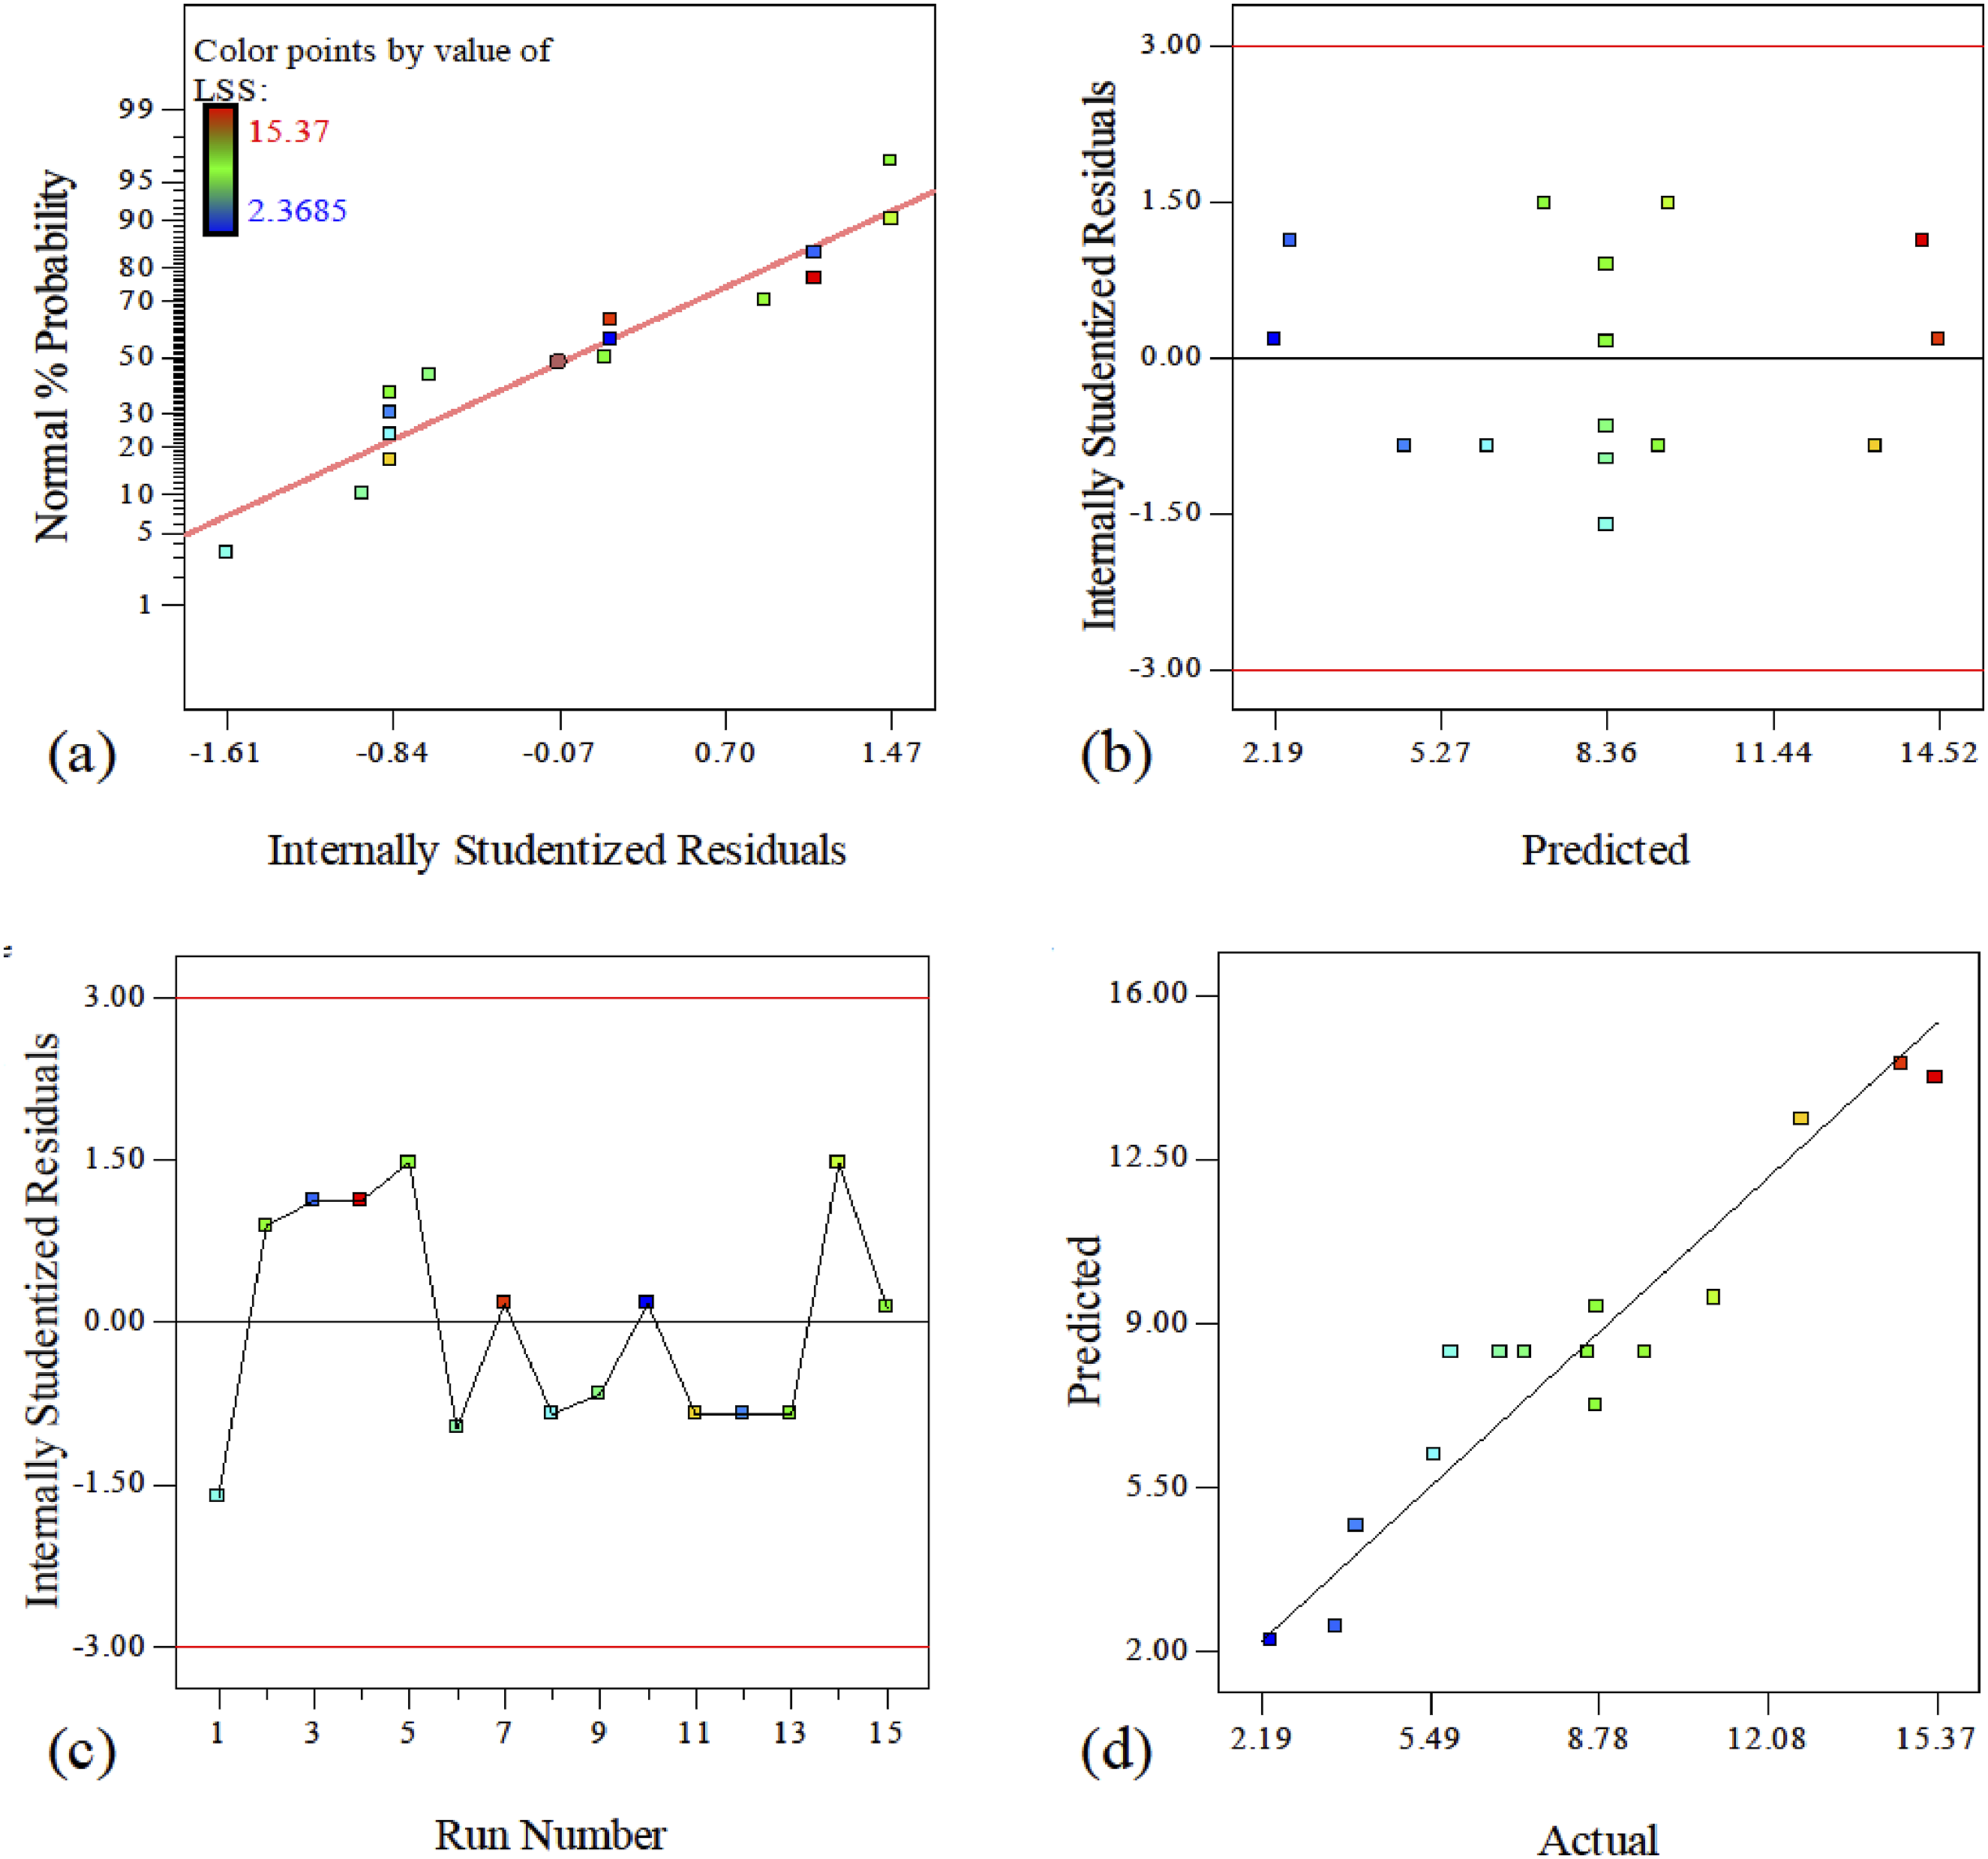
Analysis of variance (ANOVA)
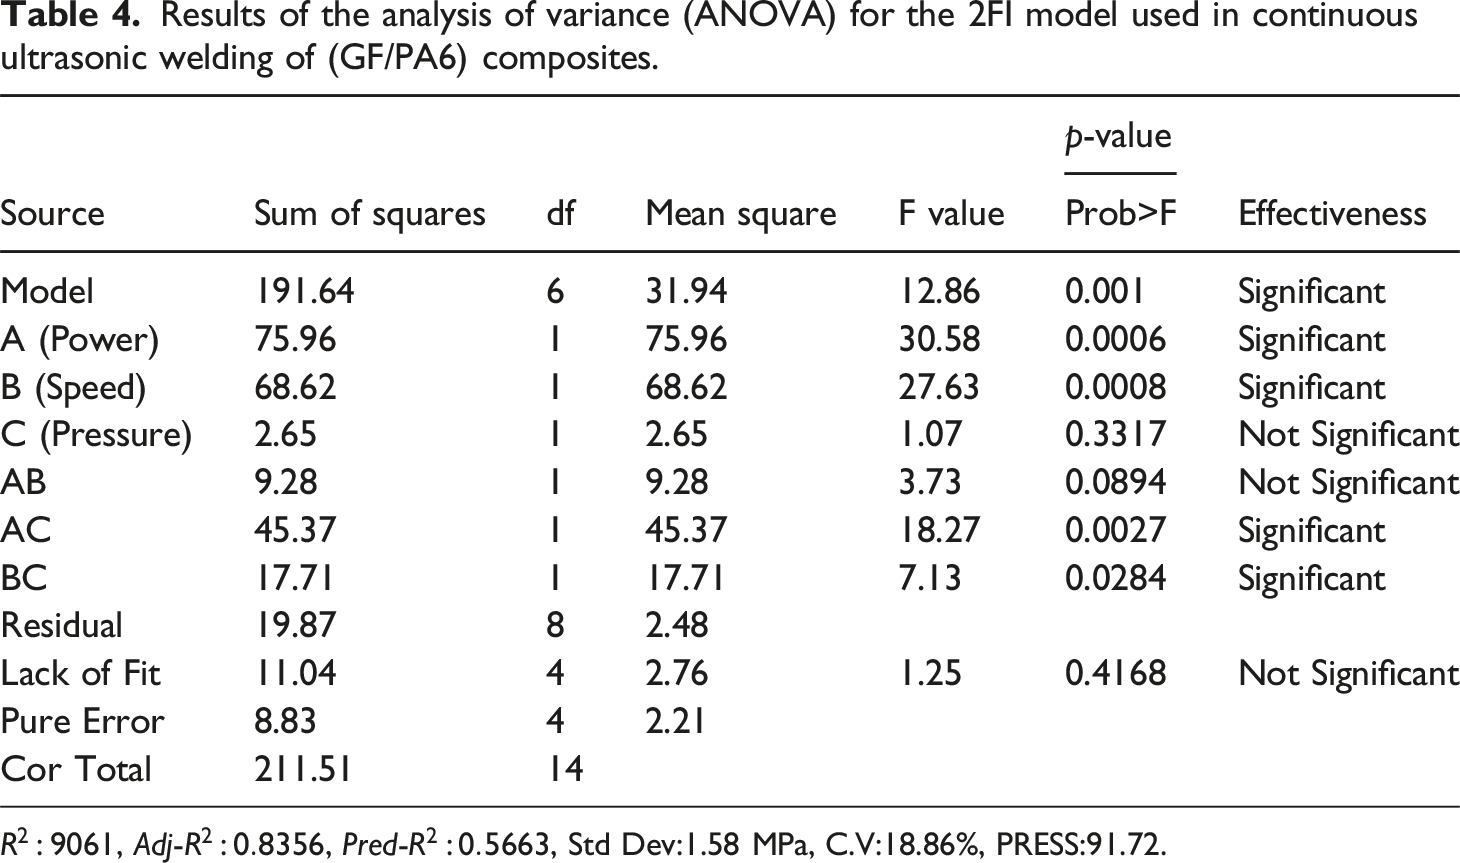
Results of the analysis of variance (ANOVA) for the 2FI model used in continuous ultrasonic welding of (GF/PA6) composites.
Equations (3) and (4) present the equations governing the lap shear strength of the continuous weld in coded and natural forms, respectively.
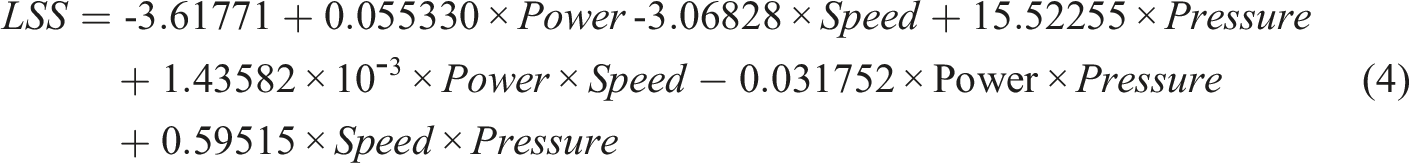
In equation (3), LSS (MPa) represents the lap shear strength, while the coded factors A, B, and C correspond to power, speed, and pneumatic jack pressure, respectively. All these factors are dimensionless. The purpose of expressing this relationship is to determine the relative influence of each factors. According to the coefficients of equation (3), the power-pressure (AC) interaction has the largest coefficient (regardless of sign), indicating it has the greatest impact on the process response (LSS). This is followed by the power, speed, and the speed-pressure interaction, which also significantly affect shear strength. Equation (4) presents the final equation in terms of actual factors for estimating the lap shear strength of GF/PA6 adherends in continuous ultrasonic welding. In this equation, LSS (MPa) represents the lap shear strength, Power (W) refers to the welding power, Speed (mm/s) refers to the welding speed, and Pressure (bar) refers to the pneumatic jack pressure.
Factors effects
Maine effects
Based on the governing equation of the model, the effect of each factor on the process response was investigated using two-dimensional and three-dimensional plots. Figure 4 shows the influence of the main factors on shear strength. Figure 4(a) specifically illustrates the effect of welding power. When the speed and pressure are set to their center points (20 mm/s and 2 bar, respectively), increasing the power from the low level (687 W) to the high level (1112 W) causes the shear strength to rise from about 4 MPa to 13 MPa. This increase in power, which amplifies the amplitude of the sonotrode vibrations, raises the fluctuating strain applied to the composite adherends. According to equation (1), this increase leads to greater viscoelastic heat production and a higher amount of molten polymer. As a result, the conditions for better integration of the composite adherends improve, enhancing the shear strength of the weld. Figure 4(b) shows the effect of welding speed on shear strength. When the power and pressure are set to their center points (900 W and 2 bar, respectively), reducing the speed from the upper level (27 mm/s) to the lower level (12.9 mm/s) increases the weld shear strength from about 4 MPa to 13 MPa. By reducing the welding speed, the sonotrode remains in contact with different areas along the welding line for a longer time, resulting in more oscillation cycles being applied to the composite adherends. As the number of oscillation cycles increases, so does viscoelastic heat production, leading to sufficient melting of the composite polymer matrix and an increase in strength. Plots showing the effect of the main factors on weld shear strength (a) strength versus power (b) strength versus welding speed (c) strength vs pressure.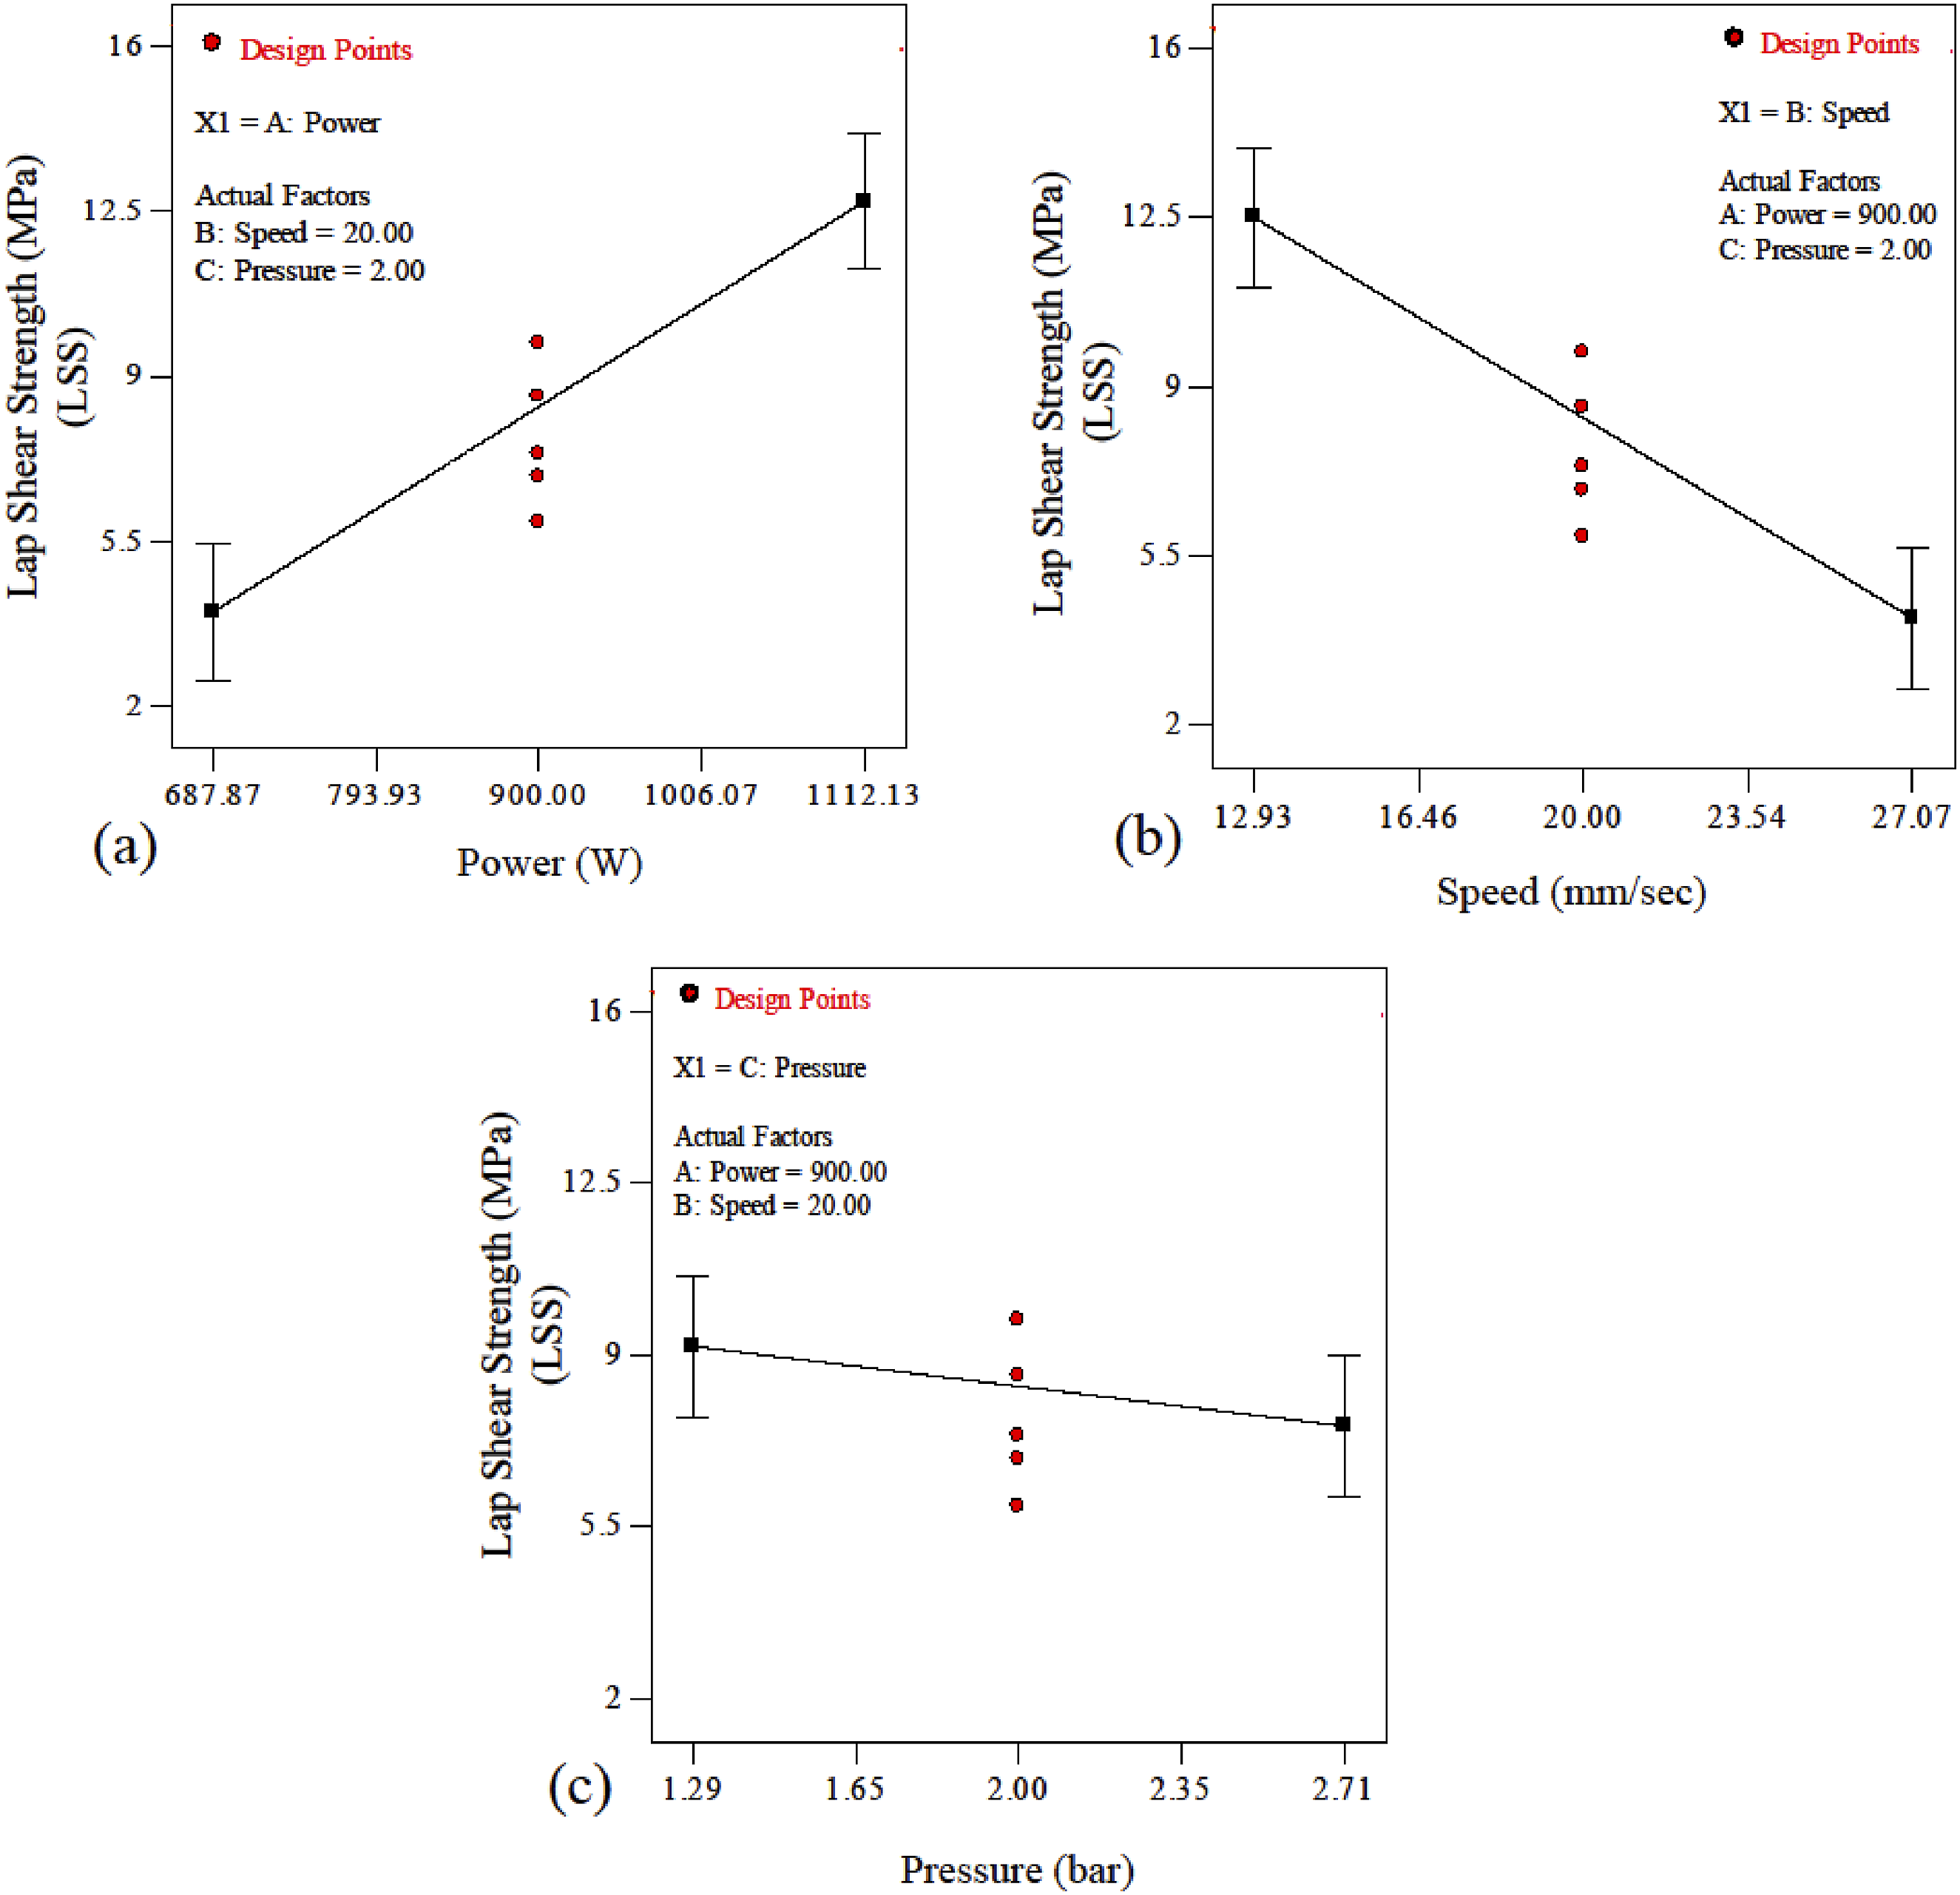
Figure 4(c) shows the effect of welding pressure on weld shear strength. When the power and speed are set to their center points (900 W and 20 mm/s, respectively), increasing the welding pressure from the low level (1.29 bar) to the high level (2.7 bar) causes a decrease in shear strength from 9 MPa to 7.5 MPa. In fact, changes in welding pressure did not significantly affect the shear strength. As noted in the ANOVA analysis, the pressure factor was found to be ineffective. During preliminary welding tests of GF/PA6 adherends, it was observed that pressures higher than 3 bar on the pneumatic jack (corresponding to 1.5 MPa at the interface) did not produce effective welds, even at high power levels and low welding speeds. This suggests that increased welding pressure weakens the sonotrode vibrations, leading to insufficient transmission of vibrations into the composite materials and the interface of the adherends. Consequently, there is a decrease in viscoelastic heat and the amount of melted polymer, ultimately causing a reduction in the shear strength of the weld. It should be noted that sufficient welding pressure is essential for creating continuous ultrasonic welding. This pressure ensures the diffusion of polymer chains between the upper and lower composite adherends, leading to proper bonding.
Interaction effects
Figure 5 shows the three-dimensional and two-dimensional plots related to the effect of two-factor interactions on the lap shear strength of GF/PA6 adherends in continuous ultrasonic welding. Figure 5(a) and (b) illustrate the effect of the power-pressure interaction on shear strength when the speed factor is at its center point (20 mm/s). In Figure 5(a), when the pressure is at its low level (1.29 bar), increasing the welding power from the low level (687 W) to the high level (1112 W) increases shear strength from about 0.5 to 18 MPa. The increase in shear strength due to increased welding power continues up to a jack pressure of 2 bar (1 MPa at the interface). Beyond this point, as the pressure increases to its high level (2.7 bar), shear strength does not change significantly. The increase in welding pressure to 2–3 bar (1–1.5 MPa at the interface) significantly weakens the ultrasonic vibrations of the sonotrode. As a result, reducing the amplitude of the sonotrode vibrations or the welding power results in insufficient vibrations being transferred into the composite material. This reduction in viscoelastic heat production and the amount of molten polymer means that shear strength remains almost unchanged. According to the plots in Figure 5(a) and (b), the highest shear strength is achieved when the welding power is at its high-level (1112 W) and the welding pressure is at its low level (jack pressure 1.29 bar and interface pressure 0.64 MPa), resulting in a shear strength of 18 MPa. Figure 5(c) and (d) show the three-dimensional and two-dimensional plots of the speed-pressure interaction effect on shear strength when the power factor is at its center point of 900 W. In Figure 5(c) and (d), when the pressure factor is set to its low level (jack pressure 1.29 bar, interface pressure 0.64 MPa), reducing the welding speed from its high level to its low level (27.7 to 12.9 mm/s) increases shear strength from 2 MPa to 16 MPa. The increase in shear strength is achieved by reducing speed at a pressure of up to 2 bar. However, when welding pressure is increased beyond 2 bar to a high level of 2.7 bar, further reduction in welding speed does not affect shear strength, which remained almost constant. The highest shear strength is achieved when both speed and pressure are set to their low levels (12.9 mm/s and 1.29 bar), resulting in a shear strength of 16 MPa. 3D and 2D plots of weld shear strength versus two-factor interactions (a) and (b) shear strength versus power-pressure interaction (c) and (d) shear strength versus speed-pressure interaction (e) and (f) shear strength versus power-speed interaction.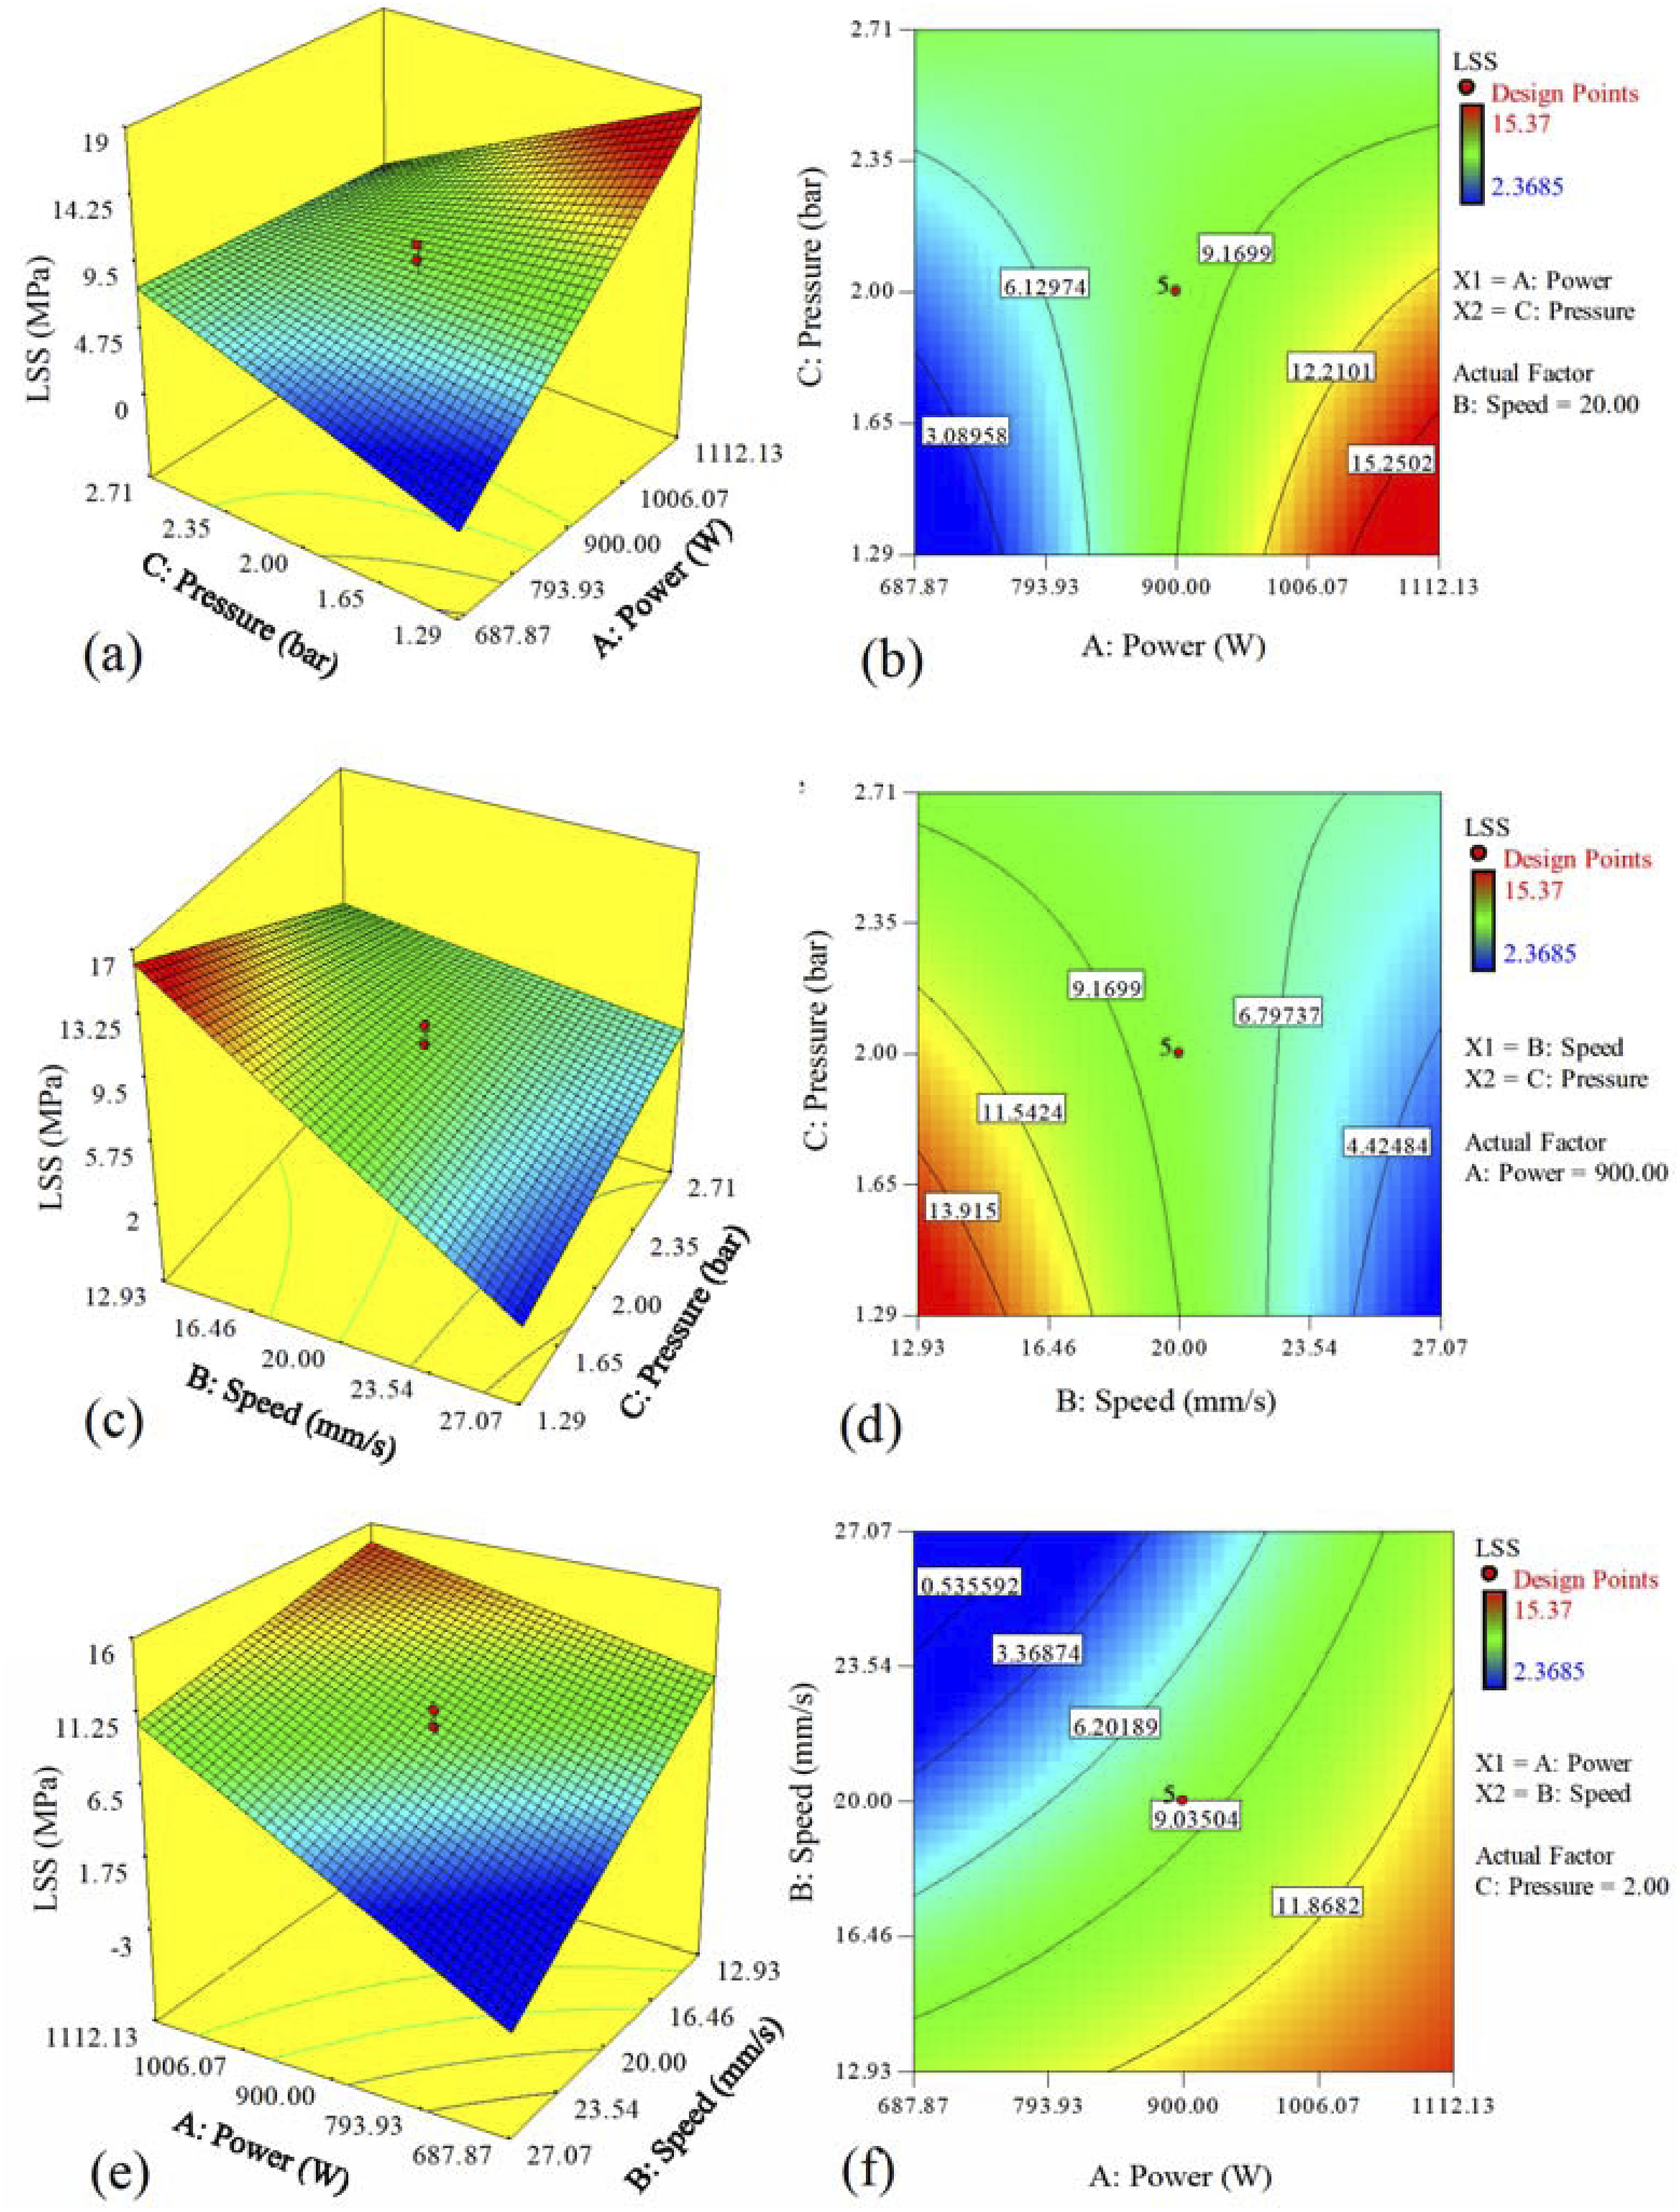
It seems that Jack pressures of 2 to 3 bar (interface pressure of 1 to 1.5 MPa) cause significant weakening of the sonotrode vibrations. As a result, reducing the welding speed increases the duration of the horn’s contact with different areas of the welding line, which in turn increases the number of cycles. However, due to the weakening of the sonotrode vibrations, the vibrations transferred to the composite material reduce the production of viscoelastic heat, and thus the shear strength of the weld does not change significantly with the reduction in welding speed. Figure 5(e) and (f) show the plots of the power-speed interaction effect on shear strength when the pressure factor is at its center point (2 bar). In Figure 5(e) and (f), when the speed is at its high level (27 mm/s), increasing the welding power from its low level (687 W) to the high-level (1112 W) causes shear strength to increase from about 0 to 11 MPa. However, when the welding speed is at its low level (12.9 mm/s), increasing the power from 687 W to 1112 W increases shear strength from about 10 to 14.5 MPa. This increase in strength is less compared to when the speed is at its high level. In fact, it can be said that the necessary condition for fusion welding in thermoplastic composites is for the polymer to reach a viscous flow state at the interface of the adherends. 32 Since the polymer matrix in the GF/PA6 composite is semi-crystalline, 33 the temperature in the welding zone must reach the melting temperature of PA6 for it to achieve proper fluidity. In Figure 5(e), when the speed is at its high level of 27.7 mm/s, the presence of the sonotrode on different areas of the welding line is reduced, and fewer vibration cycles are applied to the composite adherends. This results in insufficient viscoelastic heat to raise the polymer temperature to its melting point. Therefore, under these conditions, increasing the amplitude of ultrasonic vibrations or the welding power, generates sufficient viscoelastic heat to reach the melting temperature of the polymer matrix. This creates melted polymer with suitable fluidity, enhancing the integration of the upper and lower adherends and thus increasing the strength. When welding speed is at its low level (12.9 mm/s), the introduction of more oscillation cycles to different areas of the welding line produces sufficient viscoelastic heat. In this case, increasing the welding power from 687 W to 1112 W has little effect on the amount of melted polymer necessary to create a joint, and the welding strength changes only slightly.
Qualitative study
In this section, continuous ultrasonic welds are first qualitatively classified based on their shear strength. The welding line is then examined using microscopic images of the fracture surfaces and the cross-sectional area of the overlapping adherends. The investigation will focus on phenomena such as polymer squeeze flow from the overlapping area of the adherends, the depth of the melted polymer, changes in fiber direction, the presence of voids, and various joint failure mechanisms in continuous ultrasonic welding of composites (GF/PA6).
Classification of CUW
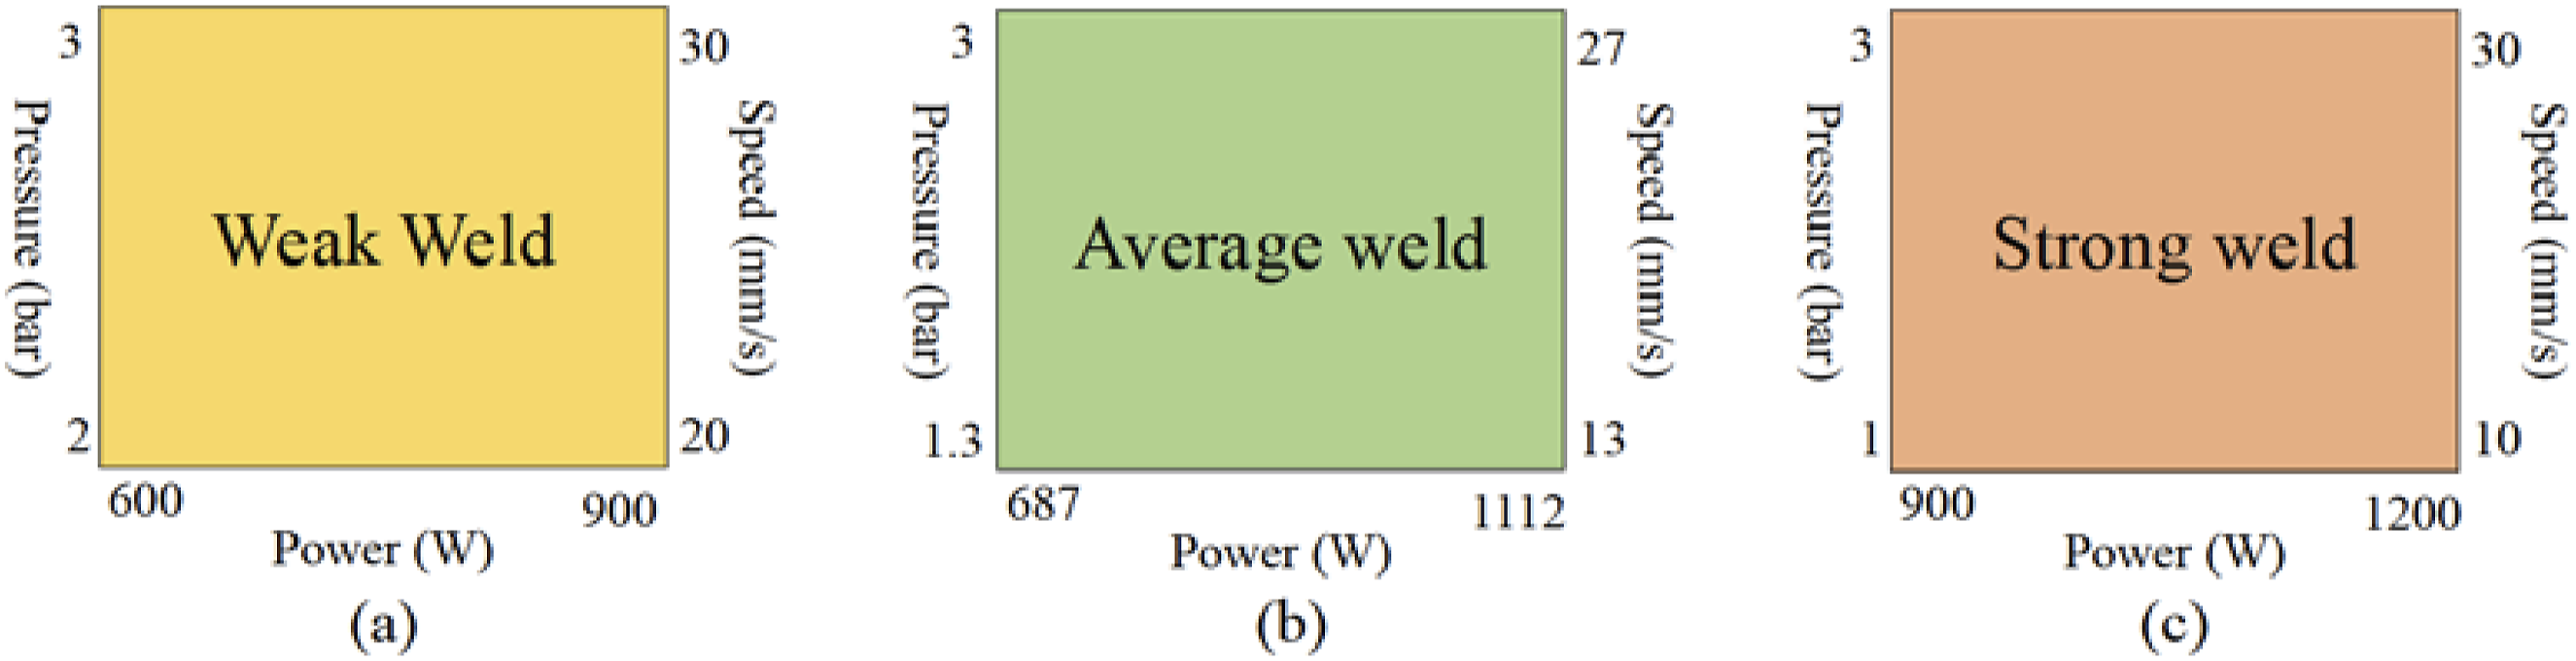
Continuous ultrasonic welds are categorized based on the shear strength measured in this research: less than 5 MPa as weak, 5 to 10 MPa as average, and 10 to 15 MPa as strong. Figure 6 presents a diagram of lap shear strength versus the number of welding tests, illustrating the three categories of welds: weak, average, and strong. Figure 7 shows the ranges of welding parameters corresponding to these three welding modes: weak, average, and strong. In Figure 7(a), setting the power to the lowest limit and its center point (600-900 W), while adjusting the pressure and speed factors from the center point to their highest limits (2–3 bar and 20–30 mm/s, respectively) results in a significant heat drop. This leads to reduced viscoelastic production within and at the interface of the adherends, producing less molten polymer, weaker welds, and lower strength (less than 5 MPa). Figure 7(c) highlights that to create a strong weld, the welding power should be adjusted within the range between the center point and its highest limit (900–1200 W). Additionally, the speed and pressure factors can be adjusted from their lowest to highest limits (10–30 mm/s and 1–3 bar, respectively). This is also evident in Figure 7(b), where the power in average welds is lower than in strong welds. In other words, proper adjustment of power (900–1200 W) is crucial for generating sufficient viscoelastic heat within the GF/PA6 adherends to achieve strong welds. A deeper understanding of the relationship between welding parameters and observed microscopic phenomena is achieved through the microscopic examination of fracture surfaces. Diagram of the average lap shear strength of weak, average, and strong continuous ultrasonic welds versus test number. Error bars indicate the positive and negative standard deviations around the mean (n = 3). Range of parameters corresponding to different categories of continuous ultrasonic welding of GF/PA6 composites (a) weak weld (b) average weld (c) strong weld.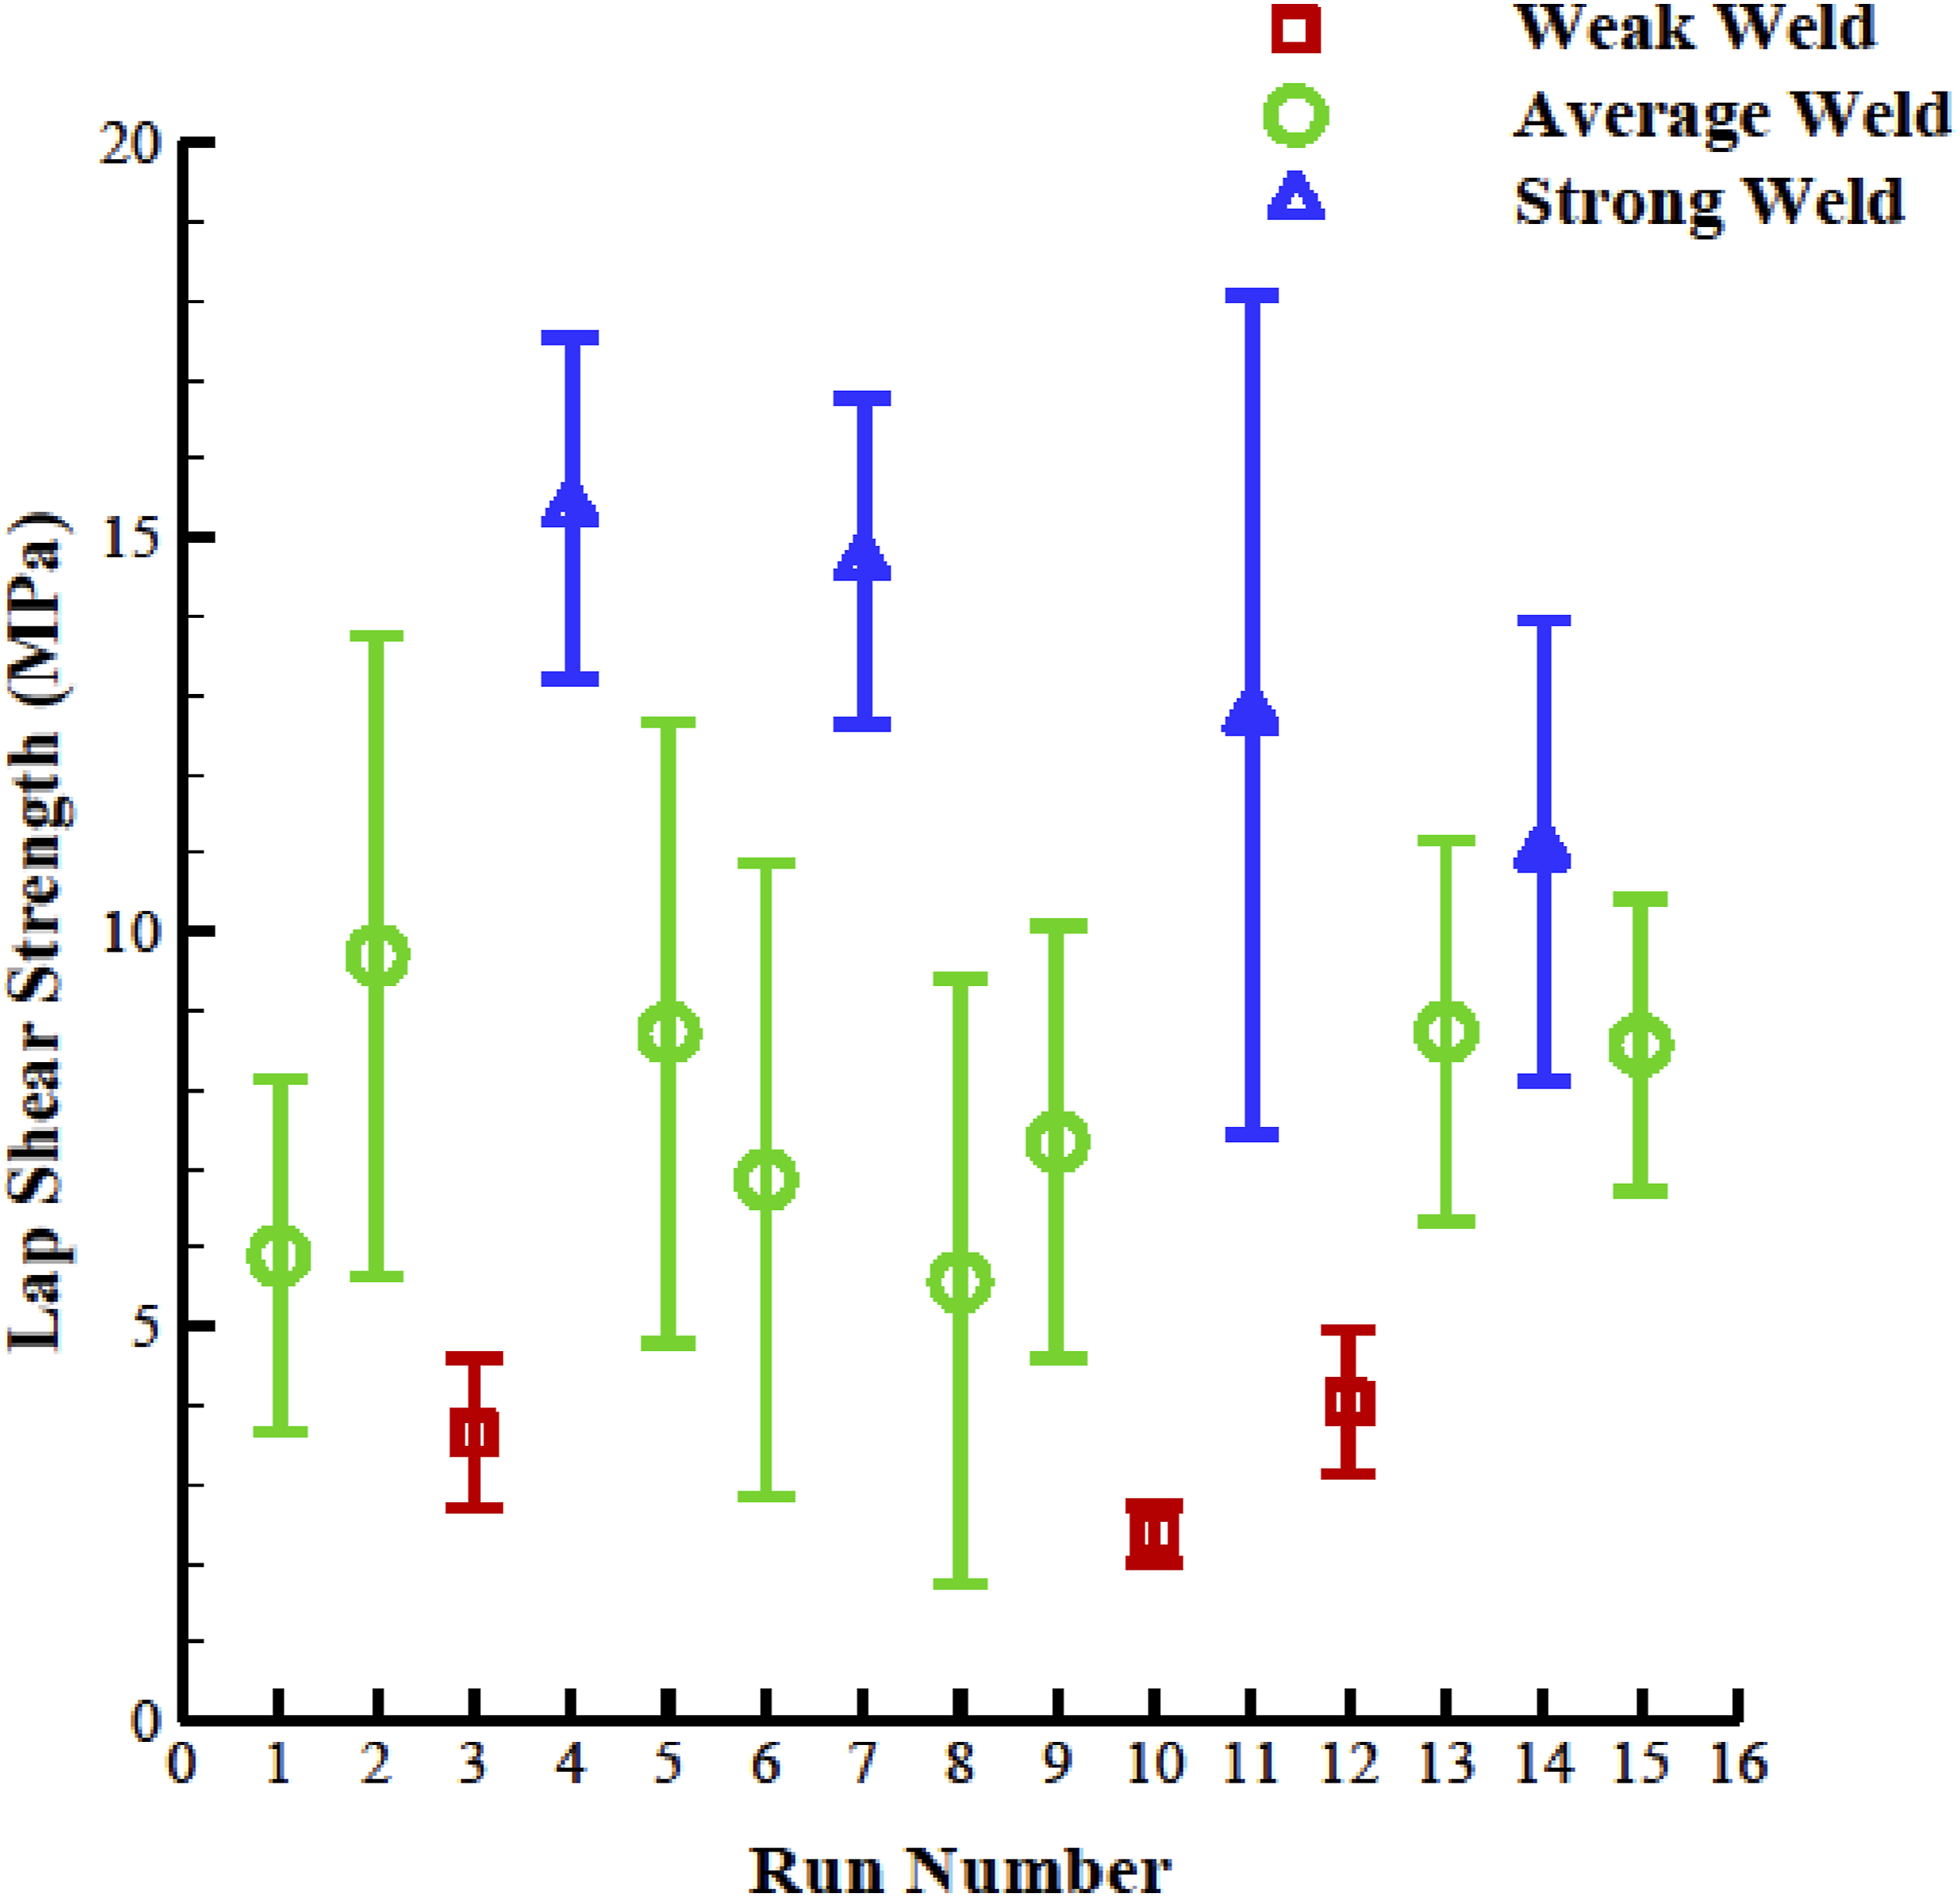
Weak weld
Figure 8 shows images of the fracture surfaces from different areas along the weld line in several continuous welding tests. Figure 8(a) specifically shows the fracture surfaces of a weak weld sample, with a strength of less than 5 MPa (Test No. 10), conducted under welding parameters of 600W power, 20 mm/sec speed, and 1 MPa (2 bar) pressure. As shown in Figure 8(a), the main characteristic of weak continuous welds is the presence of many unwelded areas and island-like welded areas. It appears that the high speed (20–30 mm/s), combined with low viscoelastic heat generation, is the primary reason for the occurrence of unwelded areas in this category of welds. When two composite adherends are in contact, only the peaks of the uneven surfaces initially make contact due to surface roughness. According to Figure 7, the conditions for weak continuous welds involve relatively low power and high pressure, resulting in minimal viscoelastic heat production within the composite adherends. Consequently, the polymer at the interface undergoes surface melting, and the diffusion of polymer chains occurs first between the peaks of the adherends that are in contact, leading to local fusion of the upper and lower adherends. However, if the welding speed is high (20–30 mm/s), there is insufficient time for polymer chains to diffuse among the other uneven peaks, resulting in many unwelded areas. Images of fracture surfaces along the weld line in continuous ultrasonic welding of GF/PA6 composites. The dashed ellipses indicate the squeeze flow phenomenon (a) weak weld (b) average weld (c) strong weld (d) strong weld with no change in the direction of zero-degree fibers at the interface.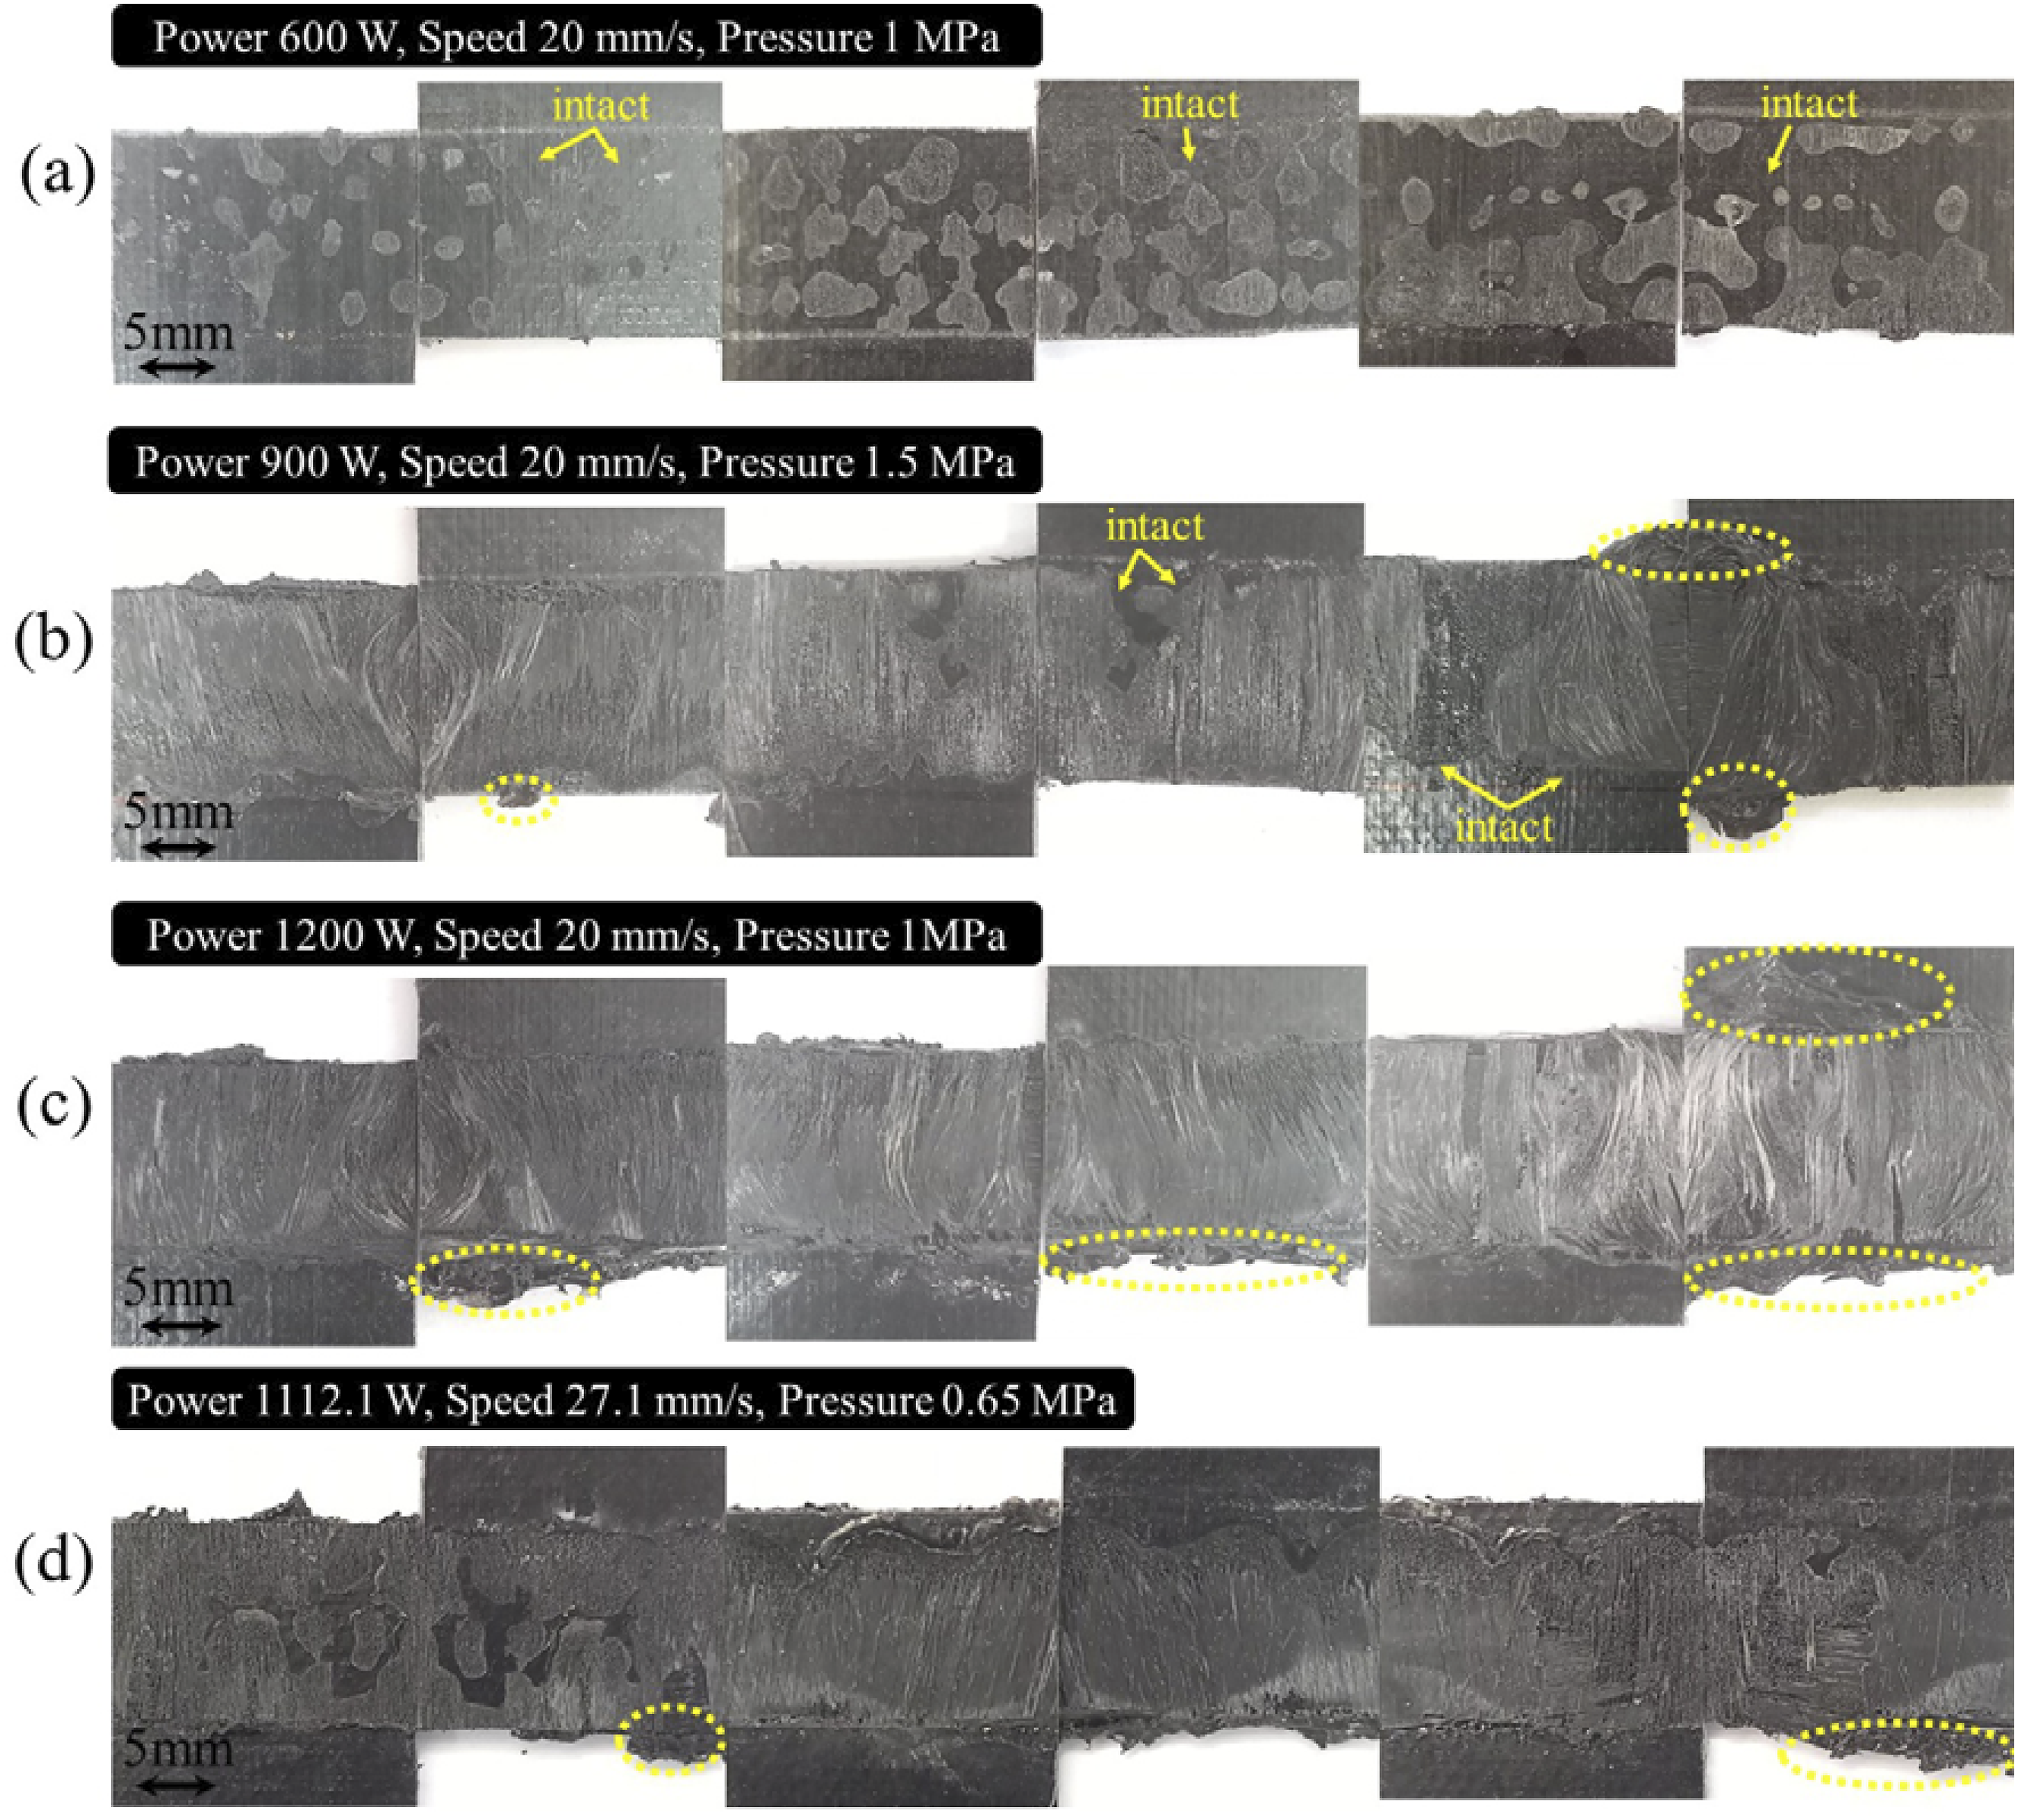
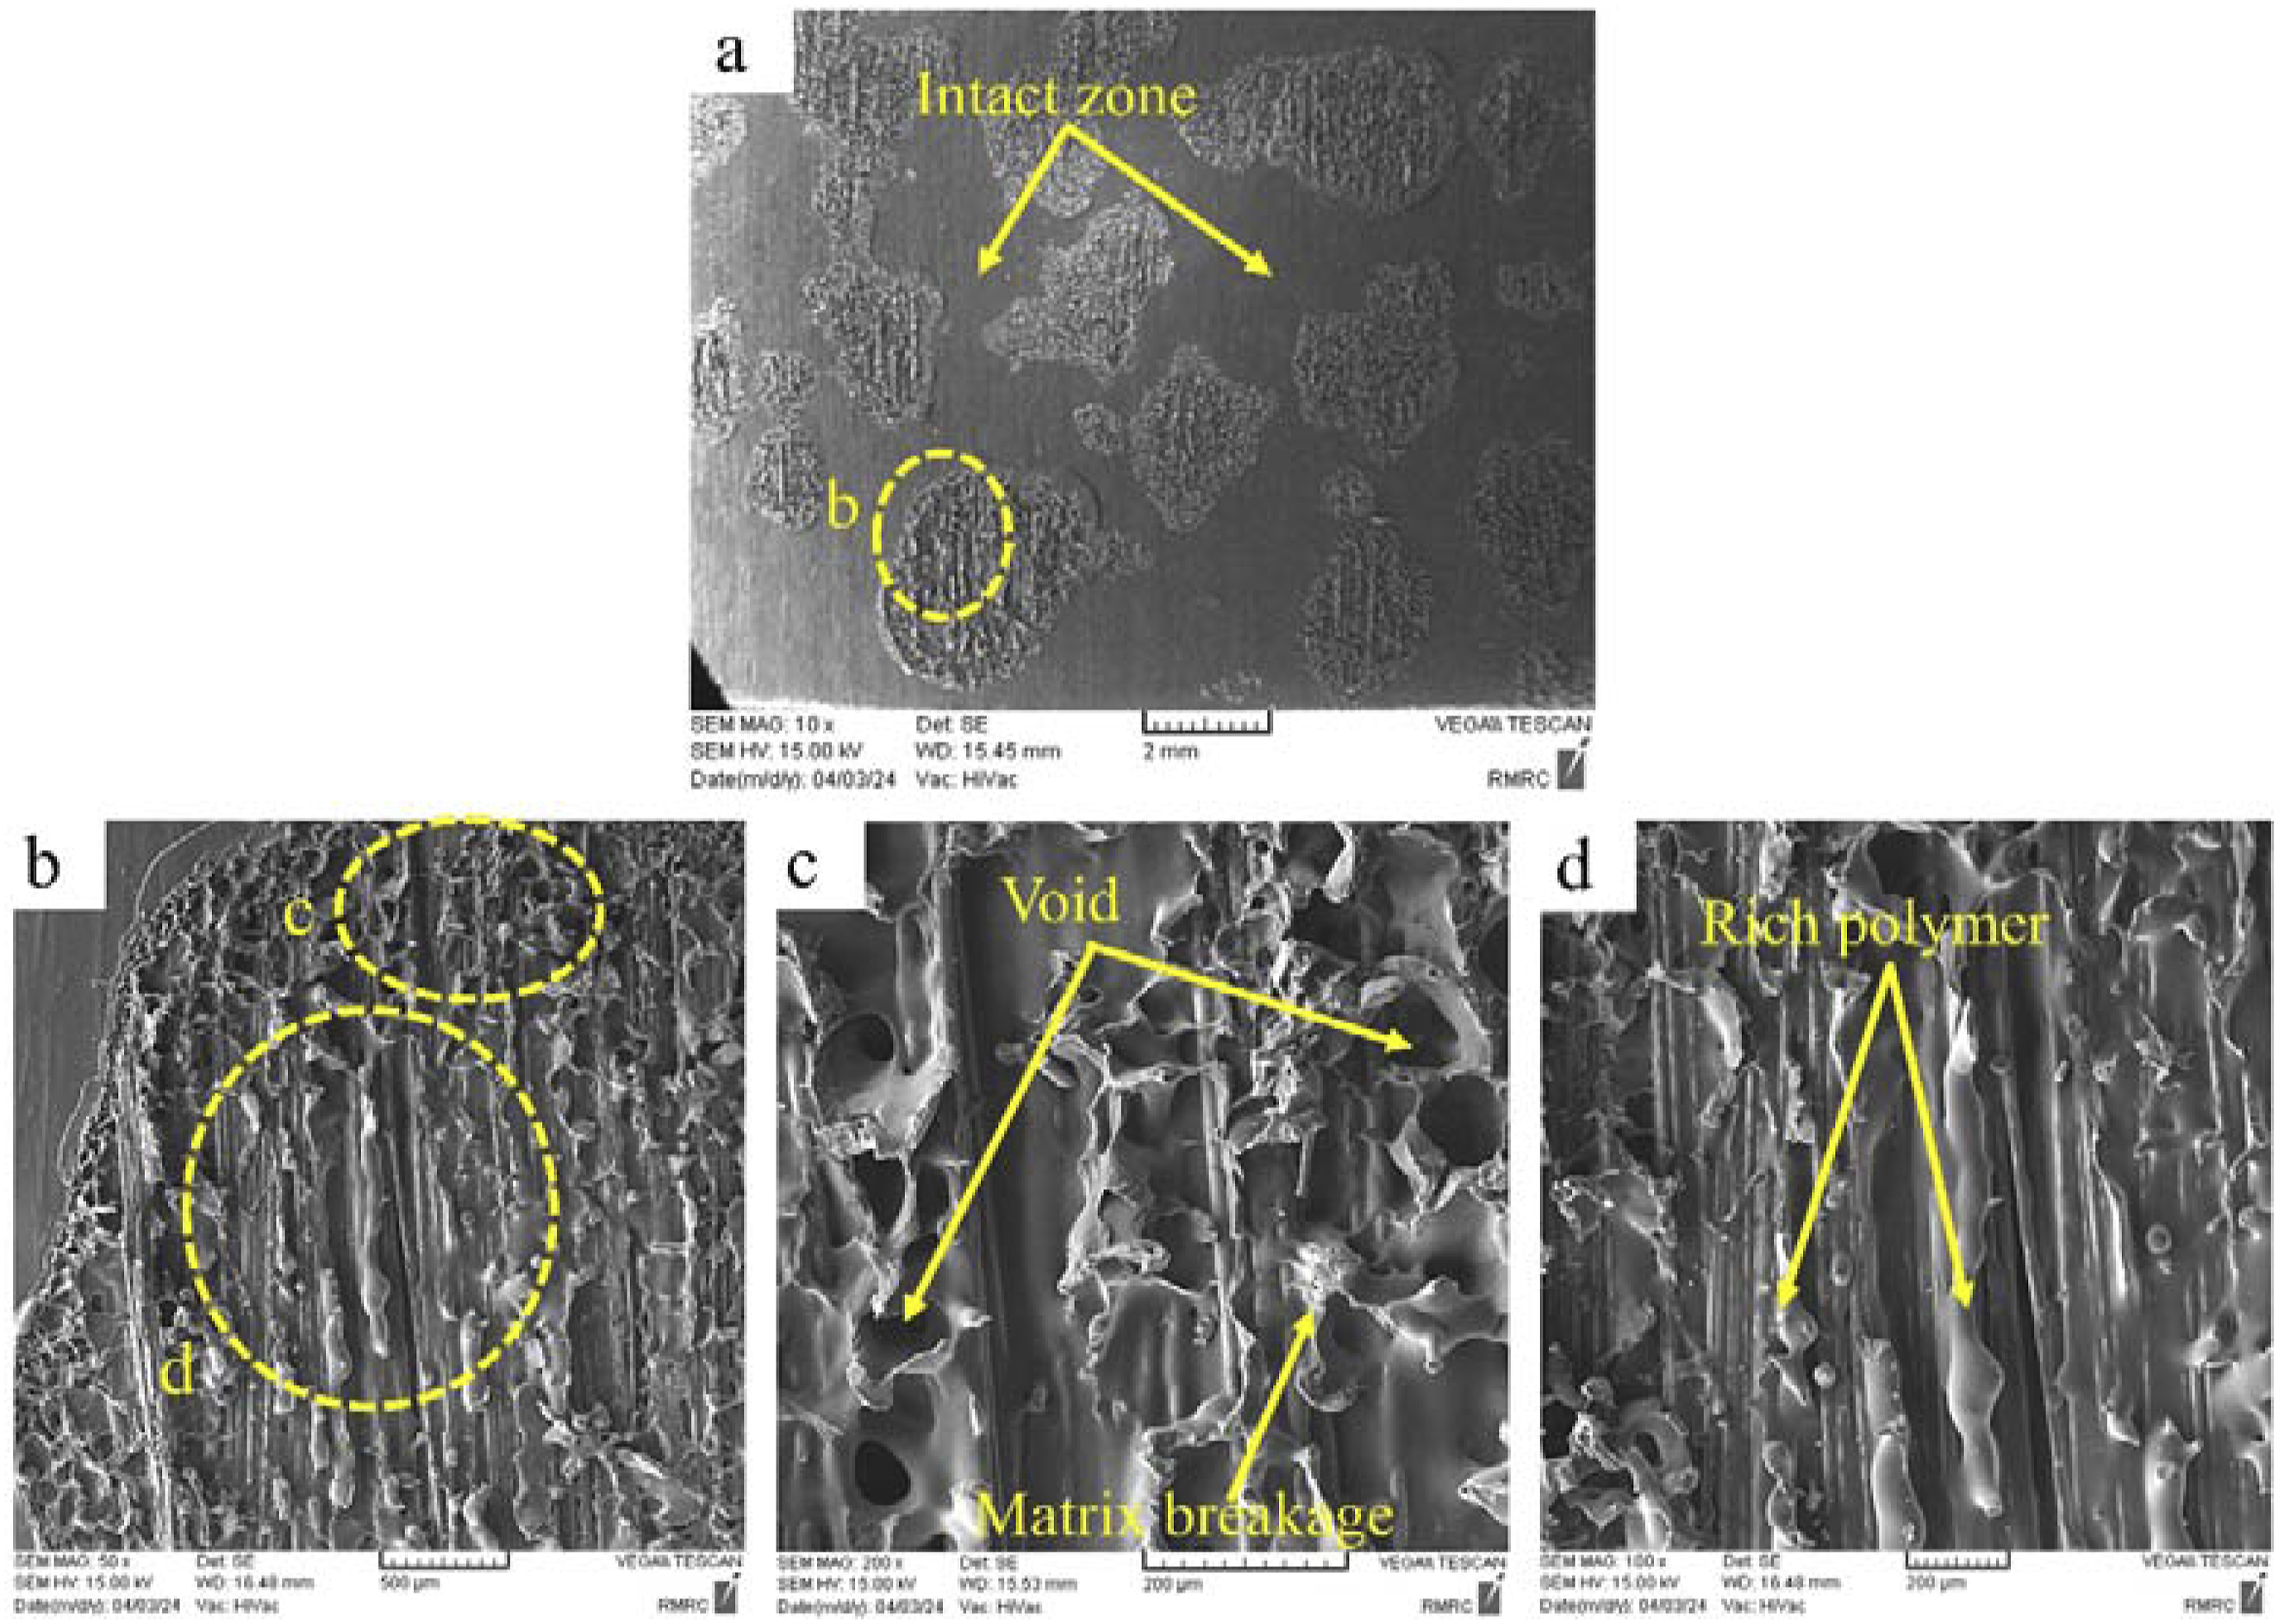
Figure 9 shows the cross-sectional image of the fourth sample resulting from welding test number 10. Figure 9(a) displays the overlapping cross-section of the composite adherends in a plane perpendicular to the welding line. The arrows on both sides of the images in Figure 9 indicate the location of the interface. Generally, the presence of voids along the thickness of the composite adherends in the overlapping area can indicate melting and movement of the polymer during welding, leading to the formation of these voids. Figure 9(b) and (d) show regions b and d, respectively, as specified in Figure 9(a). The voids in Figure 9(b) and (d) are exclusive to the 0° plies in contact with the interface, indicating shallow melting compared to the interface of the adherends. Figure 9(c) also shows the composite stacking sequence layers after welding. Due to the lack of polymer melting in different areas, the thickness of the layers and the direction of the fibers have not changed. Shallow melting of the polymer in weak welds leads to low weld penetration. Figure 10(a) shows the scanning electron microscope (SEM) image of the fracture surface of the third sample from welding test number 10. Figure 10(b) highlights zone b from Figure 10(a). As shown in Figure 10(b), low weld penetration in weak welds results in inadequate integration of the fibers and polymer at the interface between the upper and lower composite adherends. In such cases, the polymer is primarily responsible for the joint, as there are no fibers present in the fracture surface, meaning the fibers do not contribute to bearing the mechanical load on the joint. Consequently, weak welds exhibit low strength. Figure 10(c), which depicts zone c from Figure 10(b), illustrates the presence of numerous voids in the welded areas. These voids, which are typically circular in shape, have an average size of 75 μm. The shape of these voids suggests that their formation is due to inadequate consolidation during the cooling stage of welding and the premature removal of welding pressure. Since the fibers in weak welds do not effectively bear the mechanical load, the joint destruction mechanism in these welds involves the destruction of the polymer matrix. This includes matrix breakage, as illustrated in Figure 10(c) and (d). Microscopic image of the overlap cross-section of a weak weld sample (the fourth sample in test no. 10) under parameters of 600 W power, 20 mm/s speed, and 2 bar pressure (a) general view of the overlap cross-section (b) area b in image (a) (c) area c in image (a) (d) area d in image (a). SEM image of the fracture surface of a weak weld sample (the third sample in test no. 10) under parameters of 600 W power, 20 mm/s speed, and 2 bar pressure (a) general view of the fracture surface (b) area b in image (a) (c) area c in image (b) (d) area d in image (b).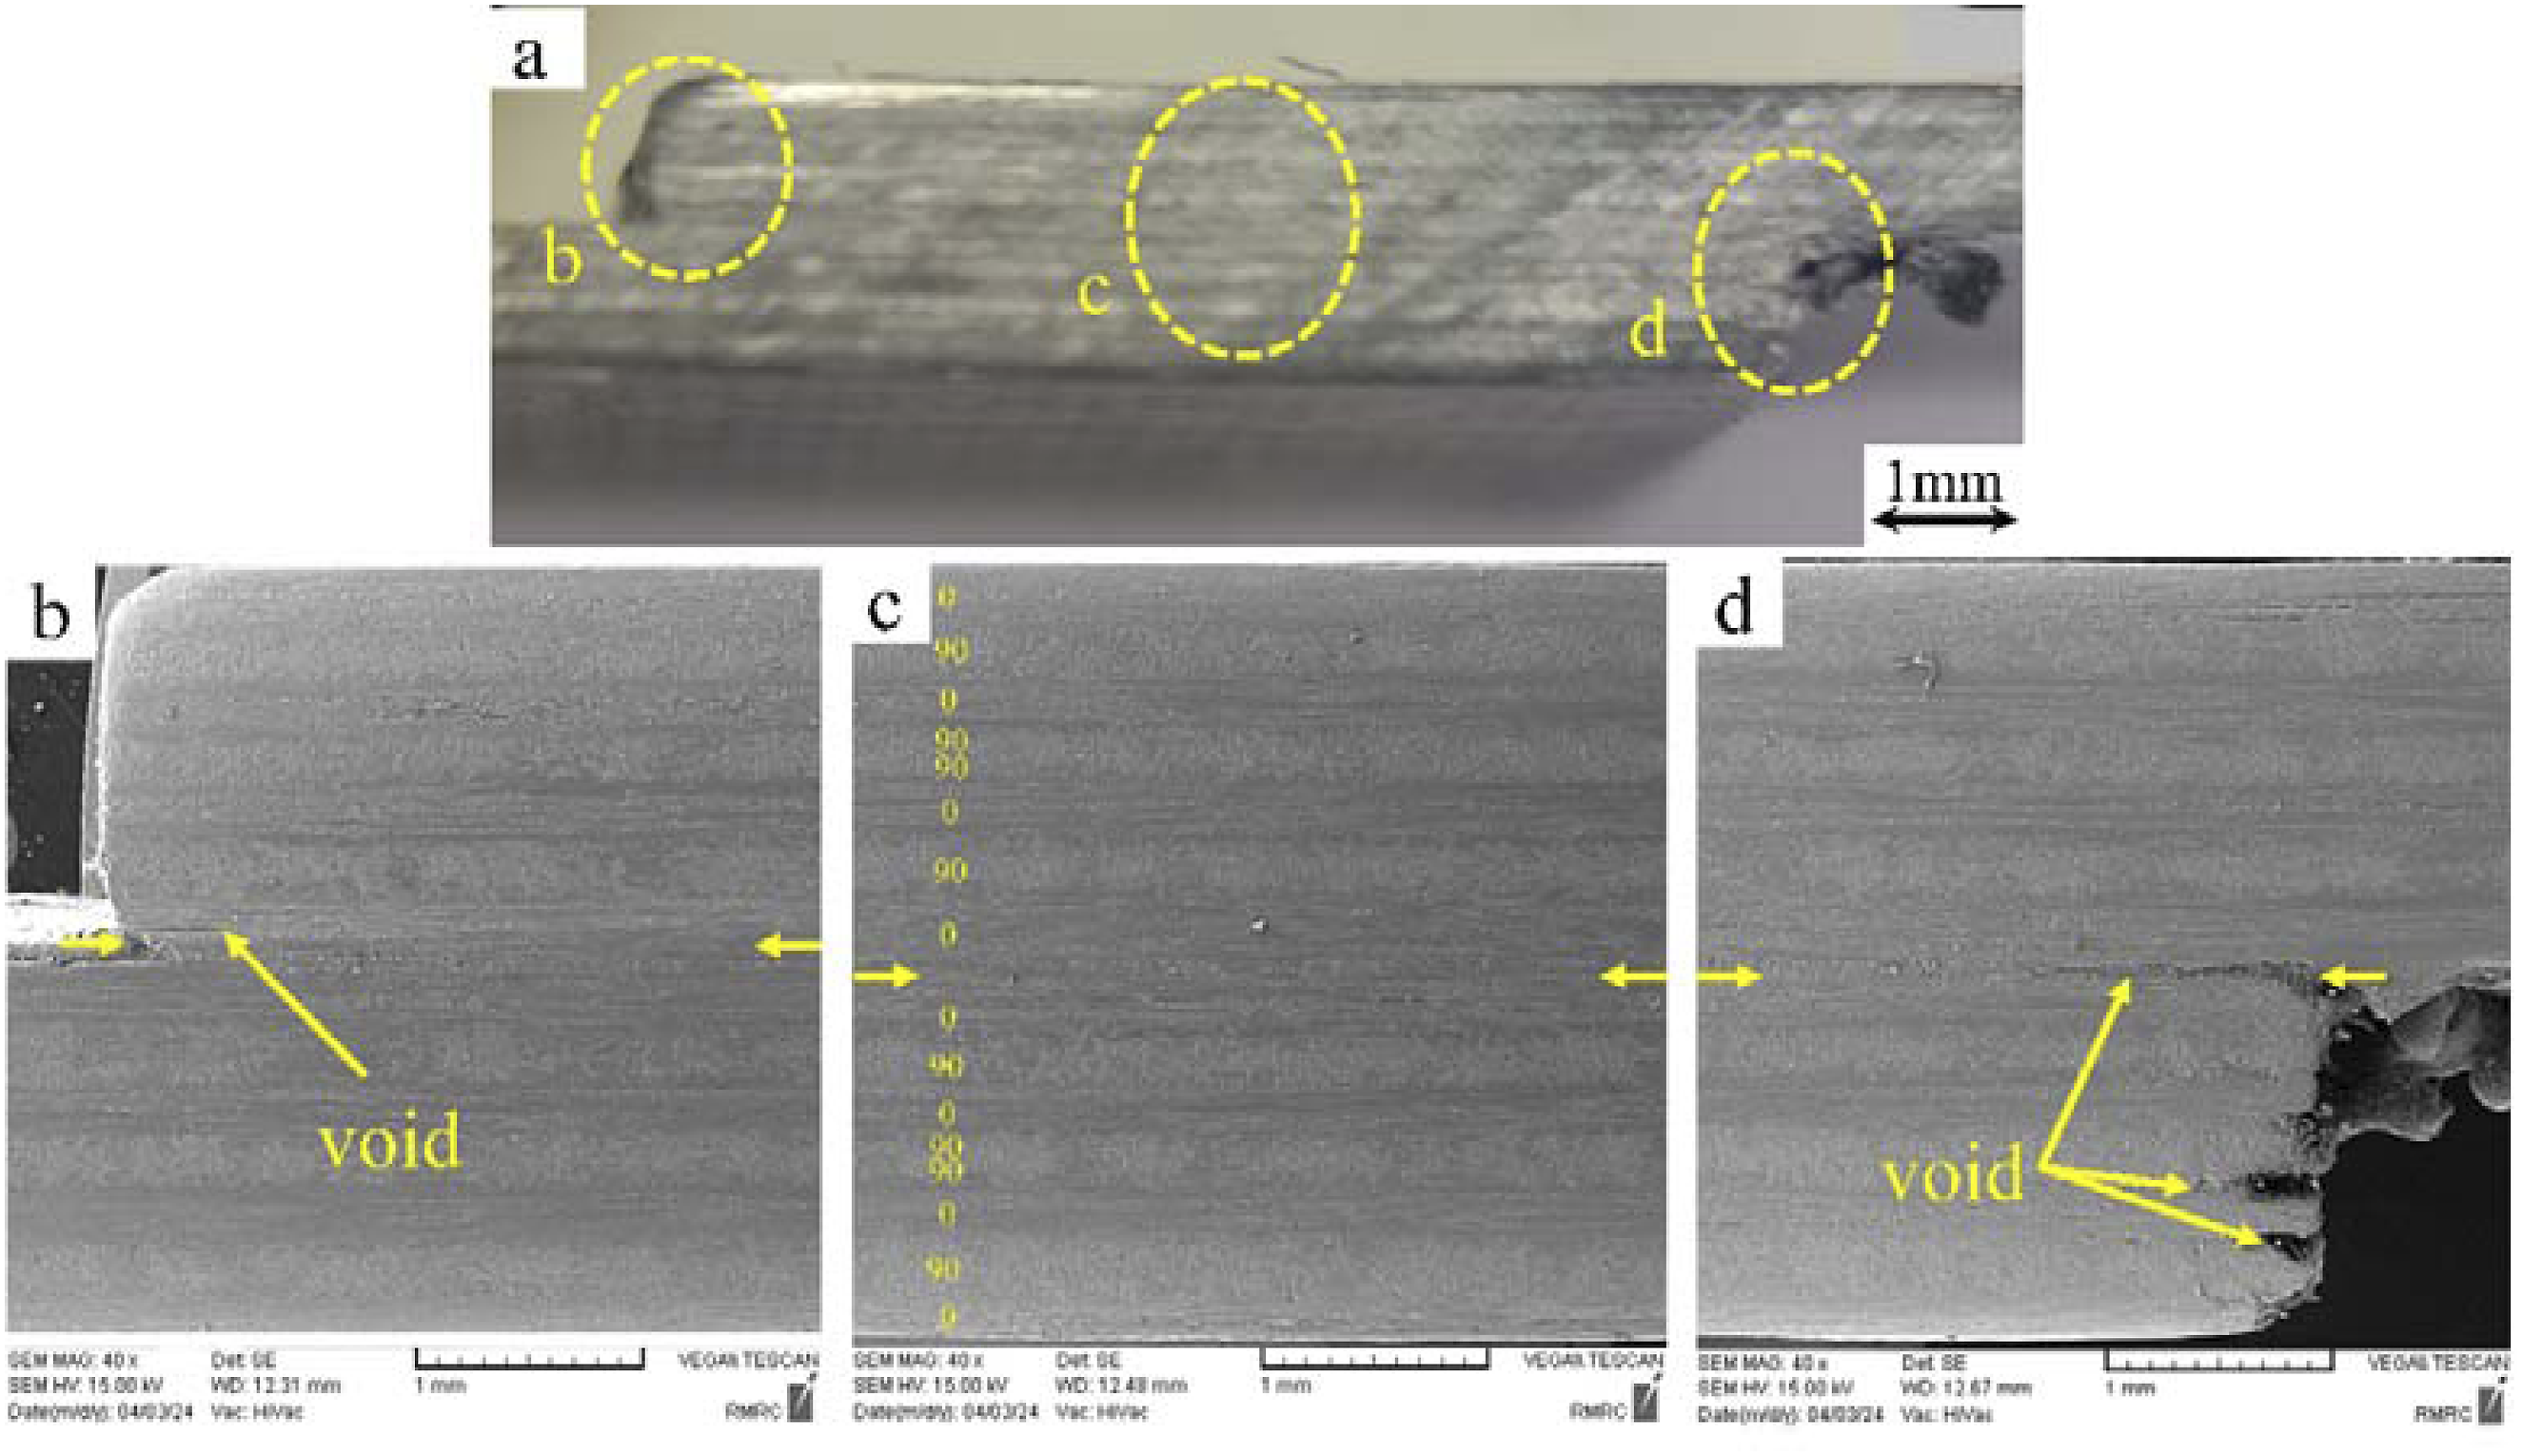
Average weld
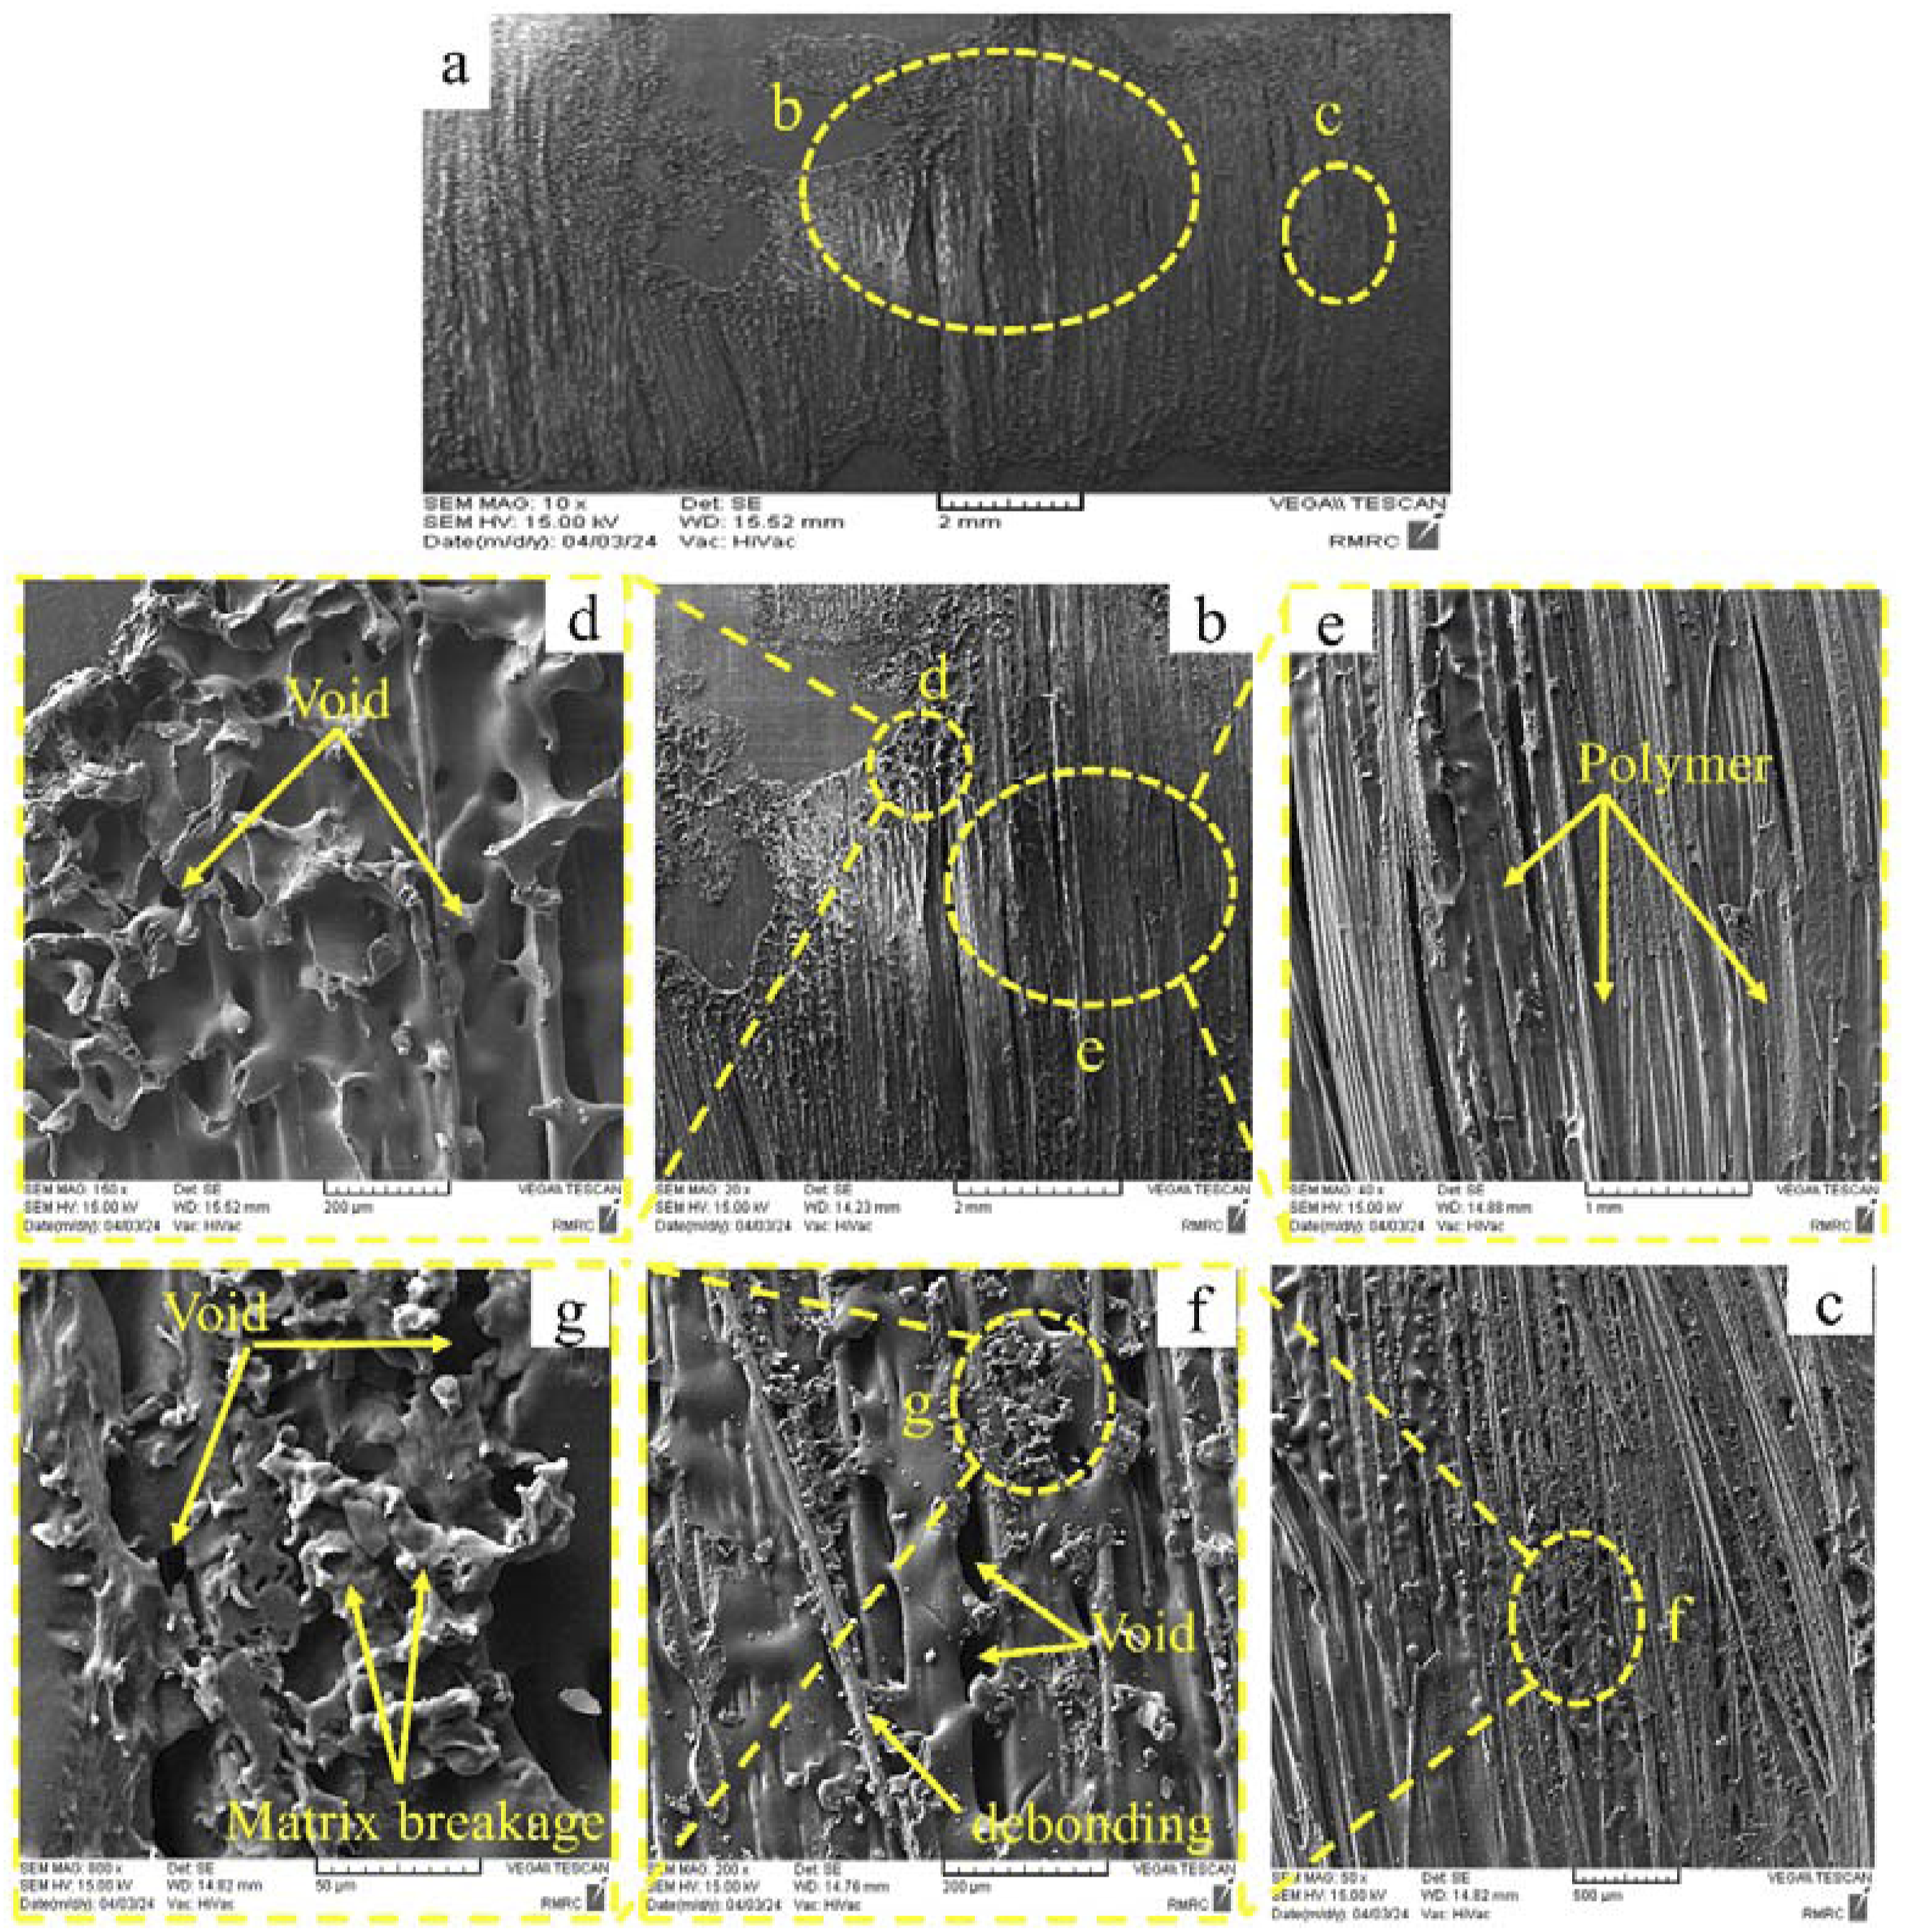
Average continuous ultrasonic welds have a strength between 5 and 10 MPa. Figure 8(b) shows the fracture surfaces of welding test number five, conducted under welding parameters of 900 W power, 20 mm/sec speed, and 1.5 MPa (3 bar) pressure. Due to the higher welding power compared to weaker welds, it has more welded areas than those in Figure 8(a). Small unwelded areas can still be seen in Figure 8(b), likely due to unbalanced heating caused by the sonotrode.18,34 Figure 11 shows the cross-sectional image of an average weld sample (the fourth sample from welding test No. 14). Figure 11(a) shows the cross section of the welding overlap in a plane perpendicular to the welding line. The small arrows on both sides of Figure 11(a) and (c) indicate the location of the interface adherends. Figure 11(b)–(d) highlight regions b, c, and d from Figure 11(a), respectively. The presence of voids and the local absence of polymer in the first and second layers, compared to the interface shown in Figure 11(b), indicate that the depth of the melted polymer relative to the interface is greater than that observed in the weak weld category. The voids in Figure 11(d), due to their proximity to the edge of the adherends, are primarily caused by the exit of molten polymer from around the overlap of the adherends (squeeze flow), which results from the increased generation of viscoelastic heat in average welds. The dashed ellipses in Figure 8(b) highlight the squeeze flow and the exit of polymer and fibers from around the overlap. Figure 12(a) shows the fracture surface of the third sample from test number five (average weld), conducted with parameters of 900 W power, 20 mm/s speed, and 3 bar pressure. Figure 12(b) and (c) highlight regions b and c in Figure 12(a), respectively. Increasing the depth of molten polymer in average welds creates conditions for better integration of fibers and polymer at the interface between the upper and lower adherends. As Figure 12(b) and (c) show, the fracture surface of this group of welds includes both polymer and fibers. In fact, the presence of more fibers in the average welds has increased the shear strength of the joint. Figure 12(d) and (e) show areas d and e in Figure 12(b), respectively, while Figure 12(f) and (g) show areas f and g in Figure 12(c) and (f). The joint failure modes in average welds, due to the presence of polymer and a percentage of fibers at the interface, include destruction of the polymer matrix and fibers. For example, in Figure 12(e)–(g) phenomena such as matrix breakage, debonding, and the presence of voids are observed. In general, two types of voids are observed in average welds: (1) voids similar in appearance to those in Figure 12(f), and (2) voids similar in appearance to those in Figure 12(d). The first case can be caused by the movement of molten polymer between the fibers during welding. In fact, the entrapment of gas or air within the molten polymer flow locally alters the permeability of the melt among the fibers, resulting in changes in the velocity of the molten polymer and ultimately leading to the formation of voids.
35
The shape of this type of void is usually oval, with average major and minor diameters of 87 μm and 22.5 μm, respectively. Because the melting of polymer in average welds is usually limited to two layers relative to the interface, with the upper and lower layers remaining solid, the melted polymer is subjected to pressure from the solid layers and moves among the fibers. The collision of the viscous polymer with the fibers alters the local direction of the melt and creates conditions conducive to the formation of this type of void. The second case can be caused by non-consolidation during the cooling stage. These circular voids have an average size of 57 μm, which is smaller than that of the voids observed in weak welds. Microscopic image of the overlap cross-section of an average weld sample (the fourth sample in test no. 14) under parameters of 900 W power, 20 mm/s speed, and 1 bar pressure (a) general view of the overlap cross-section (b) region b in image (a) (c) region c in image (a) (d) region d in image (a). SEM images of the fracture surface of an average weld sample (the third sample in test number 5), under parameters of 900 W power, 20 mm/s speed, and 3 bar pressure (a) general view of the fracture surface (b) area b in image (a) (c) area c in image (a) (d) area d in image (b) (e) area e in image (b) (f) area f in image (c) (g) area g in image (f).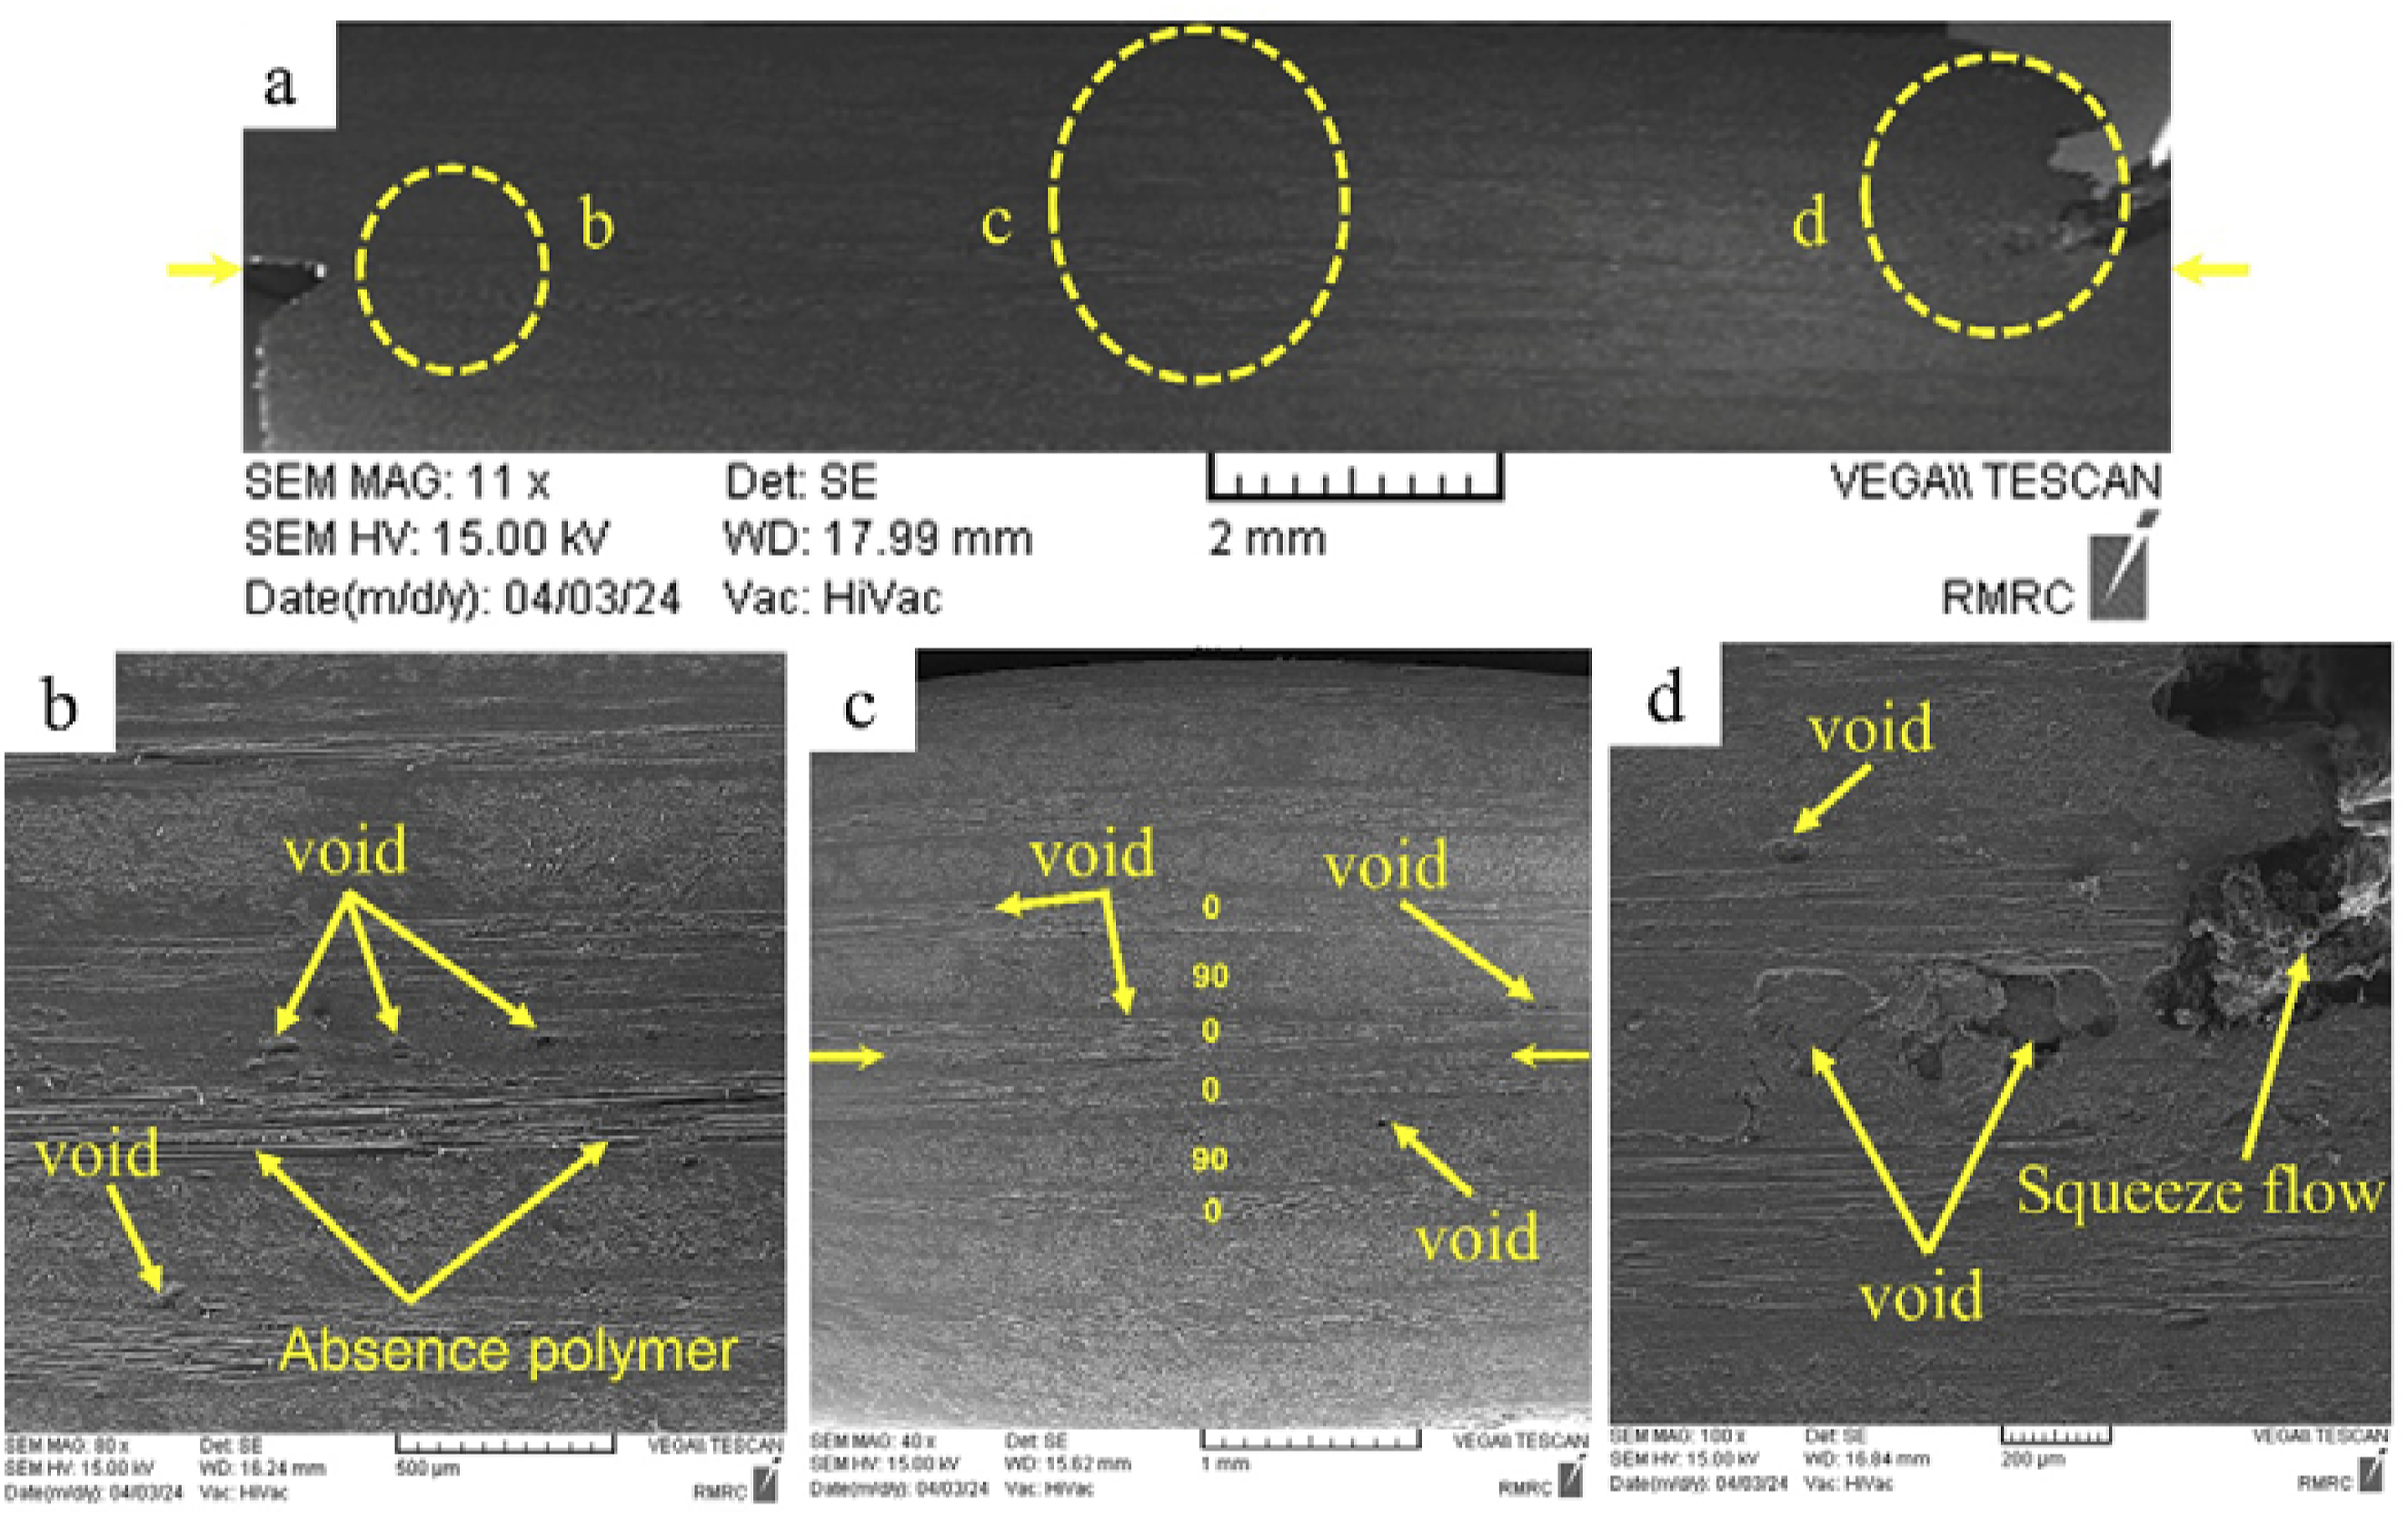
Strong weld
Figure 8(c) shows the fracture surfaces of a strong weld sample, with strength ranging from 10 to 15 MPa, obtained from test number seven. This test was conducted under welding parameters of 1200 W power, 20 mm/sec speed, and 1 MPa (2 bar) pressure. As shown in Figure 8(c), almost no unwelded areas are visible on the fracture surfaces, indicating that uniform welding was achieved. The power adjustment range for strong welds, approximately 900-1200 W, seems to have generated sufficient viscoelastic heat at the interface and within the composite adherends. Additionally, pressure and speed settings near these limits (1–2 bar and 20–30 mm/s, respectively) facilitated effective heat production. This heat enabled the melting and diffusion of polymer chains across surface peaks caused by unevenness between the adherends, thereby minimizing welding non-uniformity.
Figure 13 shows cross-sectional images of the fourth sample from welding test number seven, conducted under parameters of 1200 W power, 20 mm/s speed, and 2 bar pressure. Figure 13(a) displays the overlapping cross-section of the adherends in a plane perpendicular to the weld line. The oblique arrows in Figure 13(a) indicate the extrusion of polymer from around the overlapping adherends (squeeze flow), results from excess molten polymer in strong welds. Increased squeeze flow in strong welds can lead to inadequate consolidation at the overlapping edges of the adherends, causing voids at the edge.
36
Figure 13(b)–(d) show the areas marked b, c, and d in Figure 13(a), respectively. As shown in Figure 13(b) and (d), the voids created along the thickness of the composite adherends are not confined to the interface and adjacent layer; rather, they are visible in various areas, indicating significant depth of molten polymer relative to the interface. Microscopic image of the overlap cross-section of a strong weld sample (the fourth sample from welding test no. 7), under the parameters of 1200 W power, 20 mm/s speed, and 2 bar pressure (a) overview of the overlap cross-section (b) region b in image (a) (c) region c in image (a) (d) region d in image (a).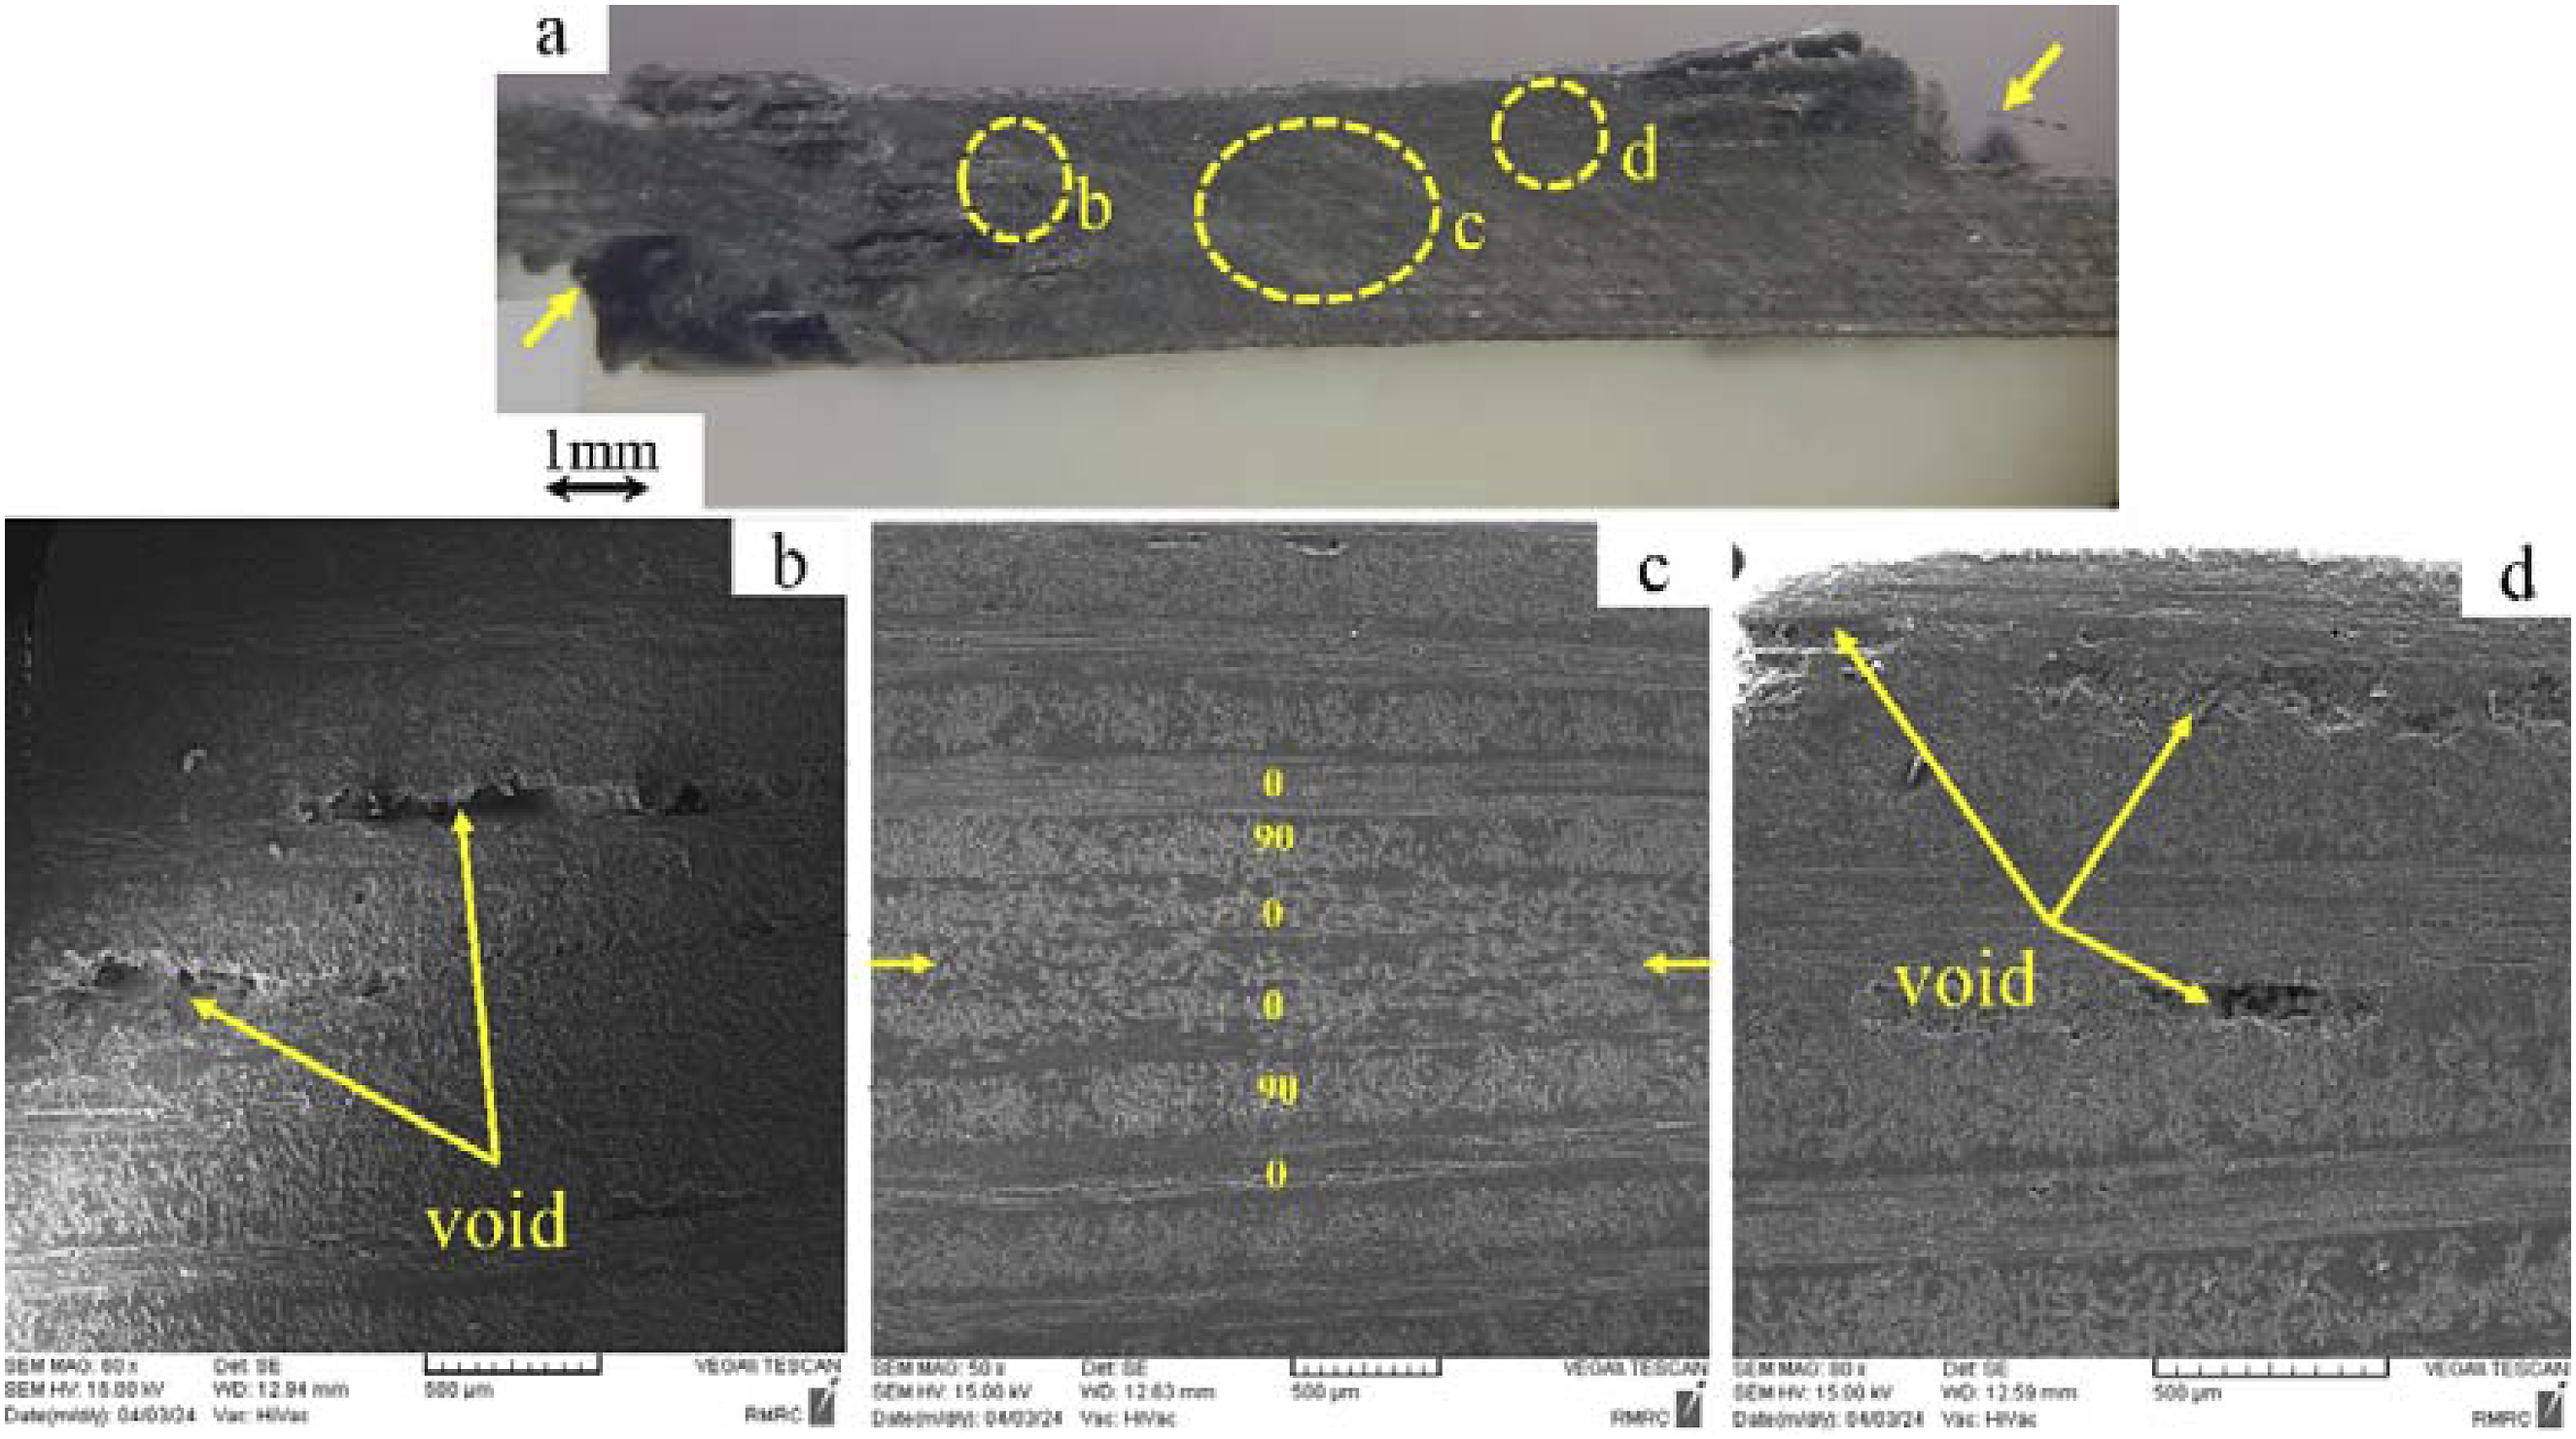
It should be noted that the presence of voids along the thickness of the composite adherends in the overlapping area did not affect the shear strength of the continuous weld, as failure occurred at the interface, and no signs of mechanical damage or crack propagation due to the voids were observed. The high penetration of the weld and significant depth of molten polymer in strong welds ensure proper and uniform integration of the matrix and fiber at the interface between the upper and lower composites. Consequently, the upper and lower composite adherends at the interface form a single 16-layer composite laminate. According to Figure 13(c), the fibers in the 0
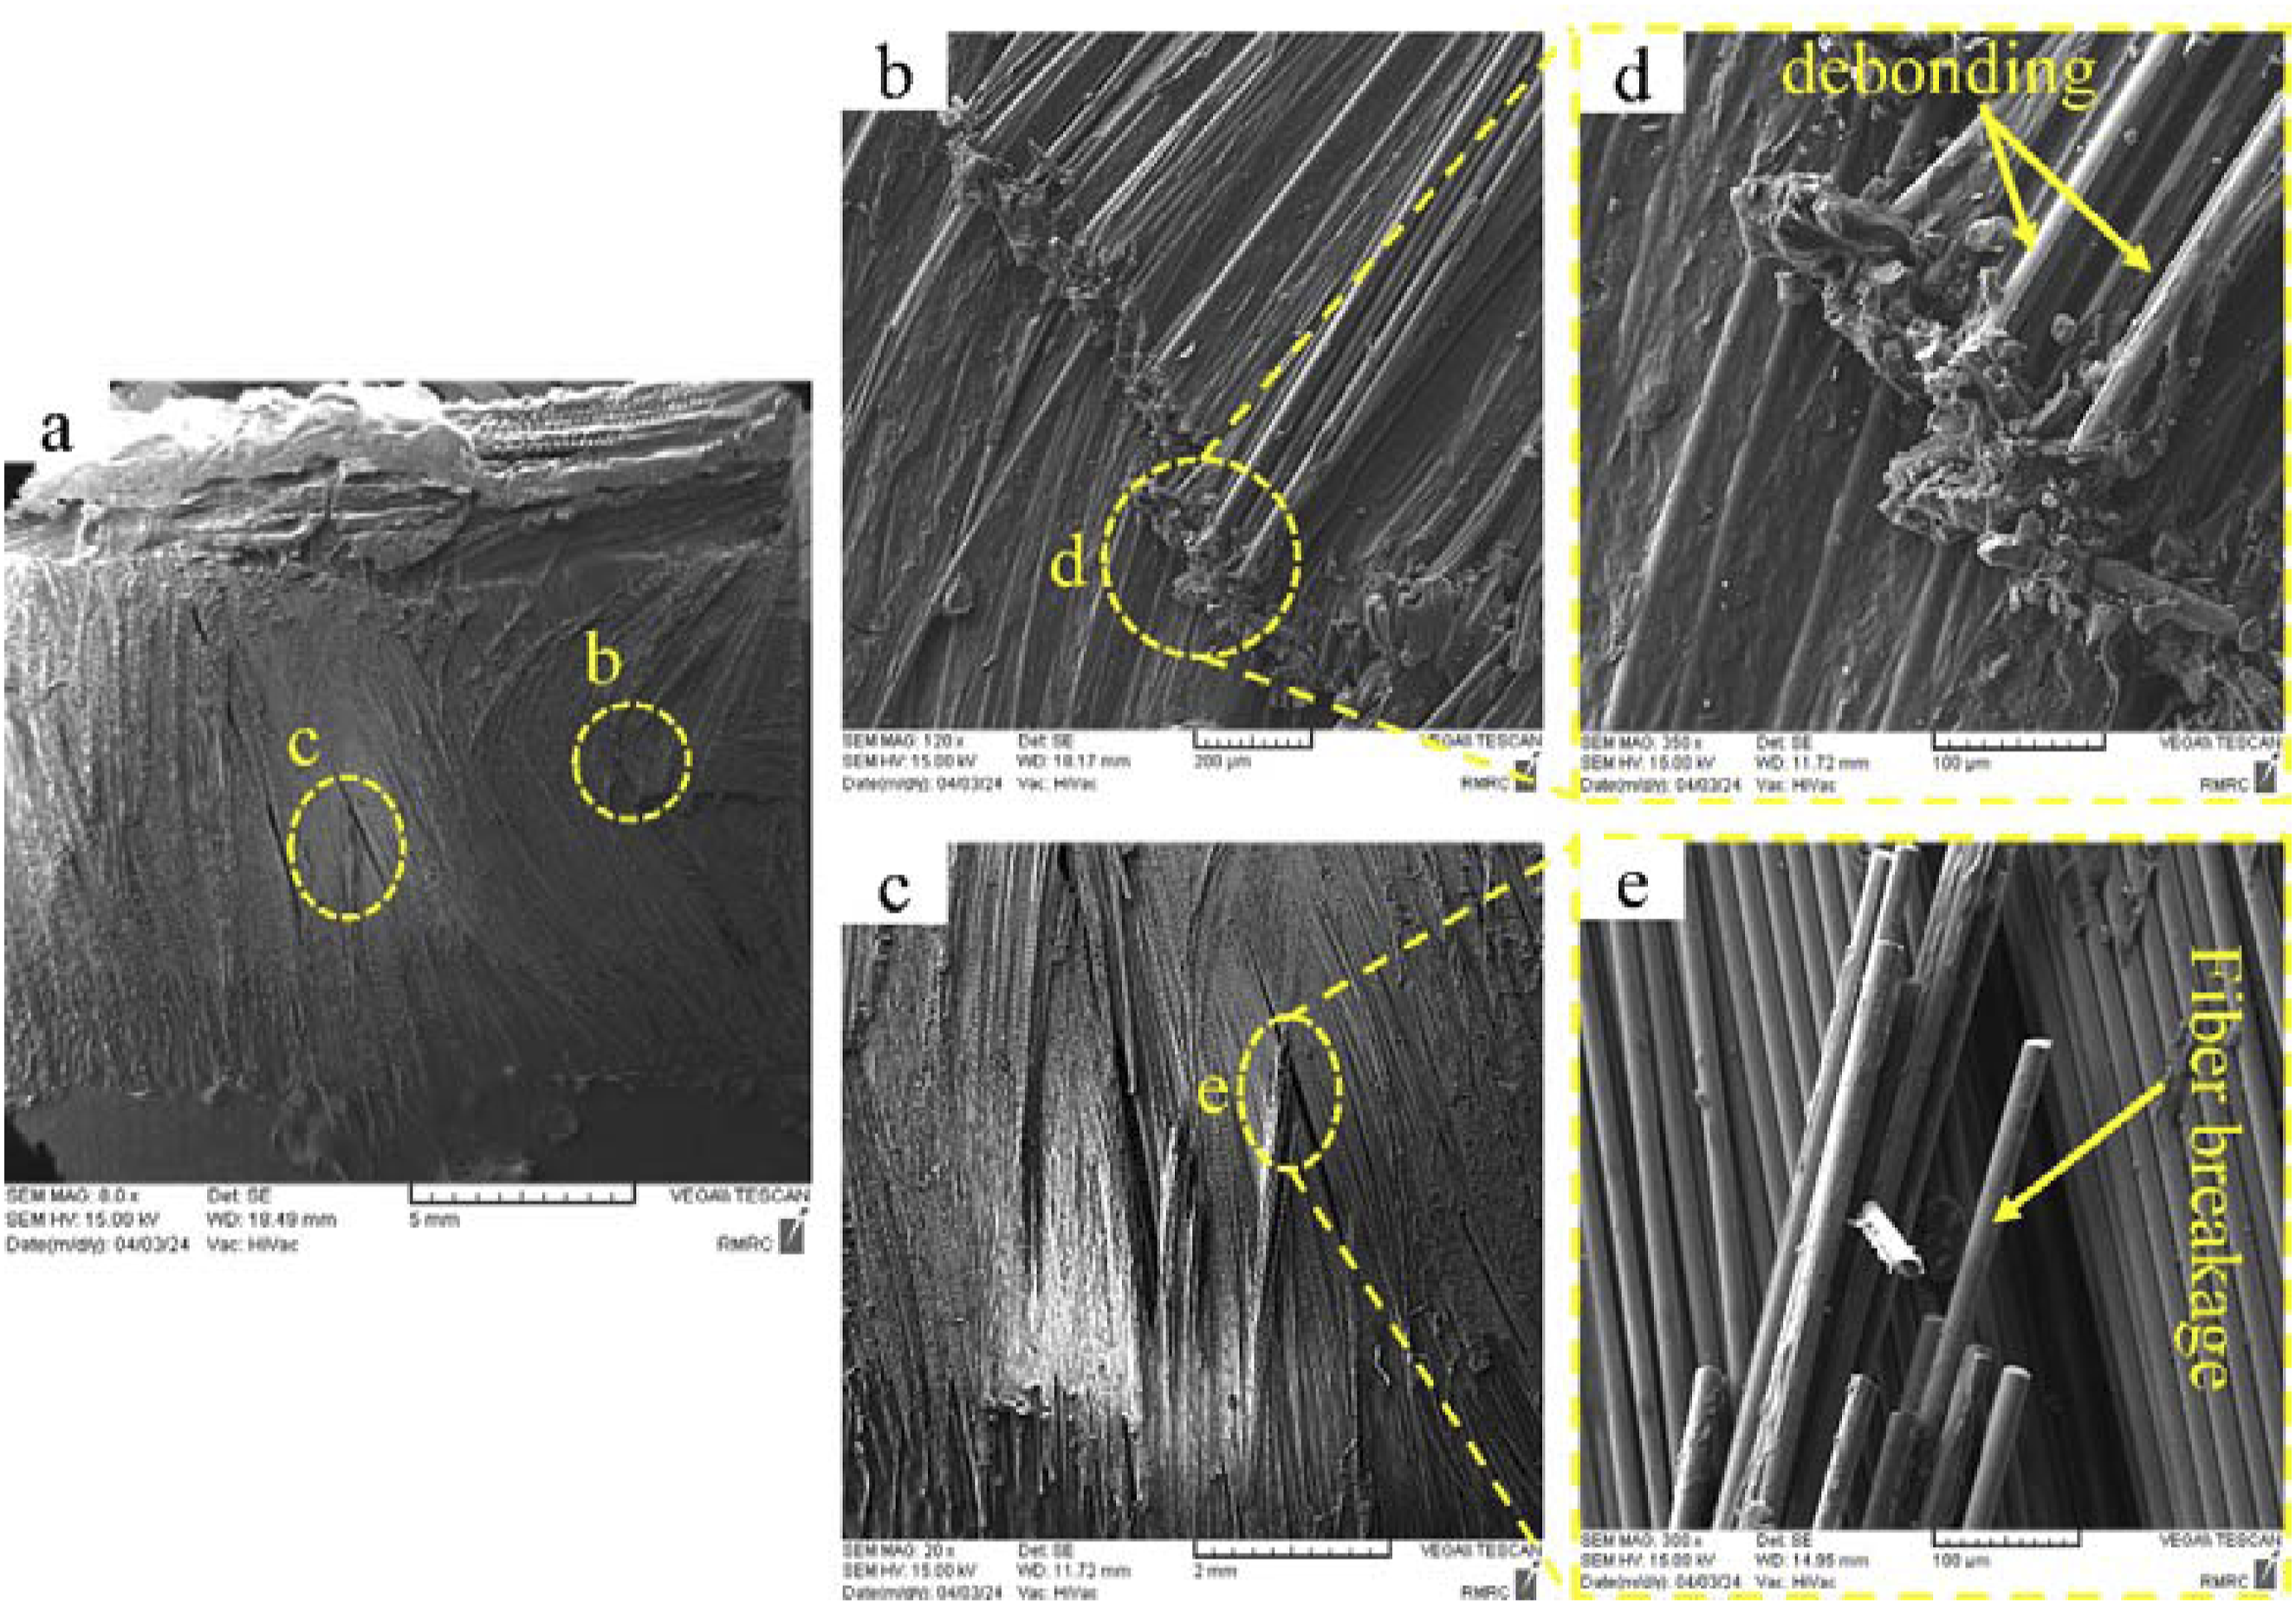
Figure 14(a) shows the fracture surface of the fourth sample from welding test number four, conducted with welding parameters of power 900 W, speed 10 mm/sec, and 2 bar pressure. Figure 14(b) and (c) display regions b and c from Figure 14(a), respectively. Due to the proper integration of fibers and polymer at the interface, the fibers play a significant role in bearing mechanical loads. As a result, the fracture surface of strong welds typically includes a large percentage of fibers, as seen in Figure 14(b) and (c). The presence of fibers in load-bearing areas means that most joint degradation mechanisms in strong welds are related to fiber damage. For example, Figure 14(b) and (c) show the local peeling of the Optical microscope images of the fracture surface of a strong weld sample (the fourth sample from welding test no. 4), under welding parameters of 900 W power, 10 mm/s speed, and 2 bar pressure (a) general view of the fracture surface (b) area b in image (a) (c) area c in image (a). SEM images of the fracture surface of a strong weld sample (the fourth sample from welding test no. 4) under welding parameters of 900 W power, 10 mm/s speed, and 2 bar pressure (a) general view of the fracture surface (b) area b in image (a) (c) area c in image (a) (d) area d in image (b) (e) area e in image (c).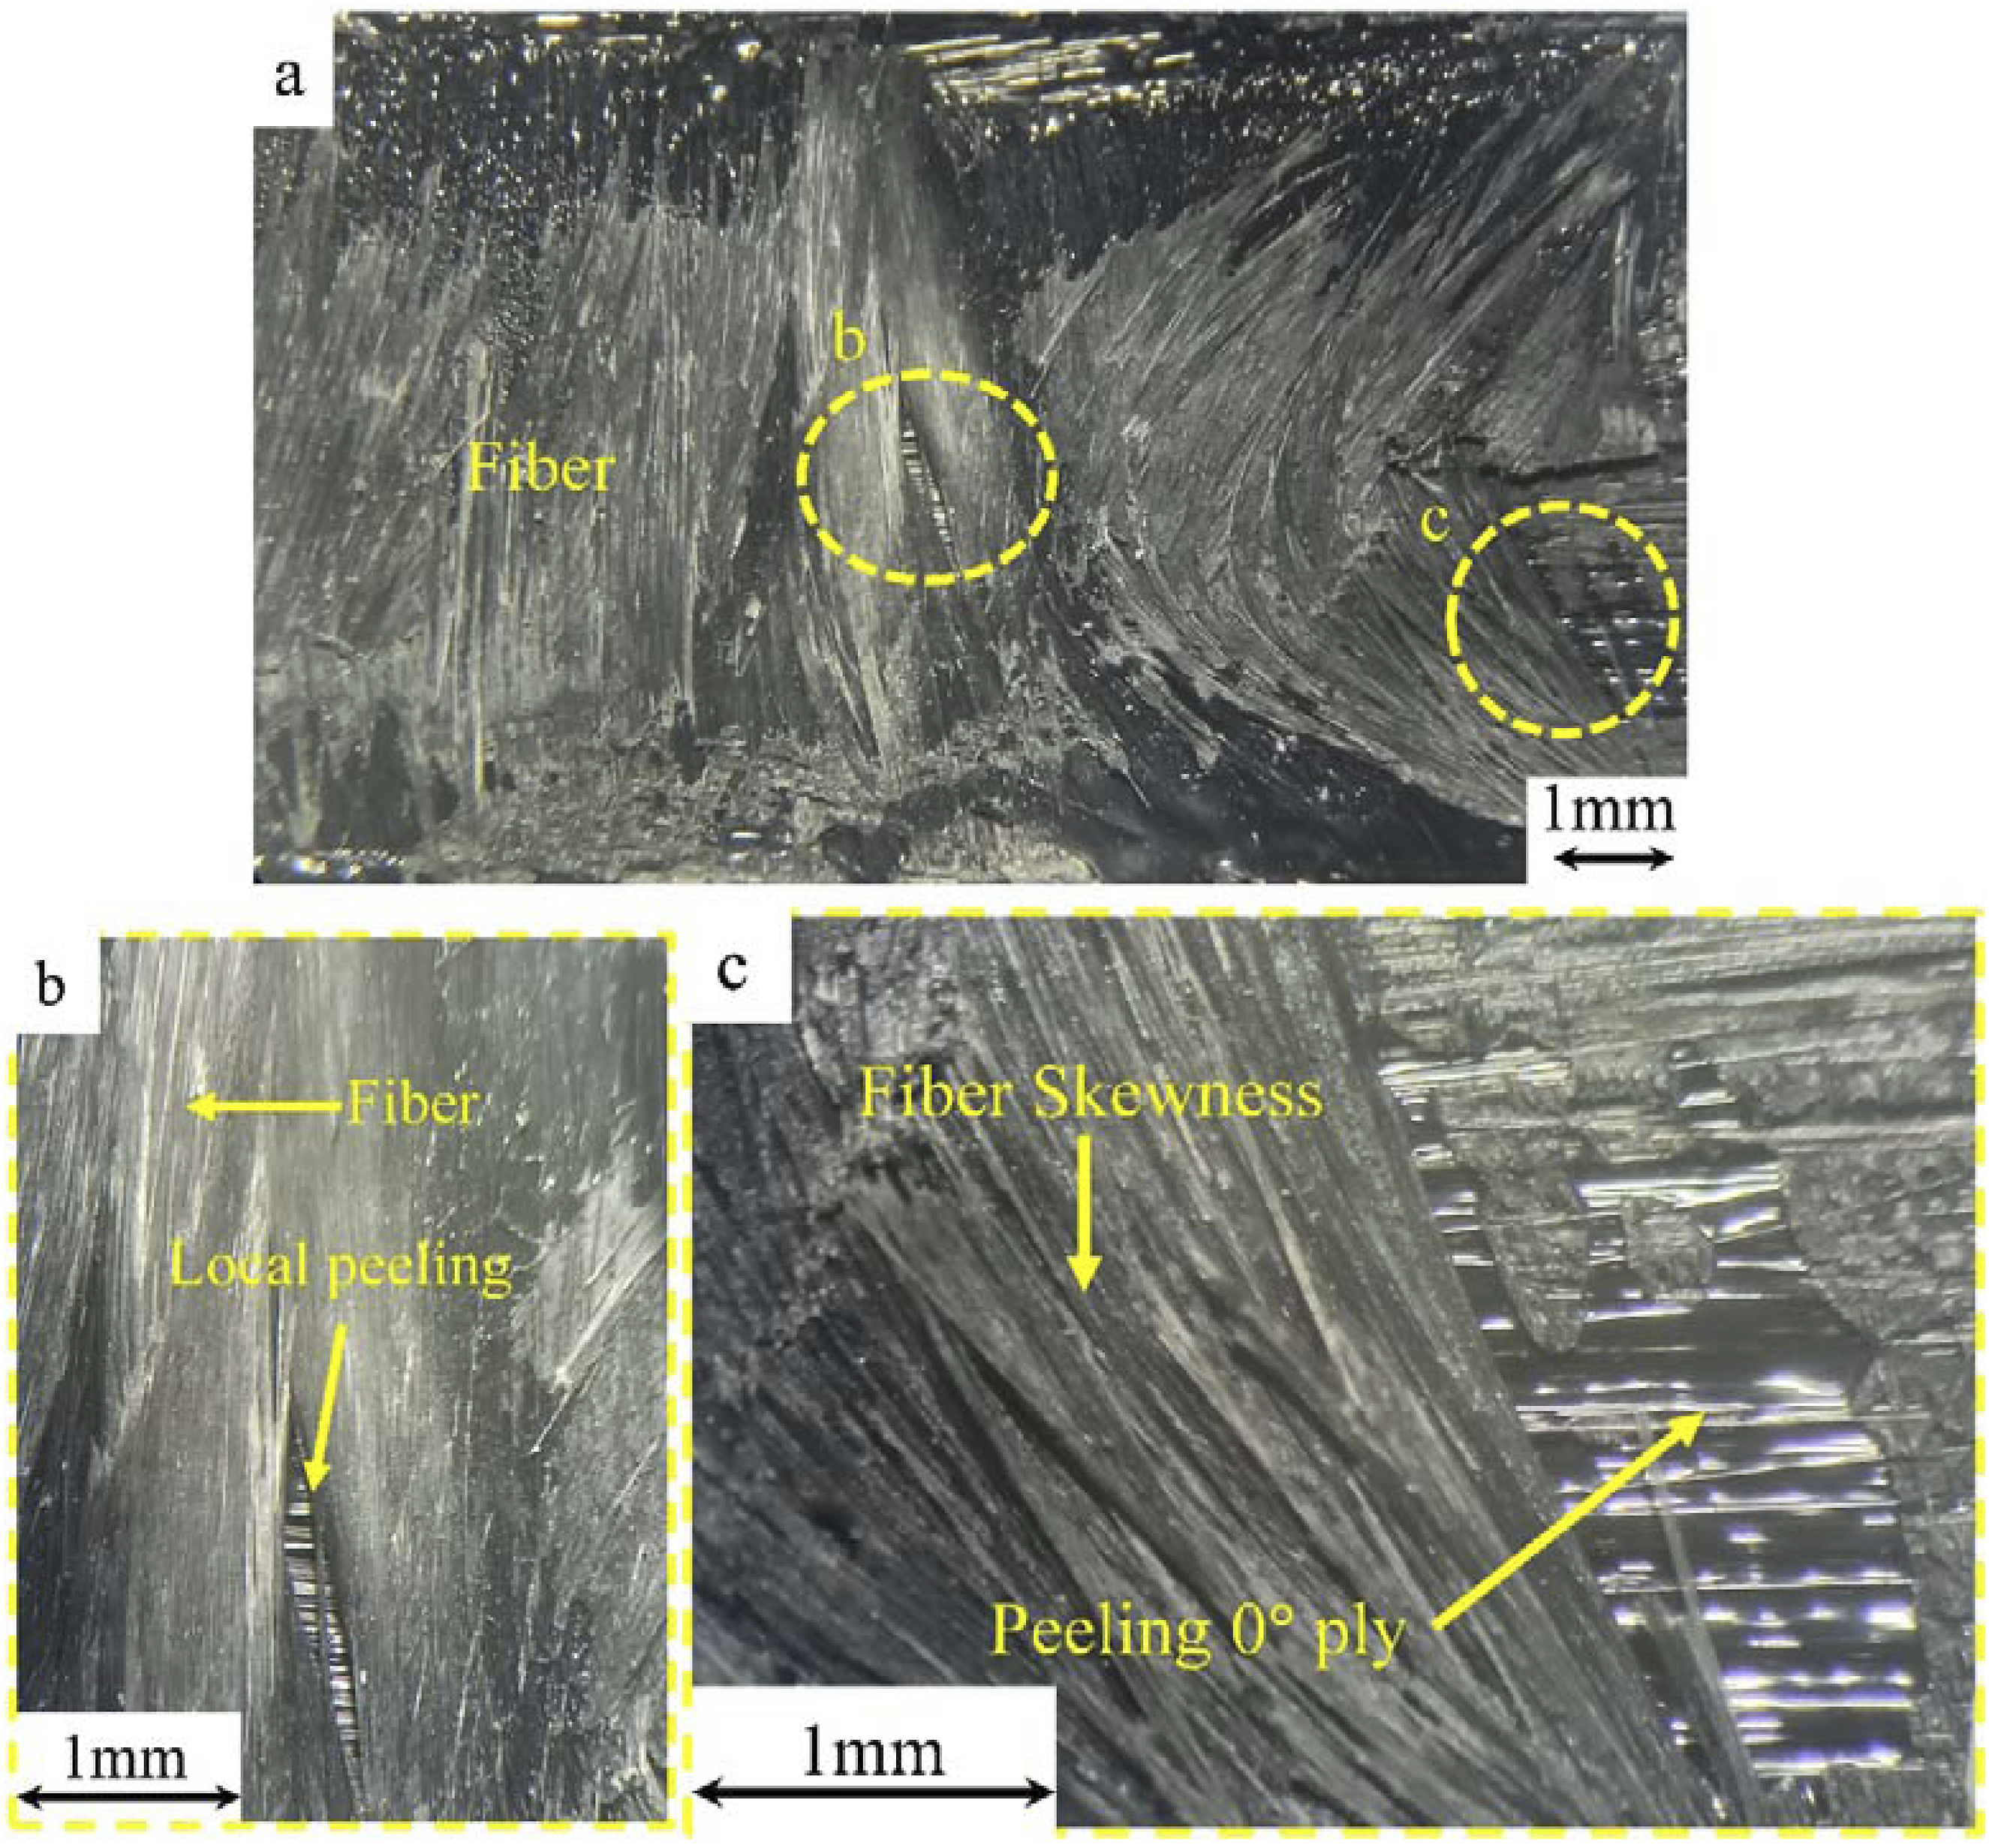
Process parameters optimization
Optimization of the continuous ultrasonic welding process for thermoplastic composites (UD GF/PA6) is conducted from two perspectives, based on the cases examined in this study. Microscopic investigations of the fracture surfaces and overlap cross-sections were performed to establish a relationship between microscopic phenomena and the parameters of the continuous welding process. The most critical issues that must be carefully controlled to achieve high-quality continuous ultrasonic welding of unidirectional fiber-reinforced thermoplastic composites include: (1) the change in 0° fiber orientation at the interface between the adherends, (2) the squeeze flow of molten polymer from around the overlap region, and (3) the fiber orientation change at the surface of the composite plate in contact with the sonotrode.
As stated in relation to Figure 8(c), the simultaneous adjustment of power at its high level and welding speed at its low level leads to an increase in the amount and fluidity of the molten polymer. Due to the low welding speed and the resulting longer exposure of the interface to ultrasonic vibrations in this condition, a change in 0° fiber orientation occurs at the interface. Additionally, the increased fluidity of the molten polymer makes the squeeze flow phenomenon more prominent (Figure 8(c)). On the other hand, as discussed in factors effects regarding the interaction between power and speed, when the welding speed is at its low level (approximately 10 mm/s), increasing the power from a low level (about 600 W) to a high level (about 1200 W) does not improve the strength of the continuous weld. Therefore, it can be concluded that to achieve a high-strength weld—where the fiber orientation change at the interface is minimized and the squeeze flow is reduced—it is sufficient to adjust either the welding speed to its low level (about 10 mm/s) or the power to its high level (about 1200 W). Simultaneously adjusting both parameters to these levels moves the process away from the optimal welding condition.
Another important point is the change in fiber direction on the surface of the composite plate in contact with the sonotrode during welding. This issue is particularly significant in the welding of composites with unidirectional fibers. Based on preliminary experiments conducted in this study to define the effective range of each welding parameter, it was observed that at very low welding speeds (e.g., 5 mm/s), even with low welding power (600 W), a large amount of viscoelastic heat is generated due to the increased number of vibration cycles applied to the composite surface in contact with the sonotrode. This results in melting or even local evaporation of the polymer matrix on the composite surface.
As a result, since the sonotrode not only transmits ultrasonic vibrations but also applies welding pressure, the fiber orientation at the contact surface can change under these conditions. This fiber reorientation—caused by melting and evaporation of the matrix—alters the weight fraction of the matrix at the surface, leading to changes in joint thickness and surface fiber alignment. These changes can, in turn, affect the overall strength of the weld. Therefore, to avoid such undesirable effects, very low welding speeds (around 5 mm/s) should be avoided in continuous ultrasonic welding of UD GF/PA6 composites.
In addition to the requirements identified through microscopic studies for achieving optimal continuous ultrasonic welding, the optimization process was performed using the two-factor interaction (2FI) model developed for predicting lap shear strength, along with the Central Composite Design (CCD) method. For this purpose, the welding power and speed were varied within their respective ranges (−α to +α). Regarding the pressure factor, as shown in the ANOVA analysis, it was found to be statistically insignificant on its own (p-value = 0.3317). However, its interaction with power and speed, discussed in Figure 5, revealed that pressure does affect the transmission of ultrasonic vibrations. Specifically, when the pressure is set in the range from the low level to the center point (0.5–1 MPa or jack pressure 1–2 bar), the ultrasonic vibrations from the sonotrode are effectively transmitted to the composite material. In contrast, increasing the pressure from the center point to the high level (1–1.5 MPa or jack pressure 2–3 bar) gradually attenuates the sonotrode’s vibrations.
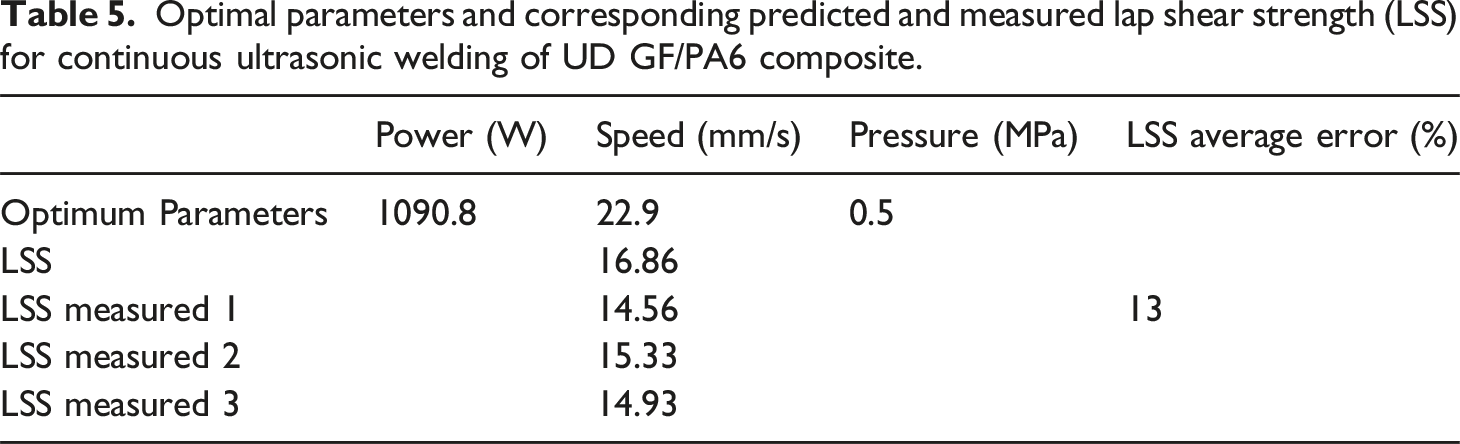
Optimal parameters and corresponding predicted and measured lap shear strength (LSS) for continuous ultrasonic welding of UD GF/PA6 composite.
In this research, the response surface method (RSM) was used to develop a suitable mathematical model for predicting the shear strength of continuous welding and investigating the effects of factors and their interactions on shear strength. This model is intended as a tool for in-situ process monitoring in future studies. Quantifying the strength of continuous welds and examining the influence of various factors are necessary but not sufficient for ensuring weld quality, especially in the continuous ultrasonic welding of thermoplastics reinforced with unidirectional fibers. In this context, the interaction between the composite laminate stacking sequence and the sonotrode, along with the factors affecting the process, are particularly important. Microscopic investigations of fracture surfaces and overlapping cross-sections of joints were conducted to establish a relationship between process factors and phenomena such as penetration, uniformity, voids, failure mechanisms, and changes in fiber direction. Finally, the necessary quantitative and qualitative indicators for achieving suitable continuous ultrasonic welding were obtained.
Comparison of lap shear strength between static and continuous ultrasonic welding in UD GF/PA6 thermoplastic composites.
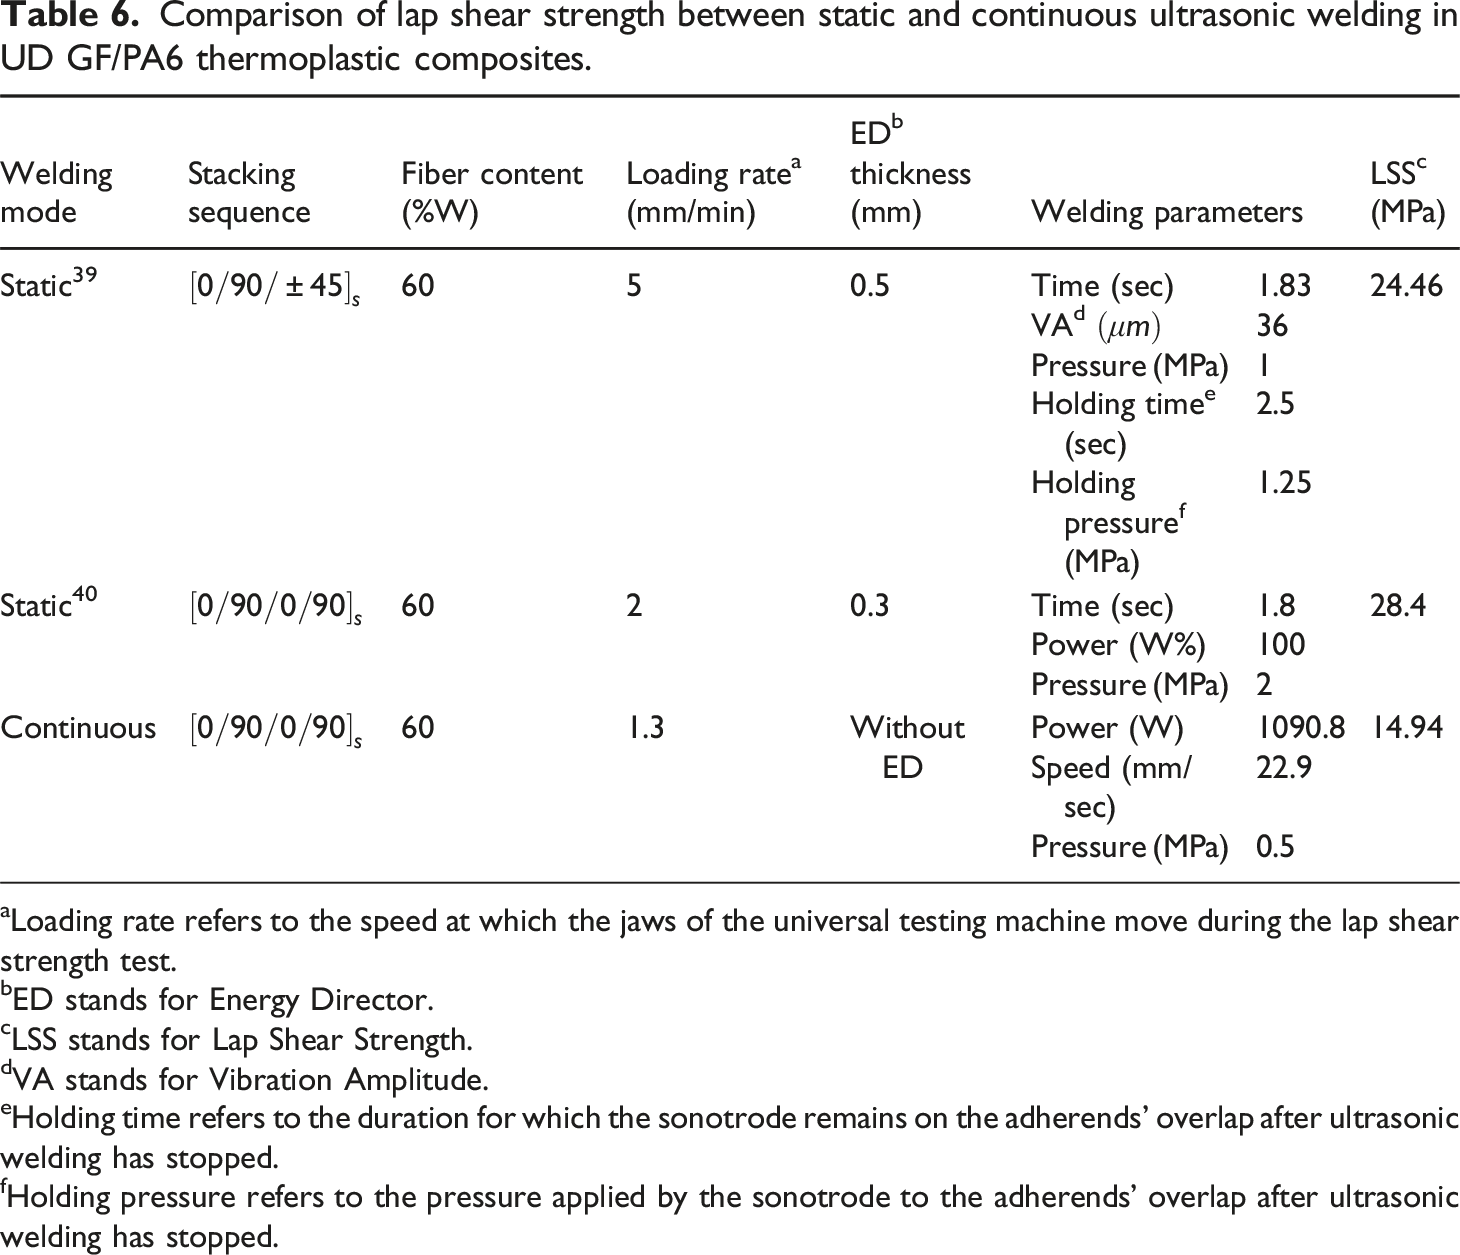
aLoading rate refers to the speed at which the jaws of the universal testing machine move during the lap shear strength test.
bED stands for Energy Director.
cLSS stands for Lap Shear Strength.
dVA stands for Vibration Amplitude.
eHolding time refers to the duration for which the sonotrode remains on the adherends’ overlap after ultrasonic welding has stopped.
fHolding pressure refers to the pressure applied by the sonotrode to the adherends' overlap after ultrasonic welding has stopped.
In the present study, based on optimization performed using the Central Composite Design (CCD) method and microscopic observations aimed at achieving a continuous weld of appropriate quality, continuous welding at the optimal point (power: 1090.8 W, speed: 22.9 mm/s, and welding pressure: 0.5 MPa) without using an energy director resulted in a continuous ultrasonic weld with an average lap shear strength of 14.94 MPa, as shown in Table 6 Regarding the difference in lap shear strength obtained in static and continuous welding modes, the following points should be considered:
The use of energy directors—especially woven mesh energy directors—in ultrasonic welding plays a significant role in increasing the shear strength of lap joints by concentrating viscoelastic heat at the interface between the two adherends. 41 For example, using a woven mesh energy director (PPS100 mesh) with a thickness of 0.2 mm instead of a flat energy director in the continuous welding of woven CF/PPS increased the shear strength from 18.8 MPa to 33.7 MPa. 21 Another important stage in ultrasonic welding is the cooling stage, which can be more effectively controlled in continuous welding by adding a consolidator shoe and adjusting related parameters such as shoe pressure, the distance between the sonotrode and shoe, and the shoe’s dimensions. For instance, Jongbloed et al. increased the weld strength from 15.1 MPa to about 39 MPa in woven CF/PPS composites by incorporating a consolidator shoe into the continuous ultrasonic welding setup. 26 In fact, omitting the consolidator shoe in continuous welding increases the likelihood of void formation due to insufficient consolidation, which consequently results in lower weld strength.
In the present study, the aim was to investigate the effect of the main process parameters—namely welding power, speed, and pressure—and their interactions on weld strength and quality, in order to achieve optimal welding conditions and address the challenges of continuous ultrasonic welding of thermoplastic composites with unidirectional fibers. Therefore, parameters such as the use of an energy director and a consolidator shoe were not included in this study.
Another factor contributing to the difference in strength between static and continuous ultrasonic welding is the fundamental difference in the nature and execution of the two processes. In static welding, the sonotrode remains stationary relative to the overlap of the two samples, whereas in continuous welding, the sonotrode moves relative to the overlapping composite plates. In general, it can be said that in static ultrasonic welding, the composite materials undergo all welding stages sequentially, and the initially unwelded areas gradually transform into welded regions. In contrast, in continuous ultrasonic welding, there is typically a constant competition between the different welding phases that the composite material must undergo. As a result, some unwelded areas may remain fixed at the interface between the two composite plates. 22
Despite achieving useful results in the continuous ultrasonic welding of composite adherends (GF/PA6), issues such as voids along the overlap cross-section of the joint and shear strength of the weld could still be improved. It was observed that the presence of voids along the thickness of the composite adherends in the overlapping area did not lead to early failure or reduced weld strength. One reason for these voids is the polymer matrix being affected by viscoelastic heat produced in layers far from the interface. Moreover, this research was conducted without using an energy director. Using energy director in ultrasonic welding concentrates viscoelastic heat at the interface of the adherends. 42 As a result, less heat reaches layers farther from the interface, preventing unnecessary polymer melting and void formation. The energy director material is usually the same polymer found in the composite matrix, resulting in more molten polymer at the interface, which increases weld strength. 43 Proper consolidation during the cooling stage effectively reduces porosity and voids throughout the thickness of composite sheets.44,45 The use of a pressure shoe as a consolidator after vibration and heating stages in continuous ultrasonic welding, along with optimization of related parameters such as the distance between the shoe and the sonotrode, pressure, and shoe dimensions, plays a significant role in consolidation. This helps reduce voids at the interface and inside the adherends, ultimately increasing the shear strength of the joint. 26
Conclusions
In this research, both the quantitative and qualitative aspects of continuous ultrasonic welding of thermoplastic composites, specifically polyamide 6 reinforced with unidirectional continuous glass fibers (GF/PA6) were studied. In a quantitative study using central composite design (CCD) within the response surface method (RSM), with input parameters of power, speed, and welding pressure, and lap shear strength as the response, a suitable two-factor interaction (2FI) mathematical model ( • The effective factors in the obtained model, in terms of their impact, include power-pressure interaction, power, speed, and speed-pressure interaction, respectively. • The pressure factor and power-speed interaction in continuous ultrasonic welding of GF/PA6 adherends were found to be ineffective, but sufficient pressure is required to spread the polymer chains between the adherends. • When the speed factor is at its center point, with a speed of 20 mm/s, adjusting the pressure at the interface within the range of 0.5–1 MPa results in an increases in shear strength as the welding power rises from approximately 600 to 1200 W. However, when the pressure at the interface is in the range of 1–1.5 MPa due to attenuation of the sonotrode vibrations, increasing the welding power from about 600 to 1200 W causes the weld shear strength to remain almost constant. • When the welding power factor is at its center point, with a power of 900 W, adjusting the pressure at the interface within the range of 0.5–1 MPa leads to an increase in shear strength as the welding speed decreases from about 30 to 10 mm/s. However, when adjusting the pressure at the interface within the range of 1–1.5 MPa due to attenuation of the sonotrode vibrations, reducing the welding speed from about 30 to 10 mm/s results in the weld shear strength remaining almost constant. • In weak welds with a strength of less than 5 MPa, poor penetration and low uniformity lead to island-like areas at the interface. In these weak welds, fibers are not visible on the fracture surface of the samples; as a result, the fibers do not contribute to load-bearing. The dominant failure mechanism of these joints is usually matrix breakage and the presence of numerous voids due to deconsolidation. The most important influence in creating weak welds is the simultaneous setting of the power in the range of 600-900 W, the speed in the range of 20-30 mm/s, and the pressure in the range of 1–1.5 MPa. • Average welds have a strength of 5–10 MPa. Penetration and uniformity of welding are better in average welds compared to weak welds. The presence of polymer and a proportion of fibers on the fracture surface of average welds indicates that the fibers contribute to bearing mechanical loads. The dominant failure mechanism in average welds is usually matrix breakage and debonding. • Strong welds have a strength of 10–15 MPa. The high penetration in these welds provides conditions for the effective integration of fibers and the polymer matrix between the upper and lower adherends. The presence of a large number of pure fibers on the fracture surface of these welds demonstrates the significant role of fibers in bearing mechanical loads. The dominant failure mechanisms in these welds include bundle fiber breakage, debonding, and local peeling of the • Simultaneously setting the welding power within the range of 1000–1200 W and the speed near its lowest limit of 10 mm/s increases the duration of vibrations applied to the molten polymer at the interface, which results in a change in the direction of 0° fibers at the adherend interface. To avoid this issue, when the pressure factor is around 0.5 MPa, setting the welding power to its upper level (1000–1200 W) or adjusting the welding speed to its lower level (10–20 mm/s) is sufficient.
Footnotes
Acknowledgements
The researchers of this article express their gratitude to Dr. Vahid Fartashvand, and Dr. Mohammad Reza Karafi for their assistance.
Author contributions
Mohammad Ali Zamani: Conceptualization, Methodology, Formal analysis, investigation, Resource, Data Curation, Writing – original draft, Writing – review and editing, Visualization, Project administration. Rezvan Abedini: Conceptualization, Resource, Writing – review and editing, Supervision, Project administration, Funding acquisition. Hadi Ghorbani: Conceptualization, Funding acquisition.
Declaration of conflicting interests
The author(s) declared no potential conflicts of interest with respect to the research, authorship, and/or publication of this article.
Funding
The author(s) received no financial support for the research, authorship, and/or publication of this article.
The use of generative AI and AI-assisted technologies in writing
During the preparation of this work the authors used ChatGPT in order to ensure writing is mistake-free. After using this tool/service, the authors reviewed and edited the content as needed and take full responsibility for the content of the publication.
Data Availability Statement
All the data associated with this work is presented in the manuscript.