
Abstract
Color stripping is one of the most convenient ways to rectify the various shade faults occurred during printing or dyeing process of textiles. But, the conventional chemical assisted process poses serious risk of the environmental pollution. Secondly, the chemical recycling of the cellulosic fibers may be disrupted due to the presence of the impurities like colorants, finishes, and the additives in the discarded textiles. So, there is a need to study ways to remove such impurities from the discarded cellulosic textiles in a sustainable manner. This work examines the decolorization of the pigment prints on cellulosic fabrics at pilot scale using an ozone-assisted process. The effect of varying pH, ozone concentration and the treatment time on the decolorization of the pigment prints was optimized using the response surface methodology technique. The effects of ozonation process parameters on the mechanical properties of cellulosic cotton fabric were measured. Decolorization of pigment printed samples was studied with respect to the surface effects by a scanning electron microscopy (SEM), and the chemical removal effects of ozonation treatment were studied using X-ray photoelectron spectroscopy. The possible mechanism regarding the action of ozone for the decolorization is discussed.
Introduction
Pigment printing is one of the oldest and easiest printing methods, which is also simple to apply. Pigment printing accounts for more than 80% of the printed based goods due to merits like ease of near final print at the printing stage itself, versatility, print quality, applicability to almost every kind of fiber or mixture and no washing processes required after fixation.1,2 In pigment printing, binders are used to fix the insoluble pigments onto the fabric surface because pigments do not have any type of bonding with the fibrous polymer.3,4 and without the binder, the pigments can be readily washed away.
Sometimes, misprinted fabrics are found in mass production with digital printing due to unfamiliar errors such as lost or clogged nozzles. Such misprinted fabrics are reused by employing a color stripping process. 5 Similarly, chemical recycling of cotton textiles into regenerated fibers requires removal of impurities like colorants, additives and other finishing agents from the cotton fabric. These impurities may represent major technical hurdles in maintaining the continuity of chemical recycling. Hence it is necessary to study the removal of such impurities from textiles. 6 While studying the color management in the circular economy, researchers have reported the need to study the decolorization of the pigment printed goods since pigment printing is also one of the common ways to color the cellulosic textiles by digital printing or either by the traditional screen printing. 7
It is difficult to remove the phthalocyanine pigments from textiles because they are deposited on textiles with resinuous and binders which fix them firmly and to some extent protect these pigments from attack by chemicals. The removal of phthalocyanine pigment colors from textiles in a substantially complete manner has been achieved by treating them in a formulation containing an aliphatic quaternary compound together with caustic soda and sodium hydrosulfite. Also the process involved high temperature and treatment time. For satisfactory removal a two-step process was found desirable in the patent. 8
Hence, researchers are focusing their attention to find ecofriendly technologies to replace the conventional chemical processes followed in the textile industry.9 –13 Among various alternatives, ozone is an attractive choice due to its high oxidation potential (2.07 V), low pH and temperature used as compared to the conventional chemical based stripping methods. 14 Numerous applications of ozone have been reported in textile wet processing industry such as bleaching of cotton, 15 jute, 16 angora rabbit, 17 and silk. 18 Apart from this, Ozone has also been used to decolorize textile effluents,19 –22 for reduction clearing treatment of disperse dyed polyester,23,24 and also in the color stripping of the reactive dyed textiles.25,26
Experimental design methodology is a good strategy that makes simultaneous variation of all experimental variables feasible. Thanks of the statistical analysis of the generated data, remarkable information is provided on the interactions among the experimental variables. From here, the number of tests and the required time would be reduced, leading to a considerable reduction in the overall required cost.
Box-Behnken experimental design was used to optimize the decolorization of the pigment printed textiles and detailed study was discussed with regards to the effects of various process parameters like pH, ozone dosage, and the treatment time on the overall performance of the decolorization process. The decolorized fabric was characterized in terms of color stripping %, mechanical properties as well as the analytical tests such as scanning electron microscopy (SEM), X-ray photoelectron spectroscopy (XPS).
However, there is no work reported on the ozone application for the decolorization of the pigment printed textiles. In this study, we report for the first time the use of an ozone assisted process at pilot scale for the removal of color from a pigment printed cotton fabric.
Experimental
Materials
A 100% cotton woven fabric (well scoured and bleached quality) of 150 GSM was used throughout the study. UNISPERSE BLUE G, C.I. Pigment Blue 15 from Huntsman, a phthalocyanine pigment was used for the pigment printing experiments (Figure 1).

Structure of C.I. Pigment Blue 15.
UNISPERSE BLUE G pigment (Huntsman); APPRETAN N 9210, an acrylic ester copolymeric binder from Clariant; and LYOPRINT® PT-RV NEW (Huntsman) a thickener were of commercial grade. All of other chemicals namely, sodium hydroxide, phosphoric acid used were of the reagent grade.
Method
The pigment paste was prepared as per the formulation described in Table 1:
Components of the pigment printing paste.

For printing treatment, a Johannes Zimmer Type Magnetic System Laboratory machine was used. Printing speed was 4 m/min. For drying and curing, a Mathis Laboratory finishing line was used and the printed samples were dried and cured at 160°C for 3 min. Printing was applied to rectangular fabrics (10 × 30 cm). A simple and plain rectangular bar design pattern was selected for the printing of the fabric (Refer Figure 2).
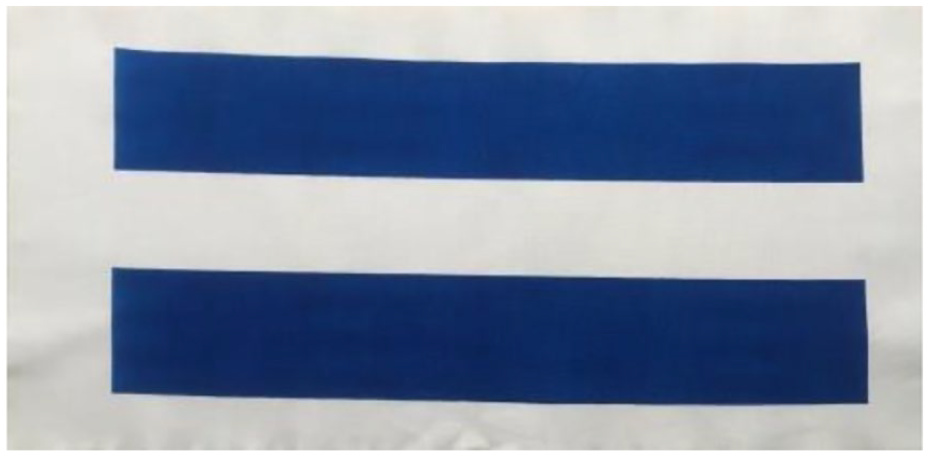
Pigment printed cotton fabric.
Ozone experimental setup
The pilot scale set up consists of the ozonator, which produces ozone gas of the required concentration from pure oxygen (>99.5 wt%, Messer, France) by Corona discharge (Ozat CFS3-2G, Ozonia, France). It also includes an ozone analyzer (BMT, Germany), injection or suction pump and the residual ozone destroyer. Ozone gas was introduced into the reactor by the venturi system. The combined use of a liquid circulation pump and a venturi system allowed, the transfer of the ozone gas to the treatment liquid. The flow rate of ozone gas was 0.3 Nm3/h, and the flow rate of the water pump was set to 2 m3/h in the reactor assembly for all experiments. Figure 3 shows the experimental set-up for ozone treatment used. 25

Pilot ozonation (1: ozone generator; 2: ozone analyzer; 3: venturi injection system; 4: circulation pump; 5: filter; 6: dissolved ozone analyzer and pH meter). 25
Procedure for ozone treatment of pigment printed cotton
A total of 34 g of pigment printed cellulosic textile (two slides of A4 size) was placed in the ozonation reactor. The decolorization process was configured by varying the process parameters such as pH values (3, 5, and 7), ozone concentration (40, 100, 160 g/Nm3 ozone) and ozone exposure times (20, 70, 120 min). The pH of the ozonation treatment was adjusted using the various concentrations of sodium hydroxide and/or phosphoric acid (laboratory grade). Reverse osmosis water was used for all the experiments and the total volume of liquor used was 30 l for each experiment. After the completion of the ozonation treatment all the samples were rinsed with cold water and then air dried.
Characterization
Color stripping (%) measurements
The determination of the color intensity (K/S value) on the printed and the color stripped cotton fabrics were carried out using a Konica Minolta CM3600d spectrophotometer (Konica Minolta Inc., Tokyo, Japan). The K/S values for the printed and color stripped cotton fabrics were evaluated based on the Kubelka–Munk equation 27 at maximum absorption wavelength (λmax = 580 nm) of the pigment. For the color stripped samples, the K/S values were measured at 10 different places on each sample and the average K/S value was determined. The color stripping percentage was calculated using the following formula 28 :

Figure 4 shows the K/S spectral curve of the printed cotton fabric with a main peak at 580 nm and two other peaks at 360 and 680 nm, respectively.

K/S spectrum of the blue pigment printed fabric.
Color analysis by the CIELAB method
The CIELAB method was applied to analyze the color of the decolorized samples. The CIELAB color space also known as CIE L*a*b* was defined by the International Commission on Illumination (CIE) in 1976. In the color space CIELAB, L* corresponds for the lightness (100 = white, 0 = black), a* to the red-green coordinate from (negative sign = green, positive sign = red) and b* to the yellow-blue coordinate from (negative sign = blue, positive sign = yellow). 25
Tensile strength testing
Tensile strength properties were evaluated using a MTS Criterion Model 43 automated testing system according to the International standard NF EN ISO 13934-1; 2013. The tensile properties were calculated only in one direction (warp wise). The mechanical properties of the treated and untreated textile fabric were obtained by repetition of the test atleast five times and the average values were taken.
Surface analysis using SEM. The changes in the surface morphology of selected fabric samples, was observed using the scanning electron microscope (SEM) Model JEOL JEM-1400 Plus, Japan. Before the measurements, all the samples were coated with carbon on JEOL JEE-4X vacuum evaporator for 5 min.
XPS analysis. All the samples were analysed with a Kratos Axis ultra DLD instrument, equipped with an Al Kα monocromatized X-ray source. The analysed area for each sample was about 700 × 300 µm.
Box-Behnken design for experimental plan
To optimize the process conditions for color stripping by ozone, to examine the effects of combined conditions (pH, Ozone content, and reaction time) and to better understand how co-effects influence the quality of the end-product especially in the color stripping and the tensile strength loss, a statistical model can be applied. Response surface methodology (RSM) is a powerful approach that can be handled to test several parameters employing a minimum number of experimental trials. Generally, it includes a collection of mathematical and statistical procedures that are operated to build an experimental design that can analyze the effects of parameters on the response variable to determine the optimized response. In this work, the Box-Behnken design (BBD), a RSM method, was used for the optimization of process variables because it is very advantageous and efficient. It can determine the factors of the quadratic model, detect lack of fit of the model, and looks more desirable if the points are at the midpoints of edges of the process and at the center. Therefore, in the present investigation, the main purpose was to optimize the color stripping of printed cotton to access the effect of process conditions (pH, ozone content, and reaction time) in conserving the mechanical characteristics. A series of experiments were carried out with values of these three variables (pH; ozone content and reaction time) included in the suitable range (lower, middle, and upper levers) (Table 2).
Range and levels of parameter in Box-Behnken experimental design.

Some variables such as pH, the ozone concentration and reaction time which could affect the color stripping efficiency were selected to be investigated by a Box-Behnken design. The responses can be modeled by a second-order polynomial equation as the following equation:

Where Y is the color stripping percent as a function of x1 (pH), x2 (concentration of ozone) and x3 (reaction time) variables. a0 is the intercept, a1, a2, a3 to a11; a22 and a33 are the regression coefficients.
The number of experiments (N) based on the color stripping by ozone is defined by the following expression:

Where K denotes the number of variables and C0 denotes the number of replication at the center point. In this study, K and C0 were set at 3 and 4, respectively. Hence, 16 experiments had to be done to perform a Box-Behnken design.29,30 The levels of each variable are listed in the Table 2.
Y represents the predicted response, a0 is the constant term, ai is the linear coefficient, aii is the quadratic coefficient, and aij is the interaction coefficient. A statistical analysis of variance (ANOVA) based on Box-Behnken design was performed using Design Expert to determine the fitness, suitability, and significance of the model coefficient. It is important to bring off ANOVA to examine the significance and the fit of the second-order polynomial equation. Various statistical parameters provided by Linear Regression and Solver Function of Excels of Microsoft Office (ANOVA), lack of fit test, and multiple determination coefficients (R 2 ) test, were used to determine the model significance. An F-test was also applied to determine the significance of the effects. The F test was used to compare statistical models that have been fitted to a data set in order to identify the model that gives the best fit to the population from which the data were obtained.
Box-Behnken design is a cubic, independent quadratic and rotatable design, with the treatment combinations at the midpoints of the edges of a multidimensional cube without embedded factorial or fractional factorial design and is used for fitting second-order response surfaces. The Box-Behnken matrix design for the experimental plan of our decolorization experiments is as per Table 3.
Box-Behnken matrix used.

Results
Evaluation of color stripping of the printed fabrics treated with different experiments (E1–E16)
The Figure 5 show the K/S spectral curves of the fabrics decolorized using the 16 different experimental conditions of ozone treatment. It can be observed that with the variation in the experimental conditions performed, we can see a substantial decrease in the K/S values and hence an enhancement of the decolorization.
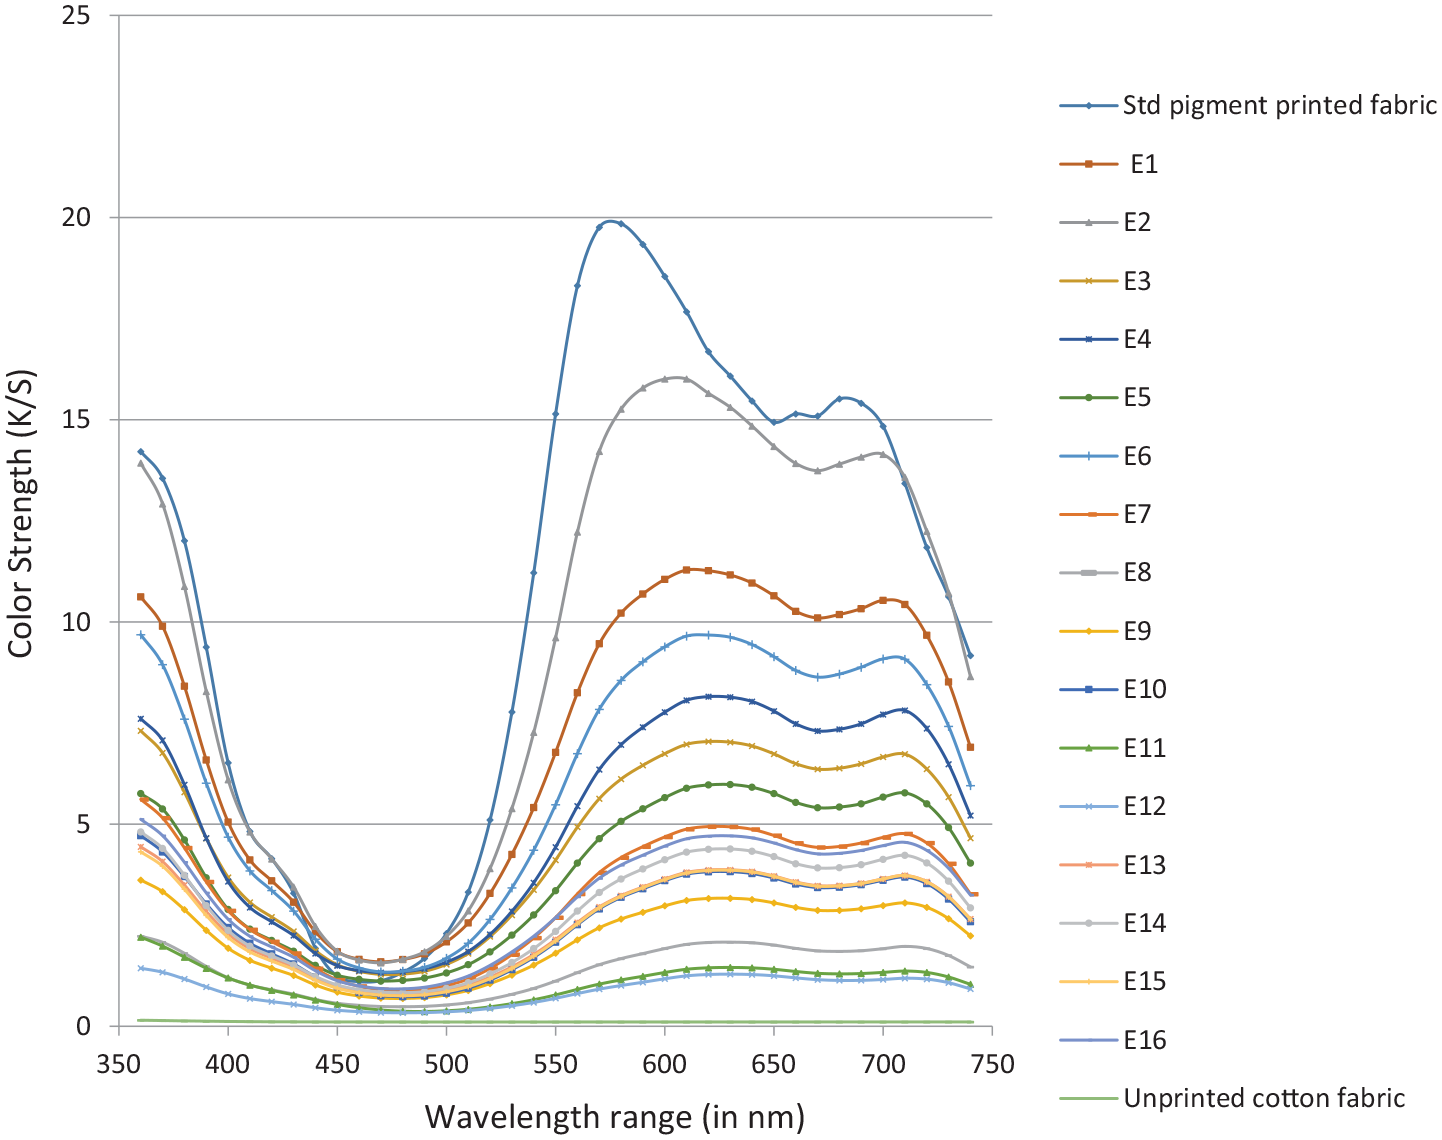
K/S versus Wavelength graph for all the color removal experiments carried with ozone under varying conditions.
For the experiments (E1–E7), it can be seen that the K/S values at maximum absorbance wavelength(580 nm) is still higher, with the K/S values still greater than 4 and the decolorized samples are still blue (Figure 5 E2, E4, E7). Smaller quantities of ozone concentration along with lower treatment time or higher pH value are not sufficient to obtain a good color stripping.
The K/S values at 360 nm of the stripped samples are between 0.5 and 13.9, which are higher than that of the unprinted cotton sample (K/S = 0.15) but not that lower than the pigment printed reference sample (K/S = 14). This could be related to the presence of degraded pigment molecule. Similar trend was observed for K/S values at 680 nm. The results and experimental conditions show that the complete color removal from pigment printed goods is not easy and requires the use of process conditions involving acidic pH, huge ozone concentration and longer treatment times. The same can be observed through the photograph swatches of the ozone treated samples: it is difficult to obtain clear white fabric even after the extreme conditions of ozonation process (Figure 6).

Images of the small swatch of the standard printed fabric and the ozone assisted treatment samples with the (selected) various experimental parameters: (a) Standard printed fabric, (b) E2, (c) E4, (d) E7, (e) E8, (f) E11, (g) E12, and (h) E16.
Color analysis of the color stripping samples
Sample photographs in Figure 6 show, the color stripping results obtained for parameters selected in the designed experimental plan.
The CIE Lab methodology was additionally used to carry out a colorimetric analysis of all fabric samples (Table 4).
Colorimetric values (L*, a*, b*, dE*) for the printed, unprinted cotton and stripped printed cotton subjected to color stripping experiments E2, E4, E7, E8, E11, E12, E16.

Referring to the results listed in (Table 3), it can be clearly observed that the L* values are higher in case of experiment E12 as compared to experiments E2 and E4, and the standard fabric, which confirms that the shade of the fabric is getting lighter. However, the a* values are not closer to that of the unprinted fabric and the fabric turns out to be more on the greener side. Similar observation was found in case of b* values, which corresponds to the fabric getting less bluer as compared to the pigment printed fabric. When stripped samples subjected to selected experiments (E8, E11, and E12) are compared to the unprinted cotton fabric, it can be seen that there is still some part of degraded pigment present on the fabric.
Box-Behnken results and optimization
The result analytics of characteristics of printed textile including the Color stripping (%) and Tensile strength loss (%) may vary depending on the operating conditions, such as pH, ozone concentration and reaction time. In this study, the effect of pH, ozone concentration and reaction time were evaluated using linear regression and Solver Functions in the Microsoft Office Excel. A three-factor three level Box-Behnken experimental design was utilized to investigate the correlation between the combined effects of the individual parameters and both the responses.
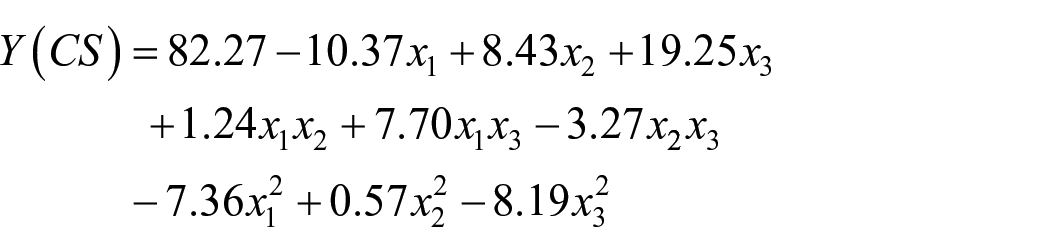
In Table 5, the Box-Behnken matrix, the experimental results from all the tested combinations of factors and the corresponding responses for each run are polynomial equations obtained showing the empirical relationships between the responses and the independent variables in terms of coded factors for both Color Stripping (CS) and Tensile Strength Loss (TSL).
Box-Behnken matrix and the experimental results.

For the designed experimental model, the color stripping percentage was calculated and the tensile strength was measured along with the coefficient of variation determined for both the parameters (Table 5). We can see the effects of different process parameters on the decolorization of the pigment printed goods. However, there is deviation in the results obtained which may be attributed to the heterogeneity of the treatment. It can be observed that there is decrease in the tensile strength with an increase in color stripping.
The responses modeled by second-order polynomial equations have the following particular forms:
For the Color Stripping (CS):
For the Tensile Strength Loss (TSL):

Where x1 is the pH of the aqueous solution, x2 is ozone concentration and x3 is reaction time. The highest value of color stripping was obtained at pH 3; ozone concentration of 100 g/Nm3 and reaction time of 120 min.
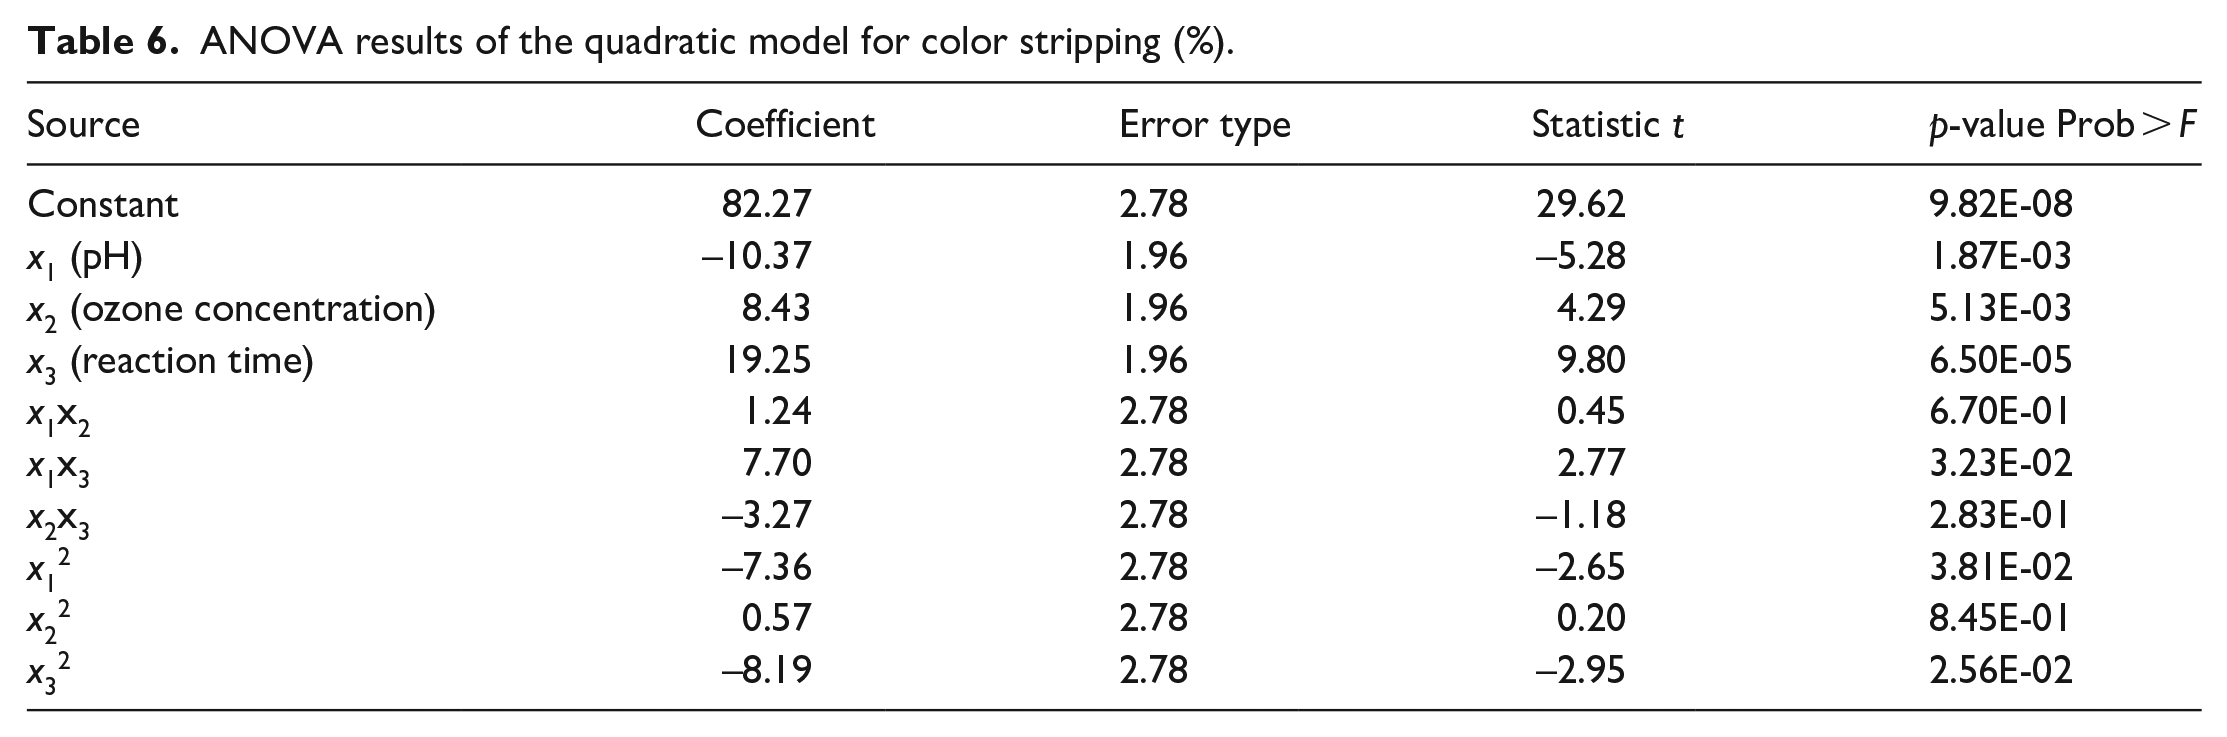
ANOVA based on the Box-Behnken design was performed with Functional Objective to check the fitness and significance of the model coefficient. The ANOVA results for the responses of the optimized Color Stripping and Tensile Strength Loss are, respectively, summarized in Tables 6 and 7 respectively.
ANOVA results of the quadratic model for color stripping (%).
ANOVA results of the quadratic model for tensile strength loss (%).

When analyzing ANOVA results, a large value of F with a small value of p (i.e. p < 0.05) show that the model is statistically significant. Among the ANOVA results reported in Tables 6 and 7, the (Prof > F) value was found to be <0.05 for the Color Stripping and Tensile Strength Loss, with F value of 18.60 and 12.37, respectively, indicating a significant model fit. The F-test gave a low probability value, which also indicated the high significance of the model for both response. Moreover, the high coefficients of determination (R2) of 0.965 and 0.949 for the Color Stripping and Tensile Strength Loss responses further indicated a good correlation between the measured and predicted responses.
In this study, the independent parameters of pH (x1), ozone concentration (x2) and reaction time (x3), interaction effect between the pH and reaction time (x1x3) and the second-order effect of pH (x12), reaction time (x32), were significant parameters for the response of Color Stripping with p-value < 0.05, as shown in the Table 5. Regarding the Tensile Strength Loss response, the ozone concentration (x2) and reaction time (x3), were highly significant parameters. However, the rest of the terms did not show any significant impact.
Response surface result analysis
From the response surface plots A, B, and C in Figure 7, it can be seen that the pH of the ozonation process had a considerable impact on the decolorization of the pigment printed goods. As seen in the response surface plots, the acidic pH range showed good results in terms of the decolorization while the neutral pH showed adverse effects on the decolorization. Also the ozone concentration and the treatment time are important favorable conditions for the maximum decolorization. Severe process conditions like acidic pH, higher ozone concentration and higher reaction time were required for the efficient decolorization of the pigment printed goods.
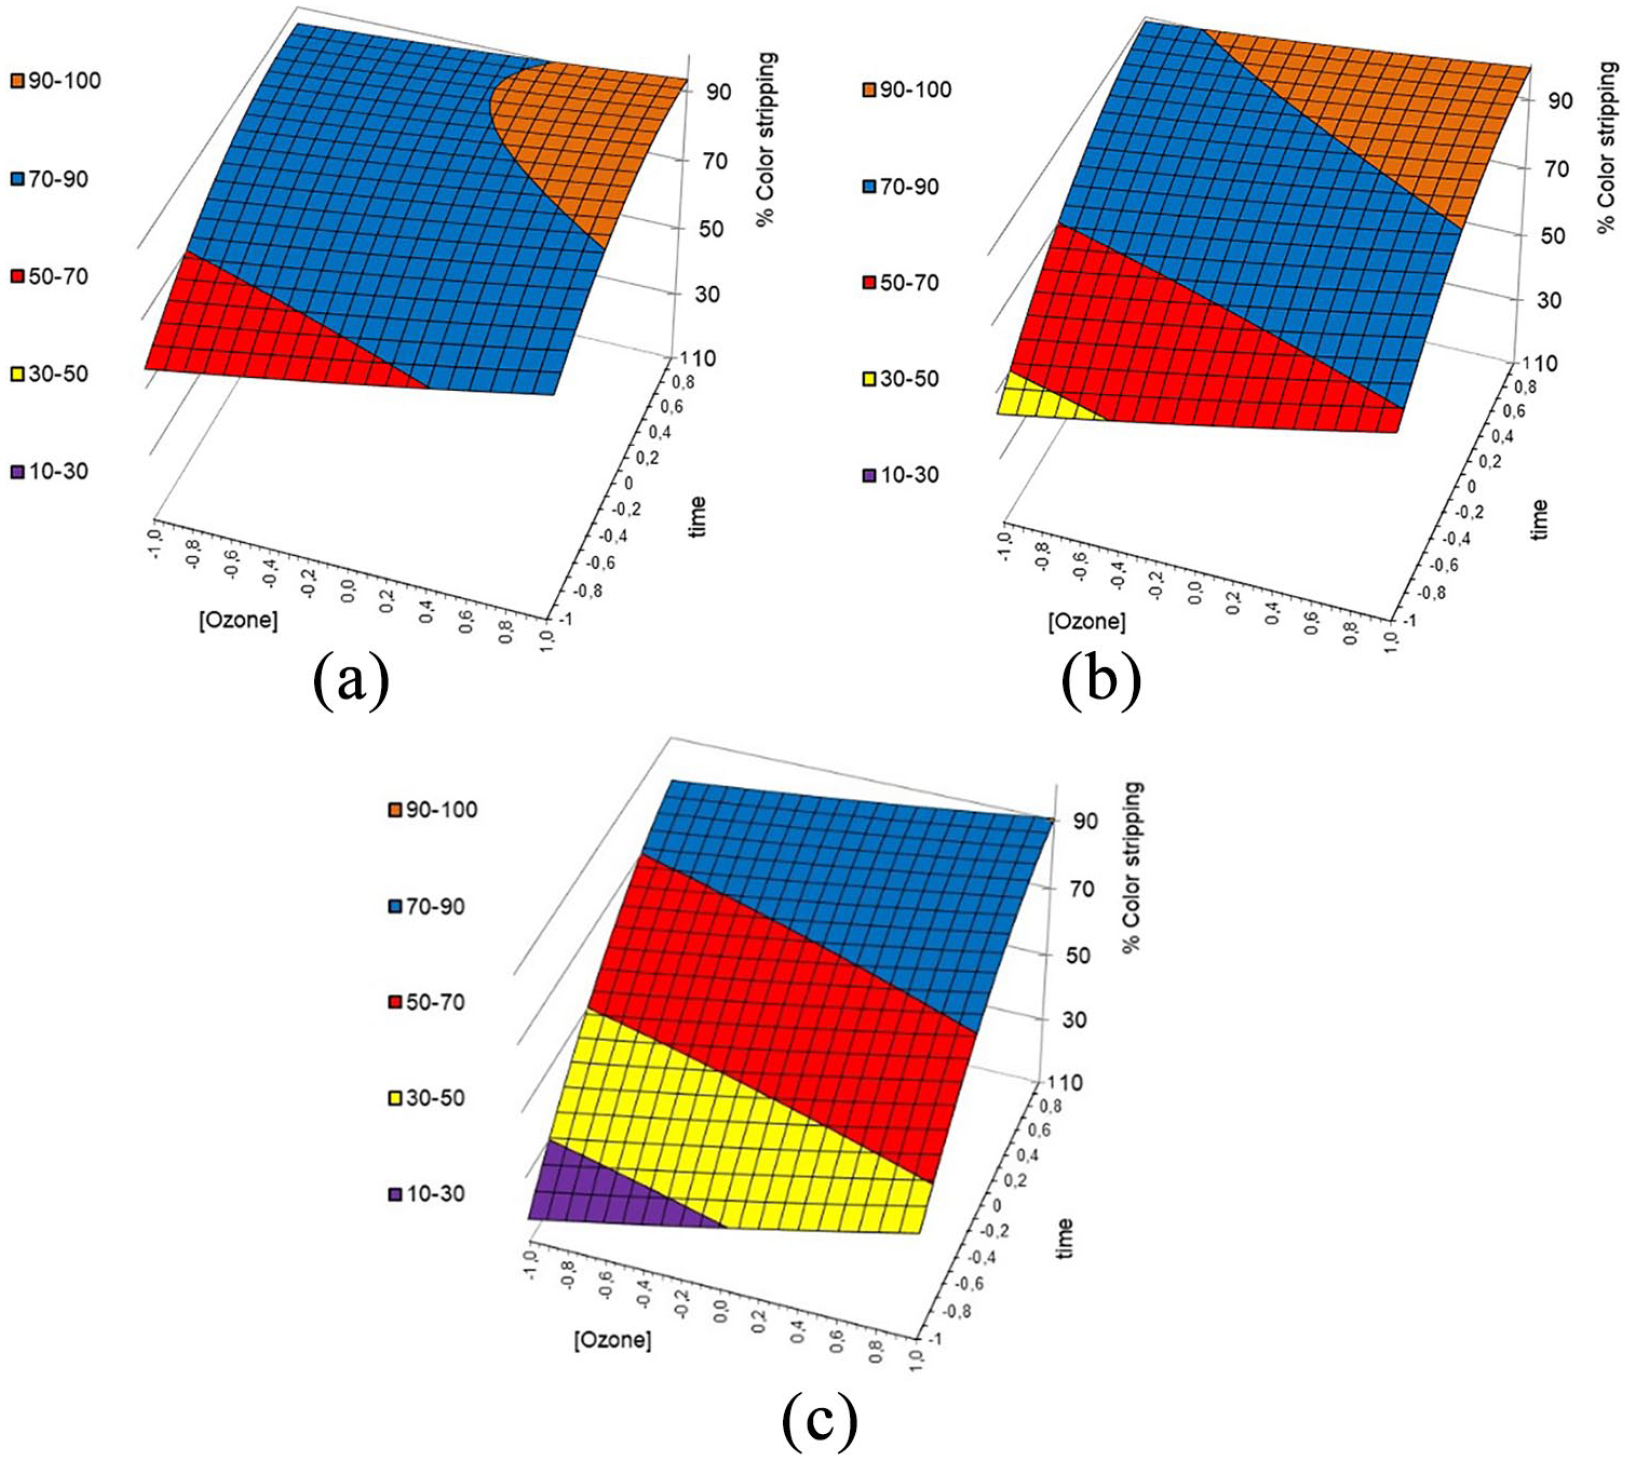
3D response surface diagrams showing the effects of ozone concentration and treatment time on the color stripping of the pigment goods at different pH values.(color of the graphs are related to color stripping %): (a) pH 3, (b) pH 5, and (c) pH 7.
From the response surfaces A, B and C in Figure 8, shows that the mechanical properties like tensile strength loss increased with an increase in all the process parameters (ozone concentration, and time).

3D response surface diagrams showing the effect of pH, [O3], and reaction time on the tensile strength loss %: (a) pH = 3, (b) pH = 5, and (c) pH = 7.
Optimized process conditions and validation of model
Based on the Color Stripping (CS) and for the Tensile Strength Loss (TSL) the responses modeled by second-order polynomial equations have been presented before. Thanks of Solver function in Excel, the optimal value or operating’s parameters were found targeting maximum Color Stripping and minimum of Tensile Strength Loss for a formula in one cell called the objective cell, subjected to certain constraints of limits, (e.g. x1 < 1; x1 > –1 it means that the pH is between 3 and 7, x2 < 1; x2 > –1 it means that the ozone concentration is between 40 and 160 g/Nm3 and x3 < 1; x3 > –1 it means that the reaction time is between 20 and 120 min). The weight of CS and TSL were taken part in 50%/50%. This means that the Solver works with a group of cells called decision variables that were used in computing the formulas in the objective and constraint cells. Solver adjusts the values in the decision variable cells to satisfy the limits on constraint cells and produces the waiting results for the objective cell.
If the conditions; Color Stripping must be greater than 80%; and Tensile Strength Loss must be lower than 20% are set up, then the optimal conditions are pH 4, with ozone concentration 40 gO3/Nm3; and reaction time: 102 min.
Characterization of the stripped fabrics
In this study, the pigment printed samples subjected to the different ozonation process parameters were chosen as the representative fabrics to study the decolorization phenomenon. In addition to that, pigment printed fabric and blank cotton fabric were selected as reference to study the effect of ozone on the decolorization process (Table 8).
Selected samples for characterization.

SEM Images
Figure 9 shows SEM images of ozone treated samples compared with the untreated blank cotton and pigment printed cotton. SEM micrograph of unprinted cotton fabric shows the clear surface. When we look at the SEM image of the pigment printed cotton fabric, it can be clearly observed that the fibers are coated with a polymeric binder film, which helps in the binding and fixation of the pigment particles onto the fabric samples. SEM micrographs of the decolorized samples with various ozonation process conditions, confirmed the presence of the binder deposition on the fiber surface of the printed samples. This shows that even after extreme ozonation it is difficult to remove the polymeric binder coating from the pigment printed fabric.
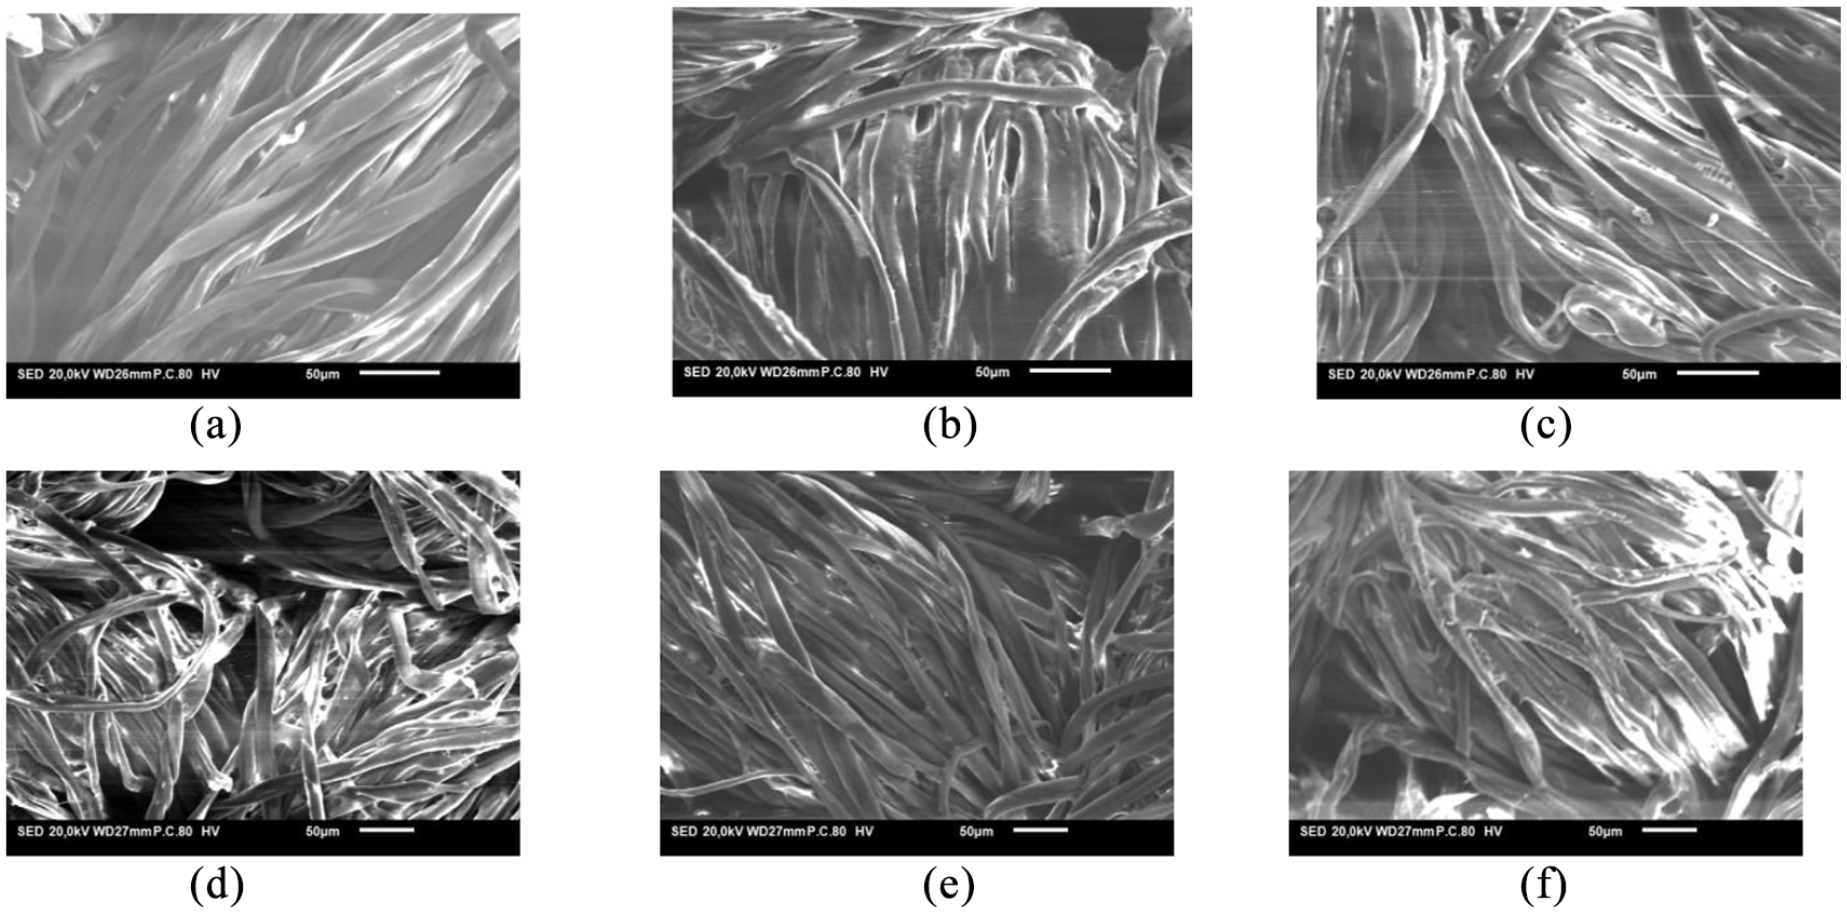
SEM micrographs before and after ozone treatment. The scale bar of the images is 50 µm: (a) blank fabric, (b) pigment printed fabric, (c) sample treated E11, (d) sample treated E12, (e) sample treated E13, and (f) sample treated E2.
XPS analysis to study the surface chemistry
On the survey XPS spectra, four peaks are observed corresponding to the electrons C1s of the C atoms (285/290 eV), O1s of O atoms (531/536 eV), to N1s of N atoms (398 eV), to Cu2p3/2 of Cu atoms (932/935 eV). The percentage of each species is calculated by the percent area of each peak (Table 9).
XPS spectra for selected samples with Surface elemental composition.

During the ozone treatment for the selected samples, the oxygen content increases due to the oxidation processes that occurs in presence of ozone. This treatment breaks the covalent bonds of the binder and the pigment, while introducing oxygen in the chain.
Copper and Nitrogen atoms are attributed to the pigments, thus there is a very small amount of those species and the XPS is not very accurate. However, it is obvious that the ozonation treatment decreases the amount of Copper and Nitrogen. This could be attributed either to the removal of the pigment due to chain scissions of the acrylic binder or to the oxidation of the pigment molecule by the ozonation treatment. Bigambo et al. 31 have studied the effect of oxidative bleaching on the reactive dyed goods which is in line with results observed in our study.
Although the discoloration of the sample is very weak (23.1%) with the E2 treatment at pH 7 the degree of oxidation seems similar to that observed with the E13 treatment at pH 5 and longer time with better results of color stripping (83.7%). It can also be observed that E11 and E12 experiments result in identical stripping, while the O3 amount is much higher with E11. This could be attributed to the complete removal of the copper during E12 experiment. Again, the effect of the acidic pH for this experiment could be one explanation. As a conclusion, the XPS results confirm the interest of ozonation at lower pH, with a preferential oxidation of the pigment and a better discoloration of the samples.
Discussion
Oxidation by ozone is considered to be a powerful technique for decolorization of the reactive dyes by the destruction of the chromophoric system. There may be occurrence of two possible reaction mechanisms: direct reaction involving molecular ozone attack and the indirect reaction consisting of the free radical mechanism. Both of these reaction mechanisms have been found to exist simultaneously during the ozonation reaction process. 32
Recent studies for color removal from pigment wastewater have demonstrated 90% color removal using the ozone. The ozone dosage for color removal from pigment waste water was higher (4–5 times) than the dye waste water so as to obtain the same color removal efficiency using identical conditions. The high dosage of ozone required is probably explained by the presence of the low nucleophilic chromophores of the color imparting organics in the pigment waste water and the higher alkalinity. 33 The color removal in pigment printed goods is in agreement with this study of color removal from the pigment waste water, we were able to achieve the decolorization of about 90% and more, but the process conditions deployed were harsh (huge ozone concentration and treatment time; acidic pH range). May be due to the cross-linking of the binder at the fabric surface.
Studies on the decolorization of the pigment wastewater with ozone have shown that 85% decolorization rate was achieved. 34 Ozonation was more successful at low pH (pigment dissolved in H2SO4, pH < 1), than at higher pH (pigment dissolved in ethanol, pH = 6). The reason could be related to the unselective hydroxyl groups caused by higher pH or poor solubility.19,34 –38 Also, the studies have shown that the decolorization rate increases with the increase in the ozone dose. This study assumes the possibility of the complete decolorization of the Pigment Blue 15 could be carried out with the higher amount of the ozone dosages.34,39 However, the experimental conditions (e.g. the Pigment Blue 15 dissolved in concentrated H2SO4), were based on unrealistic scenarios and impossible for practical applications. 34
Considering the decolorization efficiency, lower pH values were often more efficient, the reason being selective direct ozone reactions targeting chromophoric bonds in the colored materials. 40
In a study related to the bleaching of cotton fabrics with ozone, highest DP loss was observed in case of ozone bleached fabrics as compared to the treatment with sodium hypochlorite and hydrogen peroxide. Also, it was found that in case of ozone bleaching, the DP of cotton was decreased largely based on the pH of the fabric. Hydrocellulose starts to form with an increase in the acidity of the fabrics and hence the DP decreases. Likewise, decrease in the DP values, the physical properties of fabrics like breaking strengths were also found to be decreased at the neutral and acidic pH values. 15 While discussing the use of ozone in the textile industry, the author has stated that the strength loss is very high in the case of ozonated fabric, and research to minimize the damage due to the ozone are continued. 41 While studying the parameters affecting dry and wet ozone bleaching of denim fabric, it was found that ozone slightly damaged the denim fabrics by reducing the tensile strength. Moreover, the ultimate tensile strengths decreased with an increase in the ozone concentration and the treatment time. The loss in the strength could be attributed to the damage induced by the ozone due to the hydrolysis of the glycosidic bonds. 42 In our case, similar results were obtained with respect to the losses in mechanical properties of the printed goods.
There is a hypothesis in our study which may suggest that the main reaction of decolorization of the pigment printed goods occurred via oxidation of the binder with chain breaks (degradation) – so it allowed pigments to be removed - almost partially.
Conclusion
This paper proposes an ozone assisted process for the decolorization of the pigment printed cellulosic textiles. Trials were performed with the selected pigment (C.I. Pigment Blue 15) printed fabric based on the copper phthalocyanine chemistry. The results indicate that with the current experimental conditions, pH 5, ozone concentration of 100 gO3/Nm3 and the exposure time of 120 min yielded the best decolorization results. Decolorization of 90% and above was obtained for the samples with ozone treatment time of 120 min at acidic pH range. The current experimental investigation indicates that this Ozone based process has potential to be proposed for the industrial scale up in the textile industry and it would be interesting to propose this study on a wide range of pigment dyed/printed goods for decolorization. SEM analysis suggests that it is not easy to remove the binder film and/or pigment decolorization completely. XPS analysis reveals the decolorization of the pigments with the oxidative ozone treatment. Further studies need to be implemented to enhance the process for complete removal of the pigment, it would also be interesting to investigate the pigment stripped fabric for chemical recycling of textiles. In the current study we have focused on the decolorization of only one pigment type CI Pigment Blue 15. It would be interesting to apply this decolorization technique to a wider range of pigment colorants and observe their behavior since each colorant has its individual characteristics and has to be separately evaluated.
Footnotes
Acknowledgements
The authors would sincerely thank the UniLaSalle, Beauvais platform for their help and support in the ozone experiments. The author would like to acknowledge Christian Catel from GEMTex Lab at ENSAIT (France) for his help in the laboratory experiments.
Declaration of conflicting interests
The author(s) declared no potential conflicts of interest with respect to the research, authorship, and/or publication of this article.
Funding
The author(s) disclosed receipt of the following financial support for the research, authorship, and/or publication of this article: This research has been conducted in the framework of Erasmus Mundus Joint Doctorate Project – Sustainable Management and Design for Textiles (SMDTex), which is financed by the European Commission.