
Abstract
The Leaves Pruna Cerasefera (LPC) was developed for the adsorption of Basic Fuchsin (BF) from its aqueous solution. LPC with a specific surface area of 22 m2/g was characterized by the BET surface area, Fourier transform infrared spectroscopy (FTIR), and pH of zero point charge pHpzc (=6.80). The adsorptive properties of LPC with BF was conducted at variable stirring speed (100–1000 rpm), adsorbent dose (2–16 g/L), solution pH (2–10), initial BF concentrations (100–200 mg/L), contact time (0–60 min), and temperature (295–313 K) using batch mode operation to find the optimal conditions for a maximum adsorption. The adsorption mechanism of BF onto LPC was studied using the first pseudo order and second pseudo order kinetic models. The BF elimination was found to follow a pseudo-second order kinetic model with a determination coefficient (R2) of 0.999. The experimental data were fitted to Langmuir, Freundlich, Temkin, and Elovich isotherms, and the equilibrium behavior explained by the Langmuir model provides the best correlation (qmax = 158.73 mg/g, R2 = 0.999 at 25°C). The effect of adsorption at different temperatures have been studied for the determination of thermodynamic parameters, that is, the free energy (ΔG° = −5.4437 to −4.5879 kJ/mol), enthalpy (ΔH° = −19.469 kJ/mol), and entropy (ΔS° = −0.4554 kJ/mol K). The negative values of ΔG° and ΔH° values that the overall adsorption is spontaneous and exothermic in nature. Our work has a dual environmental aspect; on the one hand the valorization of a natural by-product namely LPC, and on the other hand, the elimination of BF from aqueous solutions. The present adsorbent may be considered as an alternative adsorbent for the better performance of the BF removal from its aqueous medium.
Introduction
The environmental protection has become a major concern of our society; it has motivated many studies on the reduction of the factors responsible of the pollution, and encouraged the growing research for the improvement of depollution methods. Nowadays, the world consumes large amounts of water, for both domestic and industrial use, leading consequently to its contamination by various elements (solid particles, bacteria, organic and mineral molecules, etc.). Once used, water is released into the natural medium, despite the development of the practice of reuse. However, direct landfills into the environment must be prevented due to the impact of pollution contained in water on the receiving environment (fauna and flora) and human health. The water contamination is currently encountered in the third world and requires urgent solutions. The aquatic environment is the favorable site for receiving complicated human and industrial wastes, thus causing increasing pollution, threatening both the natural environment and human health. 1 The pollutants existing in water are of various origins, classified into suspended elements, mineral solutes and organic solutes, dissolved gases, and microorganisms. 2 Although most of them can be eliminated by conventional methods, the concentration of toxic substances remaining in water after treatment in many cases exceed the permissible limits required by the World Health Organization. 3 They are mainly organic substances among which the dyes, released by the textile industry and responsible for the toxicity, odor, unpleasant taste, and color of water, thus causing the degradation of water quality and subsequent disappearance of aquatic life. Hence, we need to treat colored effluents before being discharged into the environment.4,5 Basic Fuchsin (BF) is extensively used in the textile for dying cotton, wool, silk, nylon, in manufacture of printing inks as well as in biological stains and dermatological agents in veterinary medicine. 6 BF inhibits the growth of algae and small crustaceans forum concentrations as low as than 1 and 20 mg/L respectively7,8 and can be absorbed by the skin causing irritation and harmful by inhalation and ingestion. In extreme cases, it can lead to kidney failure and severe eye irritation with permanent blindness. 9 The processes available for treating colored wastewaters include: cation exchange membranes, photocatalytic degradation,10,11 sonochemical degradation, electrochemical degradation, micellar enhanced ultra-filtration, solar photo-Fenton and biological processes, Fenton-biological treatment scheme, adsorption/precipitation processes, and adsorption12 –19 on activated carbon.12,20 –23 Despite their effectiveness, some of these techniques are restricted by some limitations such as excess amounts of chemical usage, accumulation of concentrated sludge with serious disposal problems, and lack of effective color reduction. 24 In this regard, the adsorption is one of the most effective treatments for the wastewaters that industries employ to eliminate hazardous pollutants present in the effluents. This is a well-known and superior technique to other alternatives for the dyes removal due to initial cost, operating conditions, and simplicity of design.25 –30
In this study, it was necessary to understand how the Basic Fuchsine interacts with the adsorbent during the discoloration and to describe the potential processes involved in these interactions. For this purpose, we carried out a parametric study of the adsorption, by studying the effect of several significant parameters on the decolorizing power of the material. Therefore, the main objectives of this contribution are summarized as follows:
The preparation of a new adsorbent at low cost from “Leaves Prunus Cerasefera” (LPC) for the elimination of Basic Fuchsin by adsorption in batch mode.
Develop the porosity of this adsorbent by both chemical and physical activations and show that this adsorbent can constitute a support for the water treatment.
Possibility to switch from batch mode to column mode.
Carrying out tests on an industrial scale and regeneration of the adsorbent for reuse.
Carrying out tests by photocatalysis in the presence of adsorbent/semiconductor hybrid catalysts.
Experimental
Preparation of dye solution
The basic Fuchsin (BF, 88% purity), used in this study, was supplied by Sigma-Aldrich Company. Its chemical formula, molecular weight and color index (CI) are: C20H20ClN3, 337.5 g/mol, and 42,510 respectively and the characteristic are illustrated in Table 1. BF was used as supplied without any further purification; the stock solution (1000 mg/L) was prepared and the BF solutions used for the experiments were prepared by dilution. The concentration of BF was titrated at the maximal wave length (λmax = 540 nm), using UV–Visible spectrophotometer (UV 2300), by linear interpolation of the calibration graph.
Characteristics of basic fuchsin.

Preparation of the biosorbent
The biosorbent was prepared according to the experimental protocol developed previously in our laboratory. 31 The leaves of the plant were washed 10 times with distilled water. Then, they were dried under solar irradiance for 3 days followed by a treatment at 60°C for 24 h in an air oven. After drying, the materials were sieved on a Retsch 5657 HAAN 1, Vibro type device with a diameter <0.071 mm because it has the finest particle size. Finally, the biosorbent was kept in airtight containers placed in desiccators until use.
Characterization of the prepared biosorbent (LPC)
The FTIR spectroscopy (type L160000A) was used to identify the characteristic functional groups of the adsorbent. Five milligram of LPC was mixed with spectroscopic grade KBr and pressed under a pressure of 4500 psi to form thin discs. Then, the spectra were plotted with a Perkin Elmer 2000 infrared spectrometer; the sample was scanned from 400 to 4000 cm−1 for 16 times to increase the signal to noise ratio.
- The zero point charge pHpzc of LPC, that is, the pH for which the surface charge is zero, was determined using a procedure similar to that described elsewhere. 32 Fifty milliliter of a NaCl solutions (0.01 M) were placed in stopper bottles, the pH was adjusted from 2 to 12 by addition of HCl or NaOH solution; then 0.15 g of LPC was added to the NaCl solutions. After 48 h of stirring at room temperature, the final pH was measured and plotted against the initial pH. The pH corresponding to the point of intersection with the line pH (final) = pH (initial) corresponds to pHPZC of LPC.
- The specific surface area was determined on a volumetric adsorption analyzer at 77 K. The sample was degassed under vacuum at 573 K overnight before the measurement. The surface area of the biosorbent was determined by the BET method using an AsiQuin, Automated Gas Sorption Analyser Quantachrome Instrument (Version 2.02). The specific surface area and pore structure of the biosorbent were characterized by N2 adsorption-desorption isotherms at 77 K using the ASAP 2010 Micromeritics equipment.
Kinetic study
The effects of the initial BF concentration Co (100–200 mg/L), solution pH (2–14), adsorbent dose (2–16 g/L), agitation speed (100–1000 rpm), and temperature (295–313 K) on the BF adsorption were investigated in batch mode for variable specific periods (0–60 min). For the kinetic studies, desired quantities of LPC were contacted with 10 mL of BF solutions in Erlenmeyer flasks and placed on a rotary shaker at 400 rpm, the aliquots were regularly withdrawn and vigorously centrifuged (3000 rpm, 10 min). The remaining BF concentration was analyzed by linear interpolation from a calibration graph, with a Perkin Elmer UV-visible spectrophotometer (model 550S) at the maximum wavelength (λmax = 540 nm).
The adsorbed quantity qt (mg/g) and the percentage of elimination Rt (%) of BF ions by LPC were calculated by the following equations:


Co is the BF initial concentration and Ct is the BF concentrations (mg/L) at time (t), V is the volume of solution (L) and m is the mass of LPC (g).
Effect of different parameters of adsorption processes of BF onto LPC
The initial BF concentrations Co were100 and 200 mg/L at different pHs, temperatures, stirring rates, and mass doses. The effect of pH on the rate of color removal was analyzed at pHs (2–12) at 25°C, 400 rpm, 0.15 g of LPC and 50 mL of BF concentration. The pH was adjusted by addition NaOH and HCl solutions (0.1 N) and monitored by an Orion 920A pH-meter with a combined pH electrode. The pH-meter was standardized with NBS buffers before each measurement. The adsorbent dose was studied by agitating in different masses (2–16 g/L), at 25°C, 200 rpm, 0.15 g of LPC, and 50 mL of BF. The effect of temperature on the adsorption capacity of LPC was also studied in the region (293–313 K) in a regulated temperature-controlled bath at natural solution, 400 rpm, contact time 60 min, 0.15 g of LPC, and 50 mL of BF solution.
Results and Discussion
Figure 1 shows the FTIR spectrum of LPC, we note a wide absorption band in the region (3300–3600 cm−1) with a maximum at 3400 cm−1, characteristic of the elongation vibration of the OH bond of water. The bands centered at 2935 and 2800 cm−1 correspond to aliphatic CH elongation and aromatic CH, respectively. The wide band centered at 1044 cm−1 is attributed to an elongation in the CO group of acids, alcohols, phenols, ethers, or ester groups. 33 The dominant peaks at 512 and 659 cm−1 suggest the presence of vibrations of CH belonging to cellulose. Several bands are observed in the region (1300–1400 cm−1) corresponding to the elongation of the CN bond. The peak at 1626 cm−1 is assigned to a deformation in the N-H plane of amides while the band 1830 cm−1 is attributed to the elongation of C=O bond of the aldehydes.

The FTIR spectrum of the biosorbent.
The morphology of the sample was visualized by the BET method (Figure 2), the isotherm is identical to that of type II at low pressures. The specific surface area was determined by the BET equation while the external surface area, micropore area, and micropore volume were calculated by the t-plot method. The total pore volume was computed from the liquid volume of N2 at high relative pressure near 0.99. The mesopore volume was simply deduced by subtracting the micro-pore volume from the total volume. The pore size distribution (PSD) was calculated from the density functional theory (DFT) model; all characteristics for LPC are reported in Table 2.

Determination of the pH of zero point charge (PZC) of LPC.
Physicochemical characteristics of LPC.

The surface functions of the material can have a significant influence on the adsorption properties. 34 The basic or acidic nature of the adsorbent surface governs its retention capacities vis-à-vis to pollutants. However, the character and chemical properties of a sorbent are directly linked to the nature of the functional groups located on its surface. The surface charge of a sorbent, resulting from the acid-base equilibrium, depends on the pH and ionic strength of the solution with which the material is in contact. This charge can be positive or negative, depending on the environmental conditions. Therefore, an important feature of the surface is the point of zero net proton charge (pHpzc = 6.8) (Figure 3). It defines the pH for which the surface charge, linked to the exchange of protons, is cancelled. So, pHpzc characterizes the acidity or alkalinity of the adsorbent surface. Below pHpzc, the surface charge is positive (acidity) and converts to negative above pHpzc (alkalinity) and, tends to decrease when the oxygen content increases.

Determination of the specific area by the t-plot method.
Optimization study of operating conditions
Effect of BF concentration
The initial BF adsorbed (Co) increases from 40% to 98% in the concentrations range (100–200 mg/L) at pH 6.8 (Figure 4). From these results, we can deduce that the BF adsorption onto LPC is done in three stages:
- Relatively, a rapid adsorption of BF in solution due to the presence of the free sites on the adsorbent surface, which translates the linear increase of the adsorption capacity over time. This step lasts 30 min under the operating conditions.
- The deceleration of the adsorption process is reflected by a very small increase in the adsorption capacity due to the decrease of the quantity of BF in solution, a consequence of the diminution of sites available for adsorption. This stage lasts 30–50 min.
- The observed stability (50–60 min) of the adsorption capacity is presumably due to the almost total occupation of the available adsorption sites: the establishment of the level therefore reflects this stage.

Evolution of the adsorption of (BF) dye onto (LPC) as a function of time.
The BF ions are adsorbed initially on the external surface area of LPC, which makes the adsorption easy and fast. When the external surface is saturated, the BF ions enter inside the pores and absorb on the internal surface of the particles and such phenomenon takes relatively longer time. This may be attributed to an increase of the driving force because the concentration gradient with increasing Co in order to overcome the mass transfer resistance of BF ions between the aqueous and solid phases. Therefore, a higher BF concentration Co increases the adsorption capacity.
Effect of pH
Figure 5 shows that the maximum adsorption of BF is obtained at basic pH (7–12), the BF fixation at different rates can be due by its nature and structure. The maximum fixation is explained by the increase of negative charges of the LPC surface as biosorbent, which generates a strong electrostatic attraction, thus increasing the biosorption of cationic dyes. Conversely, an acid medium eliminates the negative charges from the supports, which results in a reduction in the fixation of the basic Fuchsin.
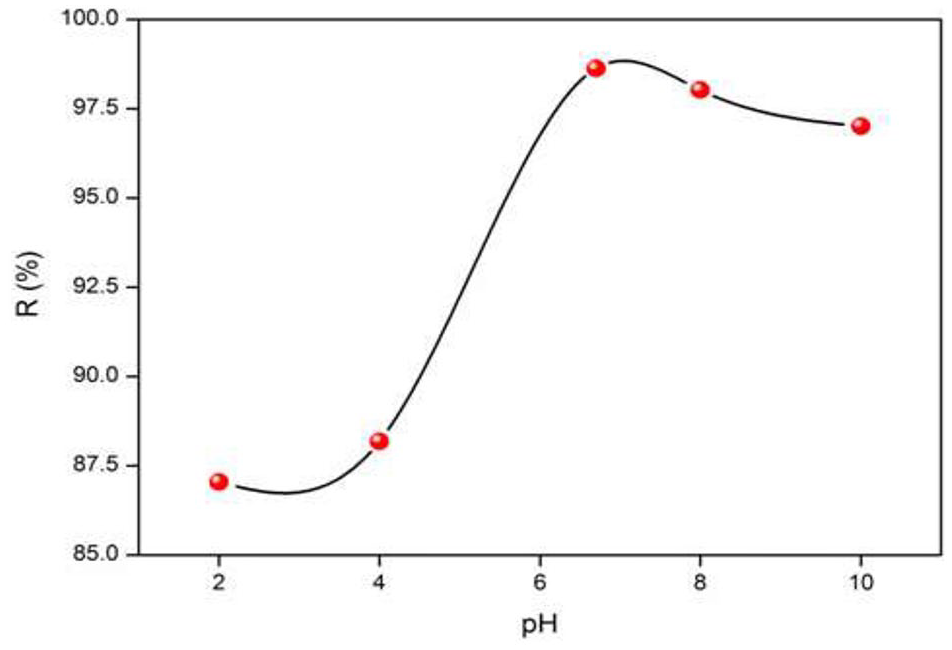
Evolution of the adsorption of (BF) dye onto (LPC) as a function of pH.
Effect of biosorbent dose
The first stage of batch experiments on LPC and the effect of adsorbent dose on the BF adsorption are also examined. Significant variations in the uptake capacity and removal efficiency are observed at different adsorbent dose (2–16 g/L), indicating that the best performance is obtained for a dose of 8 g/L (Figure 6). This result was subsequently used in all isotherms experiments.

Evolution of the adsorption of (BF) dye onto (LPC) as a function of adsorbent dose.
Effect of agitation speed
The effect of the stirring speed on the adsorption capacity onto LPC is also investigatedin the range (100–1000 rpm), above the vortex phenomenon predominates. The optimal adsorption capacity is obtained for a speed of 600 rpm (Figure 7) which gives the best homogeneity of the mixture suspension. Therefore, a speed of 600 rpm is selected for further experiments.

Evolution of the adsorption of (BF) dye onto (LPC) as a function of stirring speed.
Adsorption equilibrium isotherms
The aim of this part was to understand the interaction dye/adsorbent through the validity of the models and find parameters that allow comparison, interpretation, and prediction of LPC adsorption data. To assess the performance of adsorbent, different equations exist, including those of Langmuir, 35 Freundlich, 36 Temkin and Pyzhev, 37 and Elovich 38 (Figure 8). Besides, the isotherm models are applied under optimal conditions. The Langmuir model is the best known and most widely applied, it is represented by the nonlinear and linear forms:

Where Ce is the equilibrium concentration (mg/L), qmax is the monolayer adsorption capacity (mg/g), and KL is the constant related to the free adsorption energy (L/mg). The essential features of the Langmuir

Co is the initial concentration of the adsorbat in solution. RL indicates the type of isotherm: irreversible (RL = 0), favourable (0 < RL < 1), linear (RL = 1), or unfavourable (RL > 1). In this contribution, the RL values are smaller than 1, thus confirming that the adsorption is favourable in both cases as well as the applicability of the Langmuir isotherm.
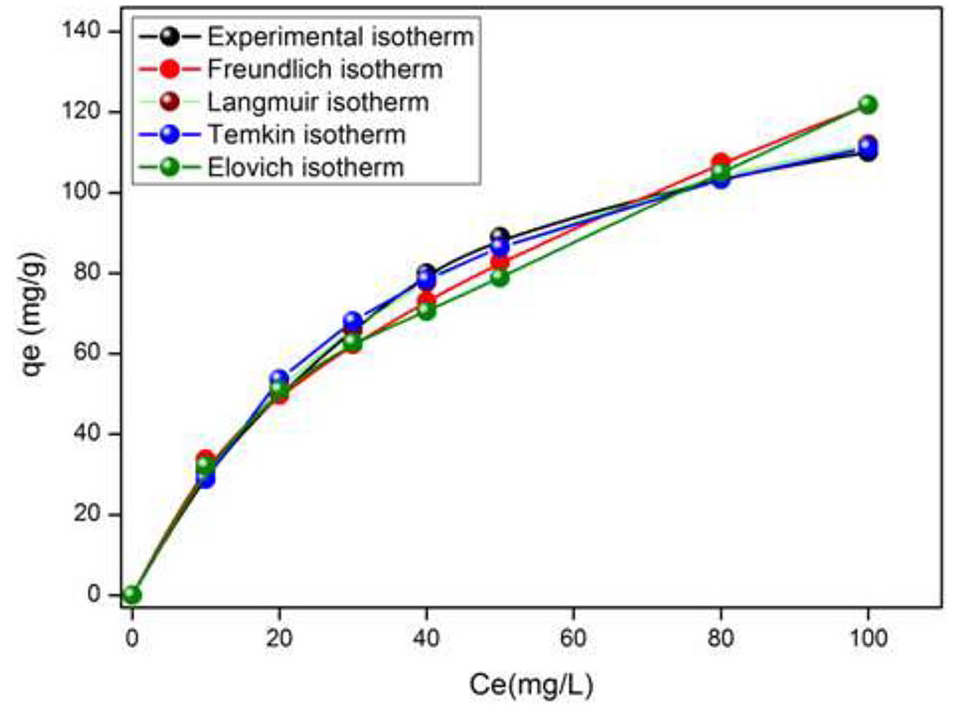
Modeling isotherms for the different models.
The Freundlich isotherm is valid for non-ideal adsorption on heterogeneous surfaces as well as multilayer sorption.

The constant KF characterizes the adsorption capacity (L/g) and n is an empirical constant related to the magnitude of the adsorption driving force. Therefore, the plot lnqe versus lnCe enables us to determine the constant KF and n.
The Temkin isotherm describes the behavior of adsorption systems on heterogeneous surfaces, and is applied in the following form:

The adsorption data are analyzed according to equation (6) and the plot qe versus lnCe permits to calculate the constants AT and BT.
The Elovich isotherm is based on the principle of the kinetic, assuming that the number of adsorption sites augments exponentially with the adsorption and this implies a multilayer adsorption described by:

Where KE (L/mg) is the Elovich constant at equilibrium, qmax (mg/g) the maximum adsorption capacity, qe (mg/g) the adsorption capacity at equilibrium, and Ce (g/L) the concentration of the adsorbate at equilibrium. Both the constants KE and qe are calculated from the plot of ln(qe/Ce) versus qe.The constants of the different models deduced after modeling are grouped in Table 3.
Parameters of the adsorption isotherms for (BF) dye onto LPC.

R2: Determination coefficient; ΔQ: Temkin energy.
Adsorption kinetic study
The adsorption kinetic is crucial to determine the operating conditions that are optimized for a full-scale batch process. It describes the uptake rate of adsorbate, controls the residual time of the whole process, and predicts the uptake rate. In this respect, different models were proposed to understand the behavior of adsorbents and to study the mechanisms controlling the adsorption. In this study, the experimental data of BF adsorption are examined using the pseudo-first and pseudo-second order kinetic model.
The former is given by the following equation 39 :

The pseudo-second order model is expressed by the equation 40 :

Where qt (mg/g) is the amount of BF adsorbed on LPC at the time t (min), K1 (min−1), and K2 (g/mg.min) the pseudo-first order and pseudo-second order kinetics constants respectively.
The slope and intercept of the plots ln(qe − qt) versus t were used to determine the first-order rate constants K1 and qe while the plot t/qe versus t was used to determine the K2 and qe which predict the BF uptake. For the pseudo-first-order kinetic, the experimental data deviate from linearity, as evidenced by the low values of qe and Co and is therefore inapplicable for the present system.
By contrast, the correlation coefficient and qe,cal determined from the pseudo-second order model agree perfectly with the experimental kinetic data; the corresponding correlation coefficients for LPC are summarized in Table 4. Such applicability suggests that the adsorption BF onto LPC is based on chemical reaction (chemisorption), involving an exchange of electrons between adsorbent and adsorbate. Such a case, the BF ions are attached to the adsorbent surface by chemical bond.
Adsorption kinetics constants, modeled by the pseudo first-order and pseudo second-order models.

Adsorption thermodynamics
The thermal effect shows that the adsorption capacity of LPC increases with augmenting temperature (295–313 K), indicating that the adsorption is favored at high temperatures. The adsorption of coloring molecules on LPC surface implies a variation of the free energy between the initial and final states. The feasibility of the reaction, defined by ΔG° (kJ/mol), corresponds to the variation of free enthalpy at constant pressure:

The free energy ΔG° is composed of the enthalpy ΔH° which gives the energies of interactions molecules/adsorbent surface, and entropy ΔS° which expresses the modification and arrangement of the molecules in the liquid phase and on the surface. The thermodynamic behavior for BF adsorption on LPC was further investigated and the values of ∆G°, ∆H°, and ∆S° are calculated from the relation:

Where Ko is the apparent equilibrium constant. ∆H° and ∆S° are computed from the adsorption data at different temperatures using the relation:

The values of lnKo are obtained from equilibrium constant (Ks) 41 :
Where

The values of Ko is determined from the intercept (figures not shown), by plotting ln(qe/Ce) versus Ce and extrapolating to Ce = 0, while ΔH° and ΔS° obtained from the slope and intercept of the plots lnK versus 1/T (Figure 9). In the rate law, the temperature dependence appears in the rate constant, represented by the empirical equations (11) and (12). The adsorption capacity of LPC increases with raising temperature in the range (295–313 K) and the values of ΔG°, ΔH°, and ΔS° are presented in Table 5.

Regression of the thermodynamic parameters of (BF) adsorption on (LPC).
Thermodynamic functions ΔG°, ΔS°, and ΔH° of basic fuchsin adsorbed on LPC.

Performance of the AC
At this level, it is instructive for a comparative goal to report the adsorption capacity of some adsorbents reported in the literature. The different values of the Langmuir maximum adsorption capacity qmax of various adsorbents cited in previous works are gathered in Table 6. We can see that the BF adsorption observed in the present study is well classified compared to other researches with a maximum adsorption capacity qmax of 158.73 at 295 K, relatively interesting with respect to other adsorbents. The differences of the dye uptakes are due to the properties of each adsorbent namely the structure, the functional groups, and the surface area. LPC is considered as an attractive adsorbent for basic dyes owing to the isoelectric point (pHpzc).The desorption is an unavoidable process toward the adsorbent regeneration. The latter is essential to assess the reutilization of any adsorbent for large-scale applications, owing to the ecological concerns and sustainable development. This study has given encouraging results, and we wish to carry out column adsorption tests under the conditions applicable to the treatment of industrial effluents and to test the heterogeneous solar photocatalysis for the oxidation of BF onto the semiconductor SnO2 is our next objective in the near future. First experiments were satisfactory; the tests are currently under way and will be consecutively reported.
Comparison of maximum adsorption capacities for BFdye with literature data.

Conclusion
In this work, an experimental study on the utilization of Leaves Pruna Cerasefera for the removal of Basic Fuchsin from aqueous solution was investigated. The potential of this biosorbent was studied for elimination of BF. The influence of the initial pH, BF concentration, contact time, adsorbent dose, stirring speed, and temperature on adsorption of BF was investigated.
The adsorption capacity of BF increased with increasing the initial BF concentration, while the optimized pH was found between 7 and 10. The kinetics of BF removal indicated an optimum contact time of 50 min via two stage of adsorption kinetic profile (fast adsorption followed by a slow equilibrium). The BF adsorption onto LPC follows a pseudo-second order kinetic model (R2 = 0.999) that relies on the assumption that the chemisorption is the rate-limiting step. The BF ions are attached to the adsorbent surface by forming chemical bonds and tend to find sites that maximize their coordination number with the surface.
Various models analyzed the equilibrium adsorption data. The results showed that the Langmuir isotherm provides the best correlation (qmax = 158.73 mg/g at 295 K). The negative values of ΔG°and ΔH° indicated that the adsorption of BF onto LPC is spontaneous and exothermic over the studied temperatures range and the BF moleculesare strongly bonded to the adsorbent surface.
The comparison of the adsorption capacity of our adsorbent with those reported in the literature showed its attractive properties from both industrial and economic interests.
This study has given encouraging results, and we wish to realize column adsorption tests under operational conditions applicable to the treatment of industrial effluents and to test the homogeneous photodegradation of BF onto SnO2 as semiconductor is the future objective of this work.
Footnotes
Acknowledgements
The authors gratefully acknowledge support from University M’hamed Bougara of Boumerdes, Laboratory of Soft Technologies and Biodiversity, Faculty of Sciences.
Declaration of conflicting interests
The author declared no potential conflicts of interest with respect to the research, authorship, and/or publication of this article.
Funding
The author received no financial support for the research, authorship, and/or publication of this article.