
Abstract
The main purpose of this study is to predict and develop a model for forecasting the Seam Strength (SS) of denim garments with respect to the thread linear density (tex) and Stitches Per Inch (SPI) by using a Fuzzy Logic Expert System (FLES). The seam strength is an important factor for the serviceability of any garments. As seams bound the fabric pieces together in a garment, the seams must have sufficient strength to execute this property even in the unexpected severe conditions where the garments are subjected to loads or any additional internal or external forces. Sewing thread linear density and number of stitches in a unit length of the seam are the two of the most important factors that affect the seam strength of any garments. But the relationship among these two specific variables and the seam strength is complex and non-linear. As a result, a fuzzy logic based model has been developed to demonstrate the relationship among these parameters and the developed model has been validated by the experimental trial. The coefficient of determination (R2) was found to be 0.98. The mean relative error also lies withing acceptable limit. The results have suggested a very good performance of the model in the case of the prediction of the seam strength of the denim garments.
Introduction
Denim is one of the widely used textile materials in the world and has been extensively used as regular clothing as well as fashion items.1–3 Denim has enormous social and cultural influence and has been adopted very well by the people of all age groups.1,3 It has a long history and a story of success. Traditional denim is a 3/1 warp-faced twill woven with indigo dyed warp yarn and white weft yarn hence, one side of the fabric looks blue and the reverse side provides an appearance of white.1–3 The denim fabric is very sturdy and as a result, the serviceability of this fabric is better comparing the other fabrics.1,3 However, this serviceability is dependent on the seam strength and if the seam strength falls, it may affect the service life of the garment. 4 Therefore, selecting optimum seam strength during designing and manufacturing a denim garment is a matter of paramount importance.
Among various seam such as superimposed, lapped, bound, flat etc., the superimposed seam is highly used for the assembling of the denim garments due to its robustness and some other good properties to provide additional strength to the denim.5,6 Seams provide the shape of the apparel to be worn and support the fabric pieces together to ensure the proper service life. 7 It is a matter of the fact that seam strength is one of the most important factors for the serviceability of any garment. As a result, seams with adequate strength is a landmark for the garments.7,8 In general, the seam strength depends on various factors such as seam type, stitch type, sewing thread type, linear density, and stitches per unit area. Several studies have been performed to assess the influence of these factors on the seam strength of various fabrics and or garments.8–12 These studies also investigated the effect of different factors on seam strength. In a study, three different types of seam formed by lockstitch formation on different polyester/wool fabrics were studied. The authors have concluded that, with the increase of stitch density, the seam strength and seam efficiency increase. Besides, stitch direction plays important role in case of seam efficiency. But this study was conducted by using multivariate variance analysis (ANOVA). 11 Another comprehensive study on seam strength and appearance by using Kawabata Evaluation System (KES-F) for sample evaluation and Structural Equation Modelling (SEM) for analysis have found some specific results in terms of seam appearance and strength. 13 The effect of fabric type and the sewing condition on the seam strength has been studied and the authors claimed that with the uniform fiber matrix higher seam strength efficiency can be achieved. 14 In addition, among diverse fabric structures, plain is the most efficient, rip-stop is average, and twill is the least efficient in terms of seam efficiency. 14 At the same time, the lockstitch seam was found least efficient in terms of seam efficiency. 15 In another study, 16 it has been found that seam strength has been influenced significantly with the loss of the thread strength. Similarly, the seam strength for coarser yarn fabric is generally higher than that of more compact fabrics of finer yarn. 16 Besides, stitch length and bobbin thread type have a significant influence on seam strength. Several research works have been accomplished to determine the seam strength of some special fabrics, for example, webbings for parachute assemblies, 12 cotton canopy fabrics, 15 elastic woven fabrics 9 and treated and finished fabrics. 17 Further, the effect of sewing thread type, stitch density, and stitch type on seam strength has also been studied.8,18 Moreover, the effect of the texturing of sewing thread on the seam strength has been researched and reported. 19 However, no significant research work has been reported on the development of a model to predict the seam strength in response to the stated factors.
On the other hand, the Artificial Neural Network (ANN) is a computing system inspired by the biological neural networks of the human brain. 20 This method is vastly used in the field of decision-making modeling. 21 In textiles, the ANN method is used as an embedded-expert system in the manufacturing processes as well as used in developing a model and predicting properties of the textile materials.22,23 Some studies24,25 have been conducted with the help of ANN, Linear Regression, and Taguchi methodologies to predict the strength of woven fabrics. But they are only for fabrics, not for any kind of seams. In addition, a few studies have discussed on predicting the seam strength by utilizing the mathematical equation method.12,26 However, both the ANN and mathematical equation methods are not completely free of some objectionable drawbacks. For example, the ANN method generally requires a numerous amount of data which is always not easy to obtain from an industrial situation and mathematical models are not ready to be used in the practical field. In this situation, fuzzy logic based models 27 can help to model and predict the seam strength within a very short period with response to the change in parameters that affect the seam strength.
Therefore, in this current study, we have investigated and developed a model to predict the strength of a superimposed seam, which is considered as one of the most used seams in denim garments, through the fuzzy logic expert system.
Methodology
Development of fuzzy expert system
Structure of the fuzzy logic system
The fuzzy logic system was developed by Zadeh at the University of California in 1965 27 and in different branches of researches, it has been extensively used as a successful methodology.
Figure 1 shows the four principal components of a fuzzy logic system.28–31 The four basic components of the fuzzy logic system are discussed below:
(a) Fuzzification interface: It is the first block of the fuzzy expert system and the first task in this interface is to select the input and output variables. The numeric variables are defined in linguistic terms as low, medium, high, etc. membership functions have to be created for both input and output functions. The membership functions represent numerically to what degree an element belongs to a set. Among different forms of membership functions like triangle, trapezoid, and Gaussian functions the triangle membership function is the simplest and widely used.28,31–34
(b) Rule bases: Mamdani and Sugeno are the two classes of fuzzy expert rule base.33,35–37 In this particular research, Mamdani rules have been used.

Basic configuration of the fuzzy logic system.
Fuzzy rules are the heart of a fuzzy logic expert system. 29 These rules relate the input and output variables and are operated by if-then statement.30,32,34 For instance, for two inputs A and B, and one output C having linguistic variables of low and medium for A and B respectively and medium for C then the development of fuzzy inference rules30,32,34,36 can be presented as follows:
If A is low, and B is medium, then C is medium.
(c) Decision-making logic: Decision making logic plays a central role in a fuzzy expert based system, as it can create human-like decision making. In this study, we have used the Mamdani max-min fuzzy inference as it assures a linear interpolation of the outputs between rules.31,31,32 Figure 2 represents the mechanism of the fuzzy inference system in the case of two inputs and a single output. The figure denotes that, there are two inputs tex and SPI, and a single output SS. The Mamdani fuzzy interface works as the central processing unit and plays a key role in explaining the complex non-linear relationship among the input variables and output.
(d) Defuzzification interface: It is the final unit of a fuzzy expert system. 38 The defuzzification interface converts the fuzzy output into precise crisp numeric values by combining the conclusions made by the decision making logic.36,39 There are several methods of defuzzification interface, such as centroid, center of sum, mean of maxima and left-right maxima. 40 However, among these the most used defuzzification method is the center of gravity (centroid) defuzzification method, as this operator assures a linear interpolation of the output between the rules. 29 The conversions of fuzzy output into a non-fuzzy crisp value Z can be expressed by using equation (1)31,38:
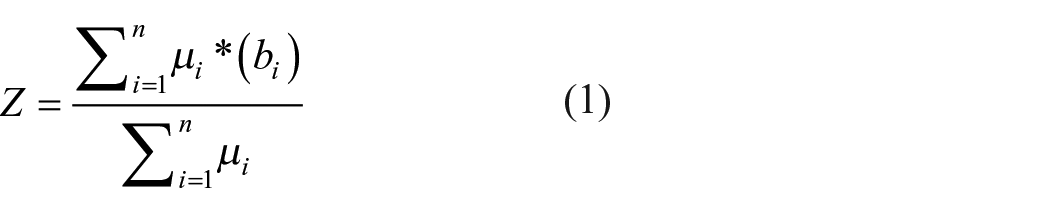
where

Fuzzy inference mechanism. Two inputs and their effect on the output are centrally processed by Mamdani fuzzy interface. Mamdani explains the complex non-linear relationship among the input and output variables.
Development of the model based on fuzzy expert system
Two process variables namely tex (the linear density measurement unit of textile yarns) and SPI (Stitches Per Inch) were used as the input parameters and Seam Strength (SS) as the output parameter for the construction of the fuzzy logic system. A fuzzy logic toolbox from MATLAB (Version 9.6) was used to develop the proposed fuzzy model of SS. For fuzzification, three linguistic fuzzy sets Low (L), Medium (M), and High (H) were chosen for input variables Tex and SPI and they were evenly spaced and covered up the full input ranges. Five output fuzzy sets such as Very Low (VL), Low (L), Medium (M), High (H), Very High (VH), were employed for SS. Linguistic Fuzzy sets and their numeric ranges are represented in Table 1.
Fuzzy sets and numeric values.

In our current study, the triangular-shaped membership functions were used for both the input and output variables. The triangular-shaped membership functions have shown more accuracy in this aspect. Mamdani max-min inference mechanism and the center of gravity defuzzification method33,35,36 have been applied in this research work.
Fuzzification of the used factors was performed by equations (2), (3), and (4), respectively


where
Prototype triangular-shaped fuzzy sets for the fuzzy variables namely tex, SPI (Stitches Per Inch), and SS (Seam Strength) have been developed using a fuzzy toolbox from MATLAB. The membership values are presented in Figures 3–5. In this study, a total of nine (9) fuzzy rules have been formulated based on expert opinion. The rules are tabulated in Table 2.

Membership function of tex.
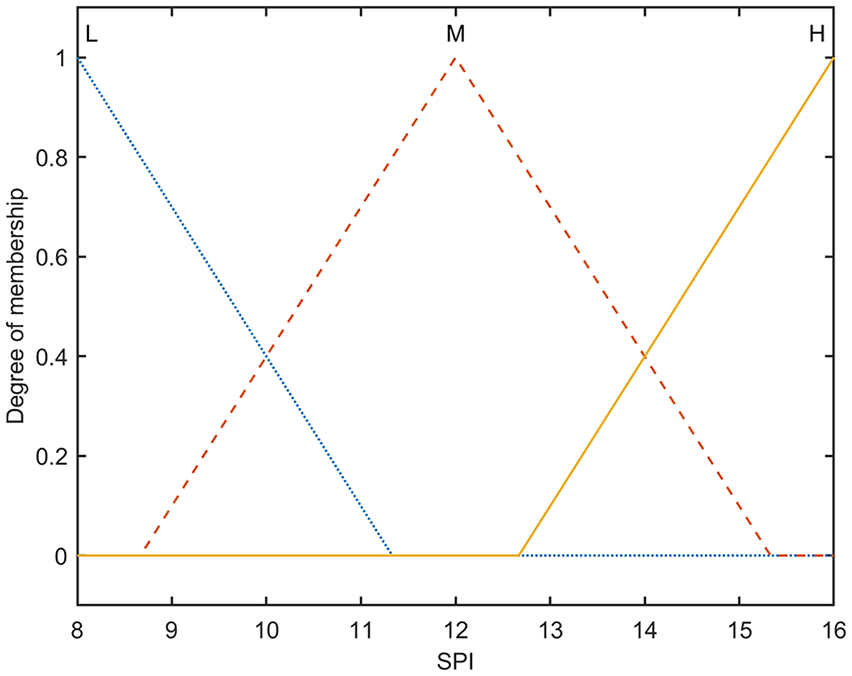
Membership function of stitches per inch (SPI).

Membership function of seam strength (SS).
Fuzzy rules.

Experimental procedure to validate the developed model
The seams for the denim fabrics were prepared by using 100 % cotton yarn. These comprised sulphur dyed denim fabric having 412 GSM (Grams per Square Meter), 3/1 warp-faced twill with a fabric construction of 70 × 42/7 × 10 where fabric width was 60 inches. The cut fabric pieces were arranged to produce a superimposed seam. Figure 6 demonstrates the schematic structure of the superimposed seam.5,6,41

Fabric arrangement in the superimposed seam. 6
The seams were produced with sewing thread (Needle thread) comprised of three different linear density (20 tex, 30 tex, and 50 tex) in a formation of 8, 10, and 16 stitches per inch. The same bobbin thread (30 tex) was used for each sample. As sewing direction plays an important role in seam performance, that’s why we have maintained a constant weftwise sewing direction for preparing all the samples. The process variables for both model development and experiment are represented in Table 3.
Range of process variables.

Commercially available sewing threads were used for this current study. The seams were prepared by following the Stitch Class 301 (Single Needle Lock Stitches) which is defined as a stitch type where threads of two or more groups are interlinked with each other through interlacement. 6 A Single Needle Lock Stitch Sewing Machine was used for the sample preparation. The key specification of the machine is described in Table 4.
Specifications of the sewing machine used for sample preparation.

The produced samples were conditioned on a flat surface for at 24 h before testing under standard atmospheric conditions at relative humidity, RH (65% ± 2%) and temperature (20°C ± 2 °C). 42 The Seam Strength of the prepared samples was determined according to ASTM D 1683 –04 by using Testometric Universal Strength Tester (M350-5 CT). An average of 03 samples for each combination has been recorded as the seam strength for that particular combination of tex and SPI.
Validation of prediction accuracy
The accuracy of the prediction has been investigated by estimating Mean Relative Error (MRE), Co-efficient of determination
Results and discussion
Fuzzy logic operation
Figure 7 represents the rule viewer of the fuzzy logic model which is one of the important output interfaces of a fuzzy expert system. This interface mainly acts as a tool that is used to select the input parameters for the desired output value. For example, in this interface, if anybody tweaks any or both of the input parameters (tex and/or SPI), the output parameter SS will change accordingly and logically. For instance, if tex is 40, and SPI is 14, then the SS is 725 N. If the tex is changed to 45 and SPI is changed to 20, the SS will also change. This selection is possible for a wide range of input and output data and this system can respond even in a slight change in the input and output parameters.

Fuzzy rule viewer.
Using MATLAB fuzzy toolbox, the fuzzy surface was developed as shown in Figure 8, which explains the relationship between tex (Thread Linear Density) and SPI (Stitches Per Inch) on the input side and SS (Seam Strength) on the output side. It is evident from the figure that, the relation between any of the individual inputs (tex or SPI) and output (SS) can be interpreted. Importantly, the complex relationships among both of the inputs (tex and SPI) and output (SS) are also can be established. It is clear from the figure that, with the increment of tex and/or SPI the output (SS) increases. With the help of the rule viewer (Figure 7), the crisp values in every point of the complex mesh structure can be numerically calculated.This mesh plot depicts the dynamic operation of the fuzzy logic system over time.

Surface plot of the fuzzy logic system.
It has been observed that the SS has increased with the increment of any or both of the input parameters and vice versa (Figures 9 and 10, respectively). From this study, it has also been found that the input parameters (tex and SPI) influence the output parameter (SS) significantly and these changes can be tracked and analyzed comprehensively by the developed fuzzy model. Moreover, this model could be able to detect a very small scale change in the seam strength when the tex and/or SPI changes. As the seam strength is one of the top parameters for the serviceability of any garments, it is very important to use the sewing thread of proper linear density (tex) and select machine SPI properly. As this model can suggest the optimum input parameters, hence, it is possible to suggest the required thread linear density (tex) and stitch density that should have to be chosen to achieve the required seam strength in the case of denim fabric or garments.

Surface plot of the effect of tex on seam strength (SS).
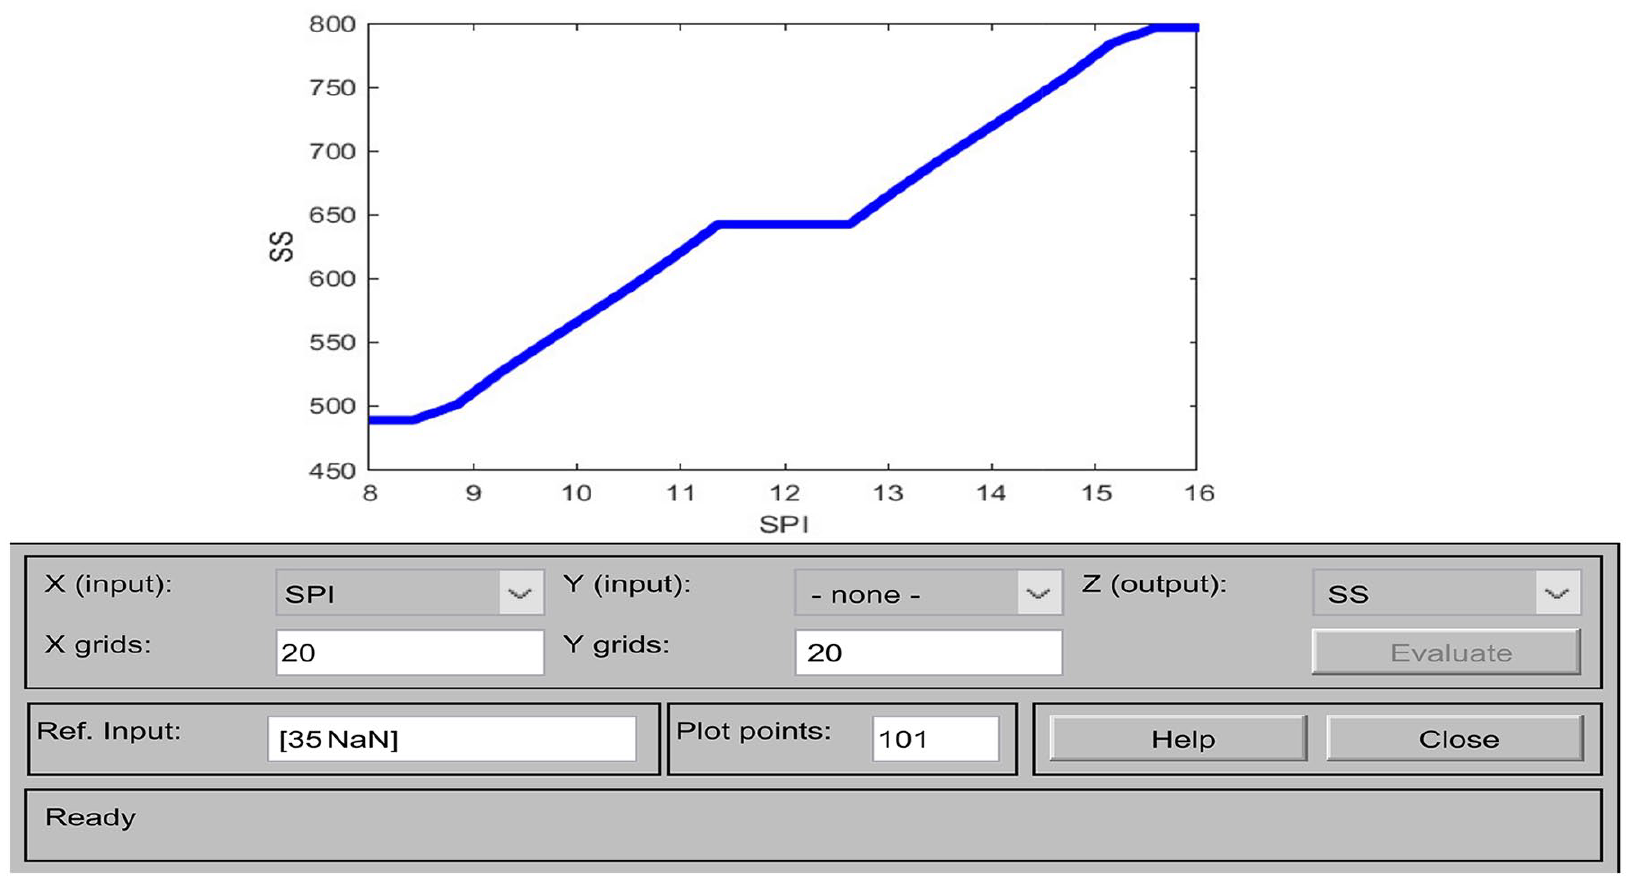
Surface plot of the effect of stitches per inch (SPI) on seam strength (SS).
Analysis of experimental results
Figures 11 and 12 represents the influence of the linear density of the sewing thread (tex) and stitch density (SPI) on the seam strength of denim garments.

Effect of tex on seam strength.

Effect of stitches per inch (SPI) on seam strength.
It is evident from Figures 11 and 12 that, both of the input parameters namely tex and SPI possess a great influence on the seam strength. Precisely it could be claimed that the increment in seam strength might be achieved with the increment of tex and SPI. It is obvious because the seam strength depends on various factors and among them, the strength of the sewing thread is a top one. It is well-known that the increment in the tex value of a thread makes it coarser and coarser threads are stronger compared to the finer threads of the same material. Therefore, the strength of the seam increases with the increment of tex of the threads. Similarly, the stitch density or SPI influences the seam strength. The higher SPI means more sewing thread in a unit length of the seam and more thread consumption in the case of lock stitch increases the seam strength. 5 It has been found that with the increment of tex, the seam strength increases up to 84 %, 39 %, and 50 % for 8, 10 and 16 SPI respectively.
Validation of the predicted results
The suitability and fit of the developed model have been exclusively assessed by using experimental data. The obtained experimental results were compared with the predicted results obtained from the Fuzzy Logic Expert System (FLES) model. Then Mean Relative Error (%) and the coefficient of determination (R2) was calculated to check the compatibility of the results. The total comparison of the actual and predicted results are presented in Table 5.
Comparison of actual and predicted values of seam strength.

The correlation between the FLES model predicted and the experimental/ actual values of Seam Strength using different thread count and SPI are presented in Figure 13. The Co-efficient of Determination (R2) was found to be 0.98 (R = 0.99). The Mean Relative Error between the experimental and predicted values was found to be 4.94. Hence, it can be assumed that the predicted model can explain up to 98% of the total change in seam strength (SS) as a result of the change in sewing thread linear density and stitches per unit length. The Mean Relative Error was found to be 4.94% which is less than 5%, which lies within the acceptable limit. These findings from the Co-efficient of determination and Mean Relative Error suggest that the developed model is suitable for predicting the Seam Strength with satisfactory accuracy.

Correlation between actual and predicted value by the fuzzy logic model.
Conclusion
The primary aims and objectives of this research work were to prepare, develop and evaluate a model that can appropriately calculate the seam strength of the denim garments with respect to the sewing thread’s linear density and stitches per inch. Besides, this model can also be helpful for the prediction of the seam strength with the changes applied in thread linear density (tex) and stitches per inch (SPI). The bright side of this project work is that the developed model is eventually customizable. Hence, the decision-makers in the garments sector and garments designers, especially of the garment-producing and exporting countries, would be able to make decisions which seam strength would be effective for the denim within a very short time and select proper thread density and SPI for the garments. Moreover, the principle of this model can be used to develop models for other fabrics to eliminate the hassle of checking the seam strength by trial and error method. By analyzing the experimental study and developed model, it is eminent that both the sewing thread linear density (tex) and the stitches per inch (SPI ) directly possess an effect on the seam strength of the garment. The experimental and model-predicted results were compared and the prediction accuracy of the developed model was assessed by calculating the coefficient of determination, correlation co-efficient, and Mean Relative Error (%). The conclusions may be drawn from this investigation are:
(a) The Mean Relative Error between the predicted values and experimental values of seam strength was found to be 4.94 which is lower than the acceptable limit of 5%.
(b) The correlation coefficient (R) between the predicted and experimental values of seam strength was found to be 0.99.
(c) The Co-efficient of determination (R2) was found to be 0.98 which indicated a good fit of the model data with experimental data and hence suggests that the model is well compatible.
Finally, it can be concluded that the developed fuzzy model can be used in the field of apparel designing and production as a decision-making tool for the aid to set proper seam strength of the superimposed seams in denim garments. Therefore, we believe that this method is super convenient to predict the seam strength with response to sewing thread’s linear density and thread density in the seam. However, the method is valid only for superimposed seams of denim but examining and comparing other seam types could give a better idea about the behavior of seam strength for different seam types. Though nine rules are sufficient for three input and three output variables, but considering more rule base can give more precise result in terms of values of the prediction, which would be studied in our future research works.
Footnotes
Declaration of conflicting interests
The author(s) declared no potential conflicts of interest with respect to the research, authorship, and/or publication of this article.
Funding
The author(s) received no financial support for the research, authorship, and/or publication of this article.