
Abstract
The adsorption of indigo carmine dye onto Activated Pomegranate Peels (APP) from aqueous solutions was followed in a batch system. The adsorbent was characterized by the BET method (specific surface area SBET: 51.0674 m2/g) and point of zero charge (pHpz = 5.2). However, some examined factors were found to have significant impacts on the adsorption capacity of pomegranate peels (APP) such as the initial dye concentration (10–60 mg/L), solution pH (2–12), adsorbent dose (1–10 g/L), agitation speed (100–600 rpm), and temperature (298–308 K). The best adsorption capacity was found at pH 2 with an adsorbent dose 1 g/L, an agitation speed 300 rpm and a contact time of 45 min. The adsorption mechanism of IC onto (APP) was studied by using the first-pseudo order, second-pseudo order, Elovich, and Webber-Morris diffusion models. The adsorptions kinetic were found to follow rather a pseudo-second order kinetic model with a determination coefficient (R2) of 0.999. The equilibrium adsorption data for IC onto (APP) were analyzed by the Langmuir, Freundlich, Elovich, and Temkin models. The results indicate that the Langmuir model provides the best correlation with capacities (qmax of 158.73 mg/g at 298 K). The adsorption isotherms at different temperatures have been used for the determination of thermodynamic parameters like the free energy; enthalpy and entropy to predict the nature of adsorption process. The negative values ΔG° and ΔH° indicate that the overall adsorption is spontaneous and exothermic with a physisorption process. The adsorbent elaborated from pomegranate peels material was found to very effective and suitable for the removal of reactive dyes from aqueous solutions, due to its availability, low cost preparation, and good adsorption capacity.
Introduction
Dyes are commonly used in many industries, like textile, food, paper, plastic, cosmetics, and coloring industries. These industries commonly use synthetic dyes tuff as colorants. Discharge of dyes contained in wastewaters, contaminates both the surface water and ground water. The dyes even at very low concentrations affect the aquatic life and human health by polluting the environment. These toxic dyes are a major public concern according to United Nations Educational, Scientific and Cultural Organization standards, the World Health Organization; the indigo carmine at a concentration above 0.005 mg/L 1 is not acceptable in water. This IC dye is not only a nuisance for the aquatic life, but also for the humans. The treatment of this waste before disposal is therefore essential. Although several methods such as adsorption, coagulation, membrane techniques, oxidation, biological, chemical precipitation, flotation, ion exchange, and electrochemical deposition2–6 with their advantages and disadvantages, the process of adsorption is widely used to remove pollutants. Activated carbon is used as an adsorbent due to its remarkably high porosity, improved pore size, and higher adsorption capacities. However, due to the high cost, its operation is somehow inadequate. Recently, the use of agricultural waste as activated carbon precursors has been found to be renewable and relatively less expensive. Therefore, in recent years, people have been focusing on the activated carbon preparation based on agricultural waste and lignocelluloses materials which are effective and very inexpensive such as pomegranate peel, 7 activated carbon, 8 titanium dioxide 9 and apricot stones,5,10–12 and others adsorbents.13–15 Physical and chemical activations are the common methods for production of activated carbons. By chemical activation, it is possible to prepare activated carbon in the presence of activating agents. Heavy Metals are considered potential pollutants after the dye, as they are lethal even at very low concentrations, last effect long and natural persistent non-biodegradable, that is, not undergoing microbial or chemical degradation. 16
Water pollution is one of the serious problems facing the whole world today, in which wastewater containing the dyes is continually released into the environment. In a few years, the ecological and global fear of public health linked to atmospheric contamination by the use of these dyes increases considerably. Due to their high solubility in aquatic environments, the dyes are spontaneously immersed in fish and vegetables. When these dyes come into contact with humans, they enter our body through water, air, food, or absorption through the skin. Air (industrial and burnt fuel), soil (fertilizers, pesticides, insecticides, etc.) and water (industrial wastewater, rocks, etc.) are the main sources of the dyes through which they are accessible in the environment. 17 These dyes have entered the environment through various natural processes as well as human activities (manufacturing, cultivation, effluents). Among these, some industries, agriculture, and technological expansion have significantly improved the potential exposure to humans significantly. Dyes can affect the nervous system; damage various organs in the body such as liver, kidneys, lungs, brain, and blood, cause Alzheimer’s disease, etc., 18 the toxic effects of various metals and dyes have been examined by various scientists.3,19 In this unpublished study, it was necessary to understand how the dye IC interacts with the adsorbent during discoloration and to describe the potential processes involved in these interactions. For this purpose, we carried out a parametric study of the adsorption, by studying the effect of several significant parameters on the decolorizing power of the material used particularly the contact time, the concentration of the adsorbent, the pH, the stirring speed, and temperature. Therefore, the main objectives of this contribution are summarized as follows:
The main objective of this study is to prepare a new adsorbent at low cost from Pomegranate Peel (APP) for the elimination of Indigo Carmine (IC) by adsorption in batch mode.
Develop the porosity of this adsorbent by both chemical and physical activations and show that this adsorbent can constitute a support for the water treatment.
Possibility to switch from batch mode to column mode.
Carrying out tests on an industrial scale and regeneration of the adsorbent for reuse.
Carrying out tests by photocatalysis in the presence of adsorbent/semiconductor hybrid catalysts.
Experimental
Determination of zero point charge pH(zpc)
The zero point charge pH(zpc) of (APP), that is, the pH for which the surface charge is zero, is determined using a procedure similar to that described elsewhere. 20 Twenty milliliter of KNO3 solutions (0.01 M) are placed in closed conical flasks; the pH of each solution is adjusted between 2 and 14 by addition of HCl or NaOH solution. Then, 0.1 g of (APP) is added and the final pH is measured after 24 h under agitation at room temperature. pH(zpc) is the point where the final pH versus initial pH crosses the line at final pH = initial pH.
Batch mode adsorption studies
Indigo Carmine of structural formula shown in the (Figure 1), which is also commonly known as Acid Blue 74 or Food Blue 1 or FD and C Blue 2 (CASRN 860-22-0), is a dark blue, water-soluble powder. The molecular formula of the dye is C16H8O8N2S2Na2 and molecular weight is 466.36. For the present studies Indigo Carmine is procured from M/s Merck. Adsorbent–pomegranate peel was collected from the Boumerdes region (Algeria). The stock solution is prepared by dissolving the accurate amount of IC (99%, Merck) in distilled water; the other solutions are prepared by dilution. The microprocessor based pH meter; model number HI 8424 (M/s Henna Instruments, Italy) was used to measure the pH of the solutions. Concentrations of the aqueous solutions of dye were monitored on UV/Visible spectrophotometer, Model 117 (M/s Systronics, India) over a wavelength range of 610 nm. The effects of the experimental parameters such as, the initial IC concentration, pH, adsorbent dose, and temperature on the IC removal are studied in batch mode for a specific period of contact time. pH is adjusted with HCl or NaOH. The characteristics of IC are represented in Table 1. The IC content in the supernatant is analyzed on a Perkin Elmer UV-Visible spectrophotometer model 550S (λmax = 610 nm). The amount of IC adsorbed on activated carbon qt (mg/g) is calculated from the following equation:

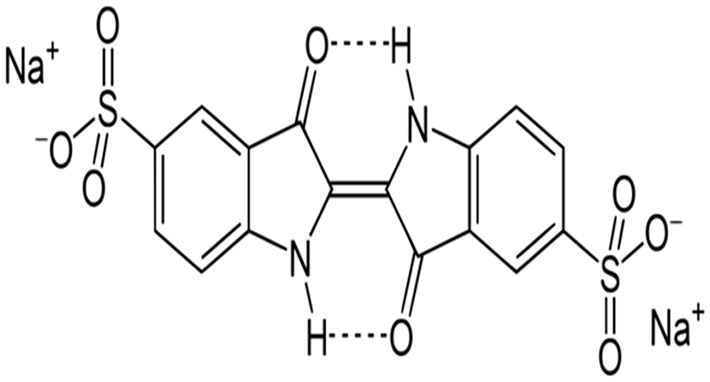
Molecule structure of the IC.
Characteristics of Indigo Carmine.

Where Co is the initial IC concentration and Ct the IC concentrations (mg/L) at time (t), V the volume of solution (L), and m the mass of the activated carbon (g).
Preparation of Activated pomegranate peels
The activated carbons were prepared from pomegranate peels. At first, the precursor was thoroughly washed with distilled water and dried in an air oven at 12°C; such protocol was effective to facilitate the crushing and grinding. A fraction particle size of between 0.5 and 1 mm was used for the preparation of activated carbons by impregnation with H3PO4 (purity 85%).
The precursor was activated with a chemical agent in a solid form. The impregnated precursor was carbonized in a horizontal tubular furnace under N2 flow with a heating rate of 5°C/min to allow free evolution of volatiles, up to the hold temperature for 1 h. The resulting activated carbon was immersed in HCl (37%, density 1.18 g/mL) solution under reflux ebullition (3 h) in order to extract the compound formed and reagent excess. Then, the solution was filtered and the black solid was washed with hot distilled water. The adsorbent was dried at 120°C, and kept in tightly closed bottles until use. The activated carbons prepared from pomegranate peels were named (APP).
Effect of different parameters for the adsorption processes
The initial IC concentrations (10–60 mg/L) were tested at different pH, temperature, stirring speed, and adsorbent dose. The effect of pH on the rate of color removal was analyzed at pHs (2, 6, 8, 10, and 12) at 25°C, 150 rpm, 1 mg of (APP), and 10 mL of IC concentration (20 mg/L). The pH was adjusted using 0.1 N NaOH and 0.1 N HCl solutions by using an Orion 920A pH-meter with a combined pH electrode, standardized with NBS buffers before every measurement.
The effect of adsorbent dose was studied by agitating in different masses (1–10 g/L), at 25°C, 300 rpm, 0.01 g of (APP), and 10 mL of IC concentration (20 mg/L). The effect of temperature to the adsorption capacity of APP was carried out at 25°C and 35°C in a constant temperature bath at natural solution pH 2, 300 rpm, contact time 45 min, 0.01 g of (APP), and 10 mL of dye concentration (20 mg/L).
Results and Discussion
Characterization of the (APP)
The specific surface area and pore structure of the activated carbons were calculated by the (BET) equation using the ASAP 2010 Micromeritics equipment. The external surface area, micropore area, and micropore volume were determined by the t-plot method. The total pore volume was evaluated from the liquid volume of N2 at a high relative pressure near unity 0.99.The pore size distribution (PSD) was determined using the density functional theory (DFT) model. The mesopore volume was calculated by subtracting the micro-pore volume from the total volume. The parameters calculated from the isotherm diagrams ant t-plot are gathered in (Table 2).
Physicochemical characteristics of (APP).

Optimization study of operating conditions
Effect of pH on the adsorption of indigo carmine onto APP
The pH plays an important role in the adsorption process and particularly on the uptake capacity. It is observed that the percentage of IC removal decreases consistently with increasing pH (Figure 2), the maximum adsorption is obtained at pH = 2 the same result is obtained in the literature.
21
This optimum will be used for the isotherm plot. The pH effect on IC adsorption by (APP) can be explained on the basis of pH(zpc) (=5.23
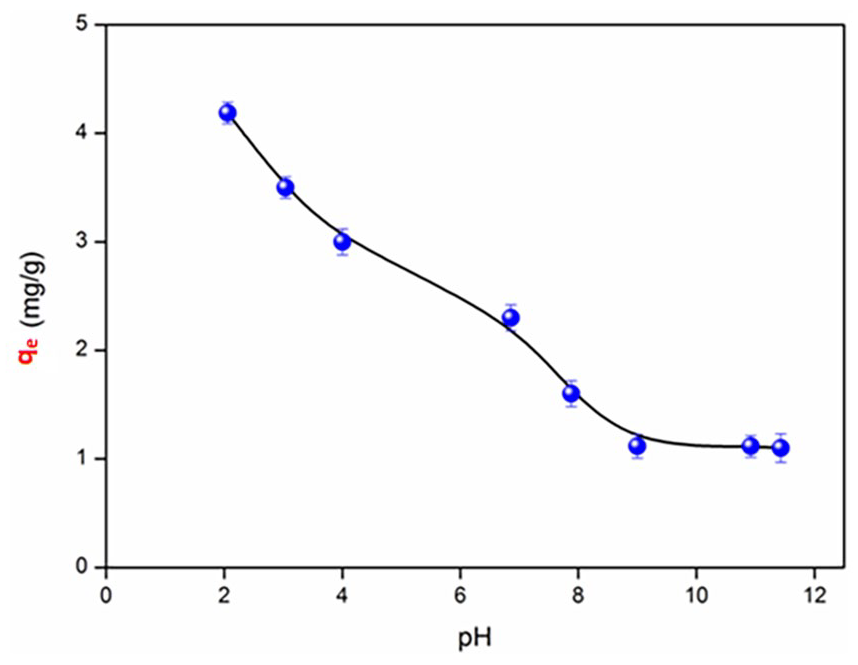
Evolution of the adsorption of IC dye onto (APP) as a function of pH.
Effect of initial dye concentration and contact time on the adsorption of indigo carmine
The adsorption capacity of IC increases over time and reaches a maximum after 45 min of contact time and thereafter, tends toward a constant value indicating that no more IC ions are further removed from the solution. The equilibrium time averages 45 min (Figure 3) but for practical reasons the adsorption is run up to 90 min. With raising the initial IC concentration (Co) from 10 to 60 mg/L, the amount of IC adsorbed increases from 8.37 to 56.64 mg/g. From these results, we can deduce that the IC adsorption onto (APP) is done in three stages:
Relatively, rapid speed adsorption of IC in solution due to the presence of the free sites on the adsorbent surface, which translates the linear increase of the adsorption capacity over time. This step lasts 10 min under the operating conditions.
The deceleration of the adsorption rate is reflected by a very small increase in the adsorption capacity due to the decrease in the quantity of IC in solution and the number of sites available for adsorption. This stage lasts 10–45 min.
The observed stability (45–60 min) of the adsorption capacity is presumably due to the almost total occupation of the available adsorption sites: the establishment of the level therefore reflects this stage.
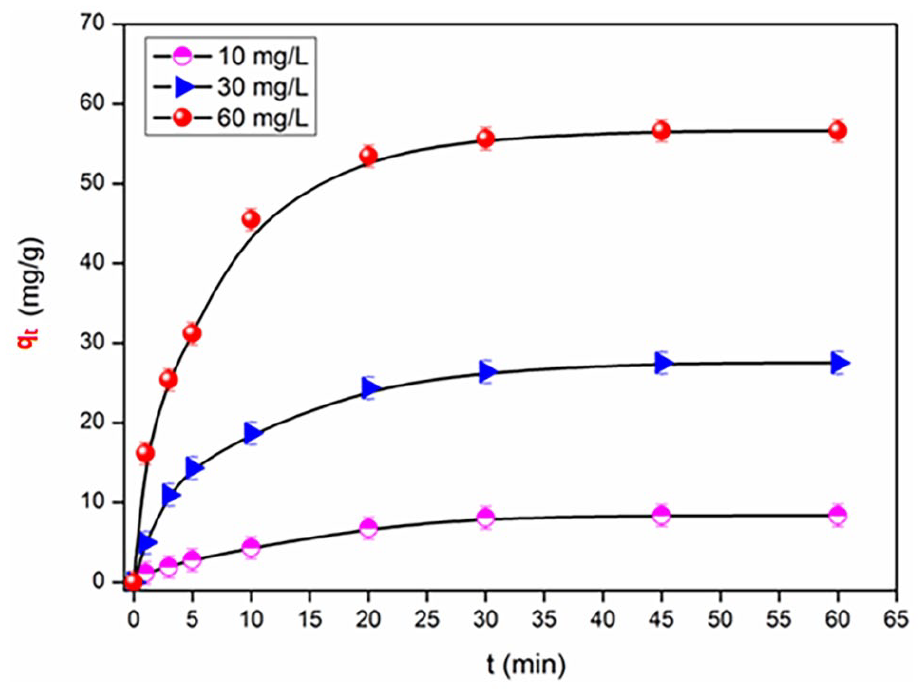
Evolution of the adsorption of IC dye onto (APP) as a function of time.
Effect of agitation speed on the adsorption of indigo carmine
The effect of the stirring speed in the range (100–600 rpm) on the adsorption capacity onto (APP) is also investigated. The optimal adsorption capacity is obtained for a speed of 300 rpm (Figure 4) which gives the best homogeneity of the mixture suspension. Therefore, a speed of 300 rpm is selected for further experiments.

Evolution of the adsorption of IC dye onto (APP) as a function of stirring speed.
Effect of adsorbent dosage on the adsorption of indigo carmine
The effect of adsorbent dose on the IC removal shows that this parameter influences the adsorption. It can be seen from the curve qt = f(adsorbent dose) that the adsorption capacity is inversely proportional to the adsorbent dose. Significant variations in the uptake capacity and elimination efficiency are observed at different adsorbent doses (1–10 g/L), indicating that the best performance is obtained for an adsorbent dose of 1 g/L (Figure 5), this optimal value is retained for the further experiments and isotherm plots.
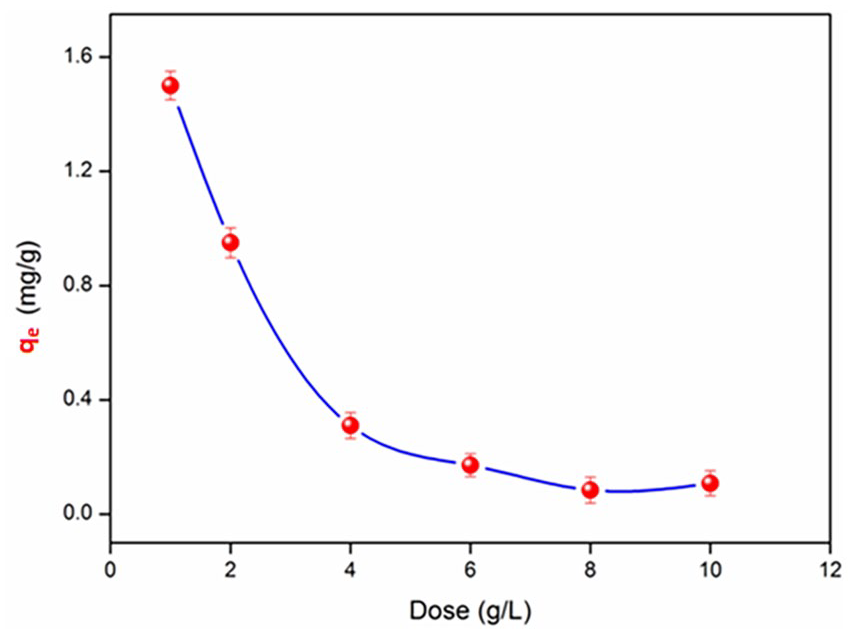
Evolution of the adsorption of IC dye onto (APP) as a function of adsorbent dose.
Adsorption equilibrium isotherms
The aim of this study was to understand the interaction dye/adsorbent through the validity of the models and also find parameters that allow for comparison, the interpretation and prediction of the adsorption data of APP. To assess the performance of adsorbent, different equations and isotherms exist, out of which the Langmuir, 22 Freundlich, 23 Temkin and Pyzhev, 24 and Elovich 25 isotherms were used that have been presented in Figure 6. Besides, the isotherm models were applied at optimal conditions of the parameters. The Langmuir model is the best known and most widely applied, it is represented by the non linear and linear forms:

Where Ce is the equilibrium concentration (mg/L), qmax the monolayer adsorption capacity (mg/g), and KL the constant related to the free adsorption energy (L/mg). The essential features of the Langmuir

Co is the initial concentration of the adsorbate in solution. The RL indicates the type of isotherm: irreversible (RL = 0), favorable (0 < RL < 1), linear (RL = 1), or unfavorable (RL > 1). In this study, the RL values are smaller than 1, thus confirming that the adsorption is favored in both cases as well as the applicability of the Langmuir isotherm.
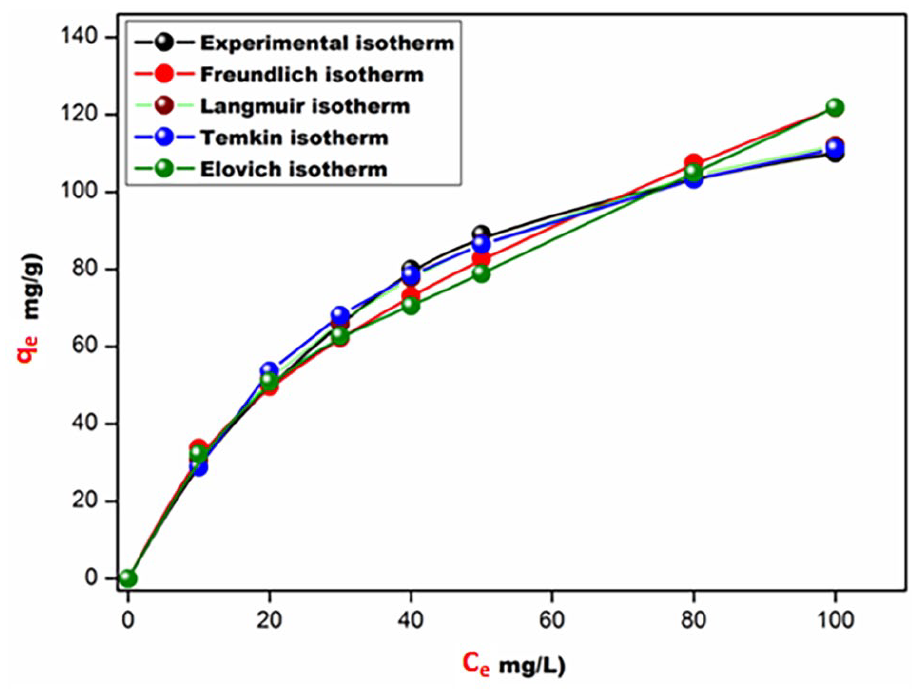
Isotherms for the different models at optimum conditions.
The Freundlich isotherm is valid for non ideal adsorption on heterogeneous surfaces as well as multilayer sorption.

The constant KF characterizes the adsorption capacity of the adsorbent (L/g) and n an empirical constant related to the magnitude of the adsorption driving force. Therefore, a plot lnqe versus lnCe enables the determination of both the constant KF and n.
The Temkin isotherm describes the behavior of adsorption systems on heterogeneous surfaces, and is applied in the following form:

The adsorption data are analyzed according to equation (6). Therefore, the plot versus qe versus lnCe enables to determine the constants AT and BT.
The Elovich isotherm is based on the principle of the kinetic, assuming that the number of adsorption sites augments exponentially with the adsorption; this implies a multilayer adsorption described by:

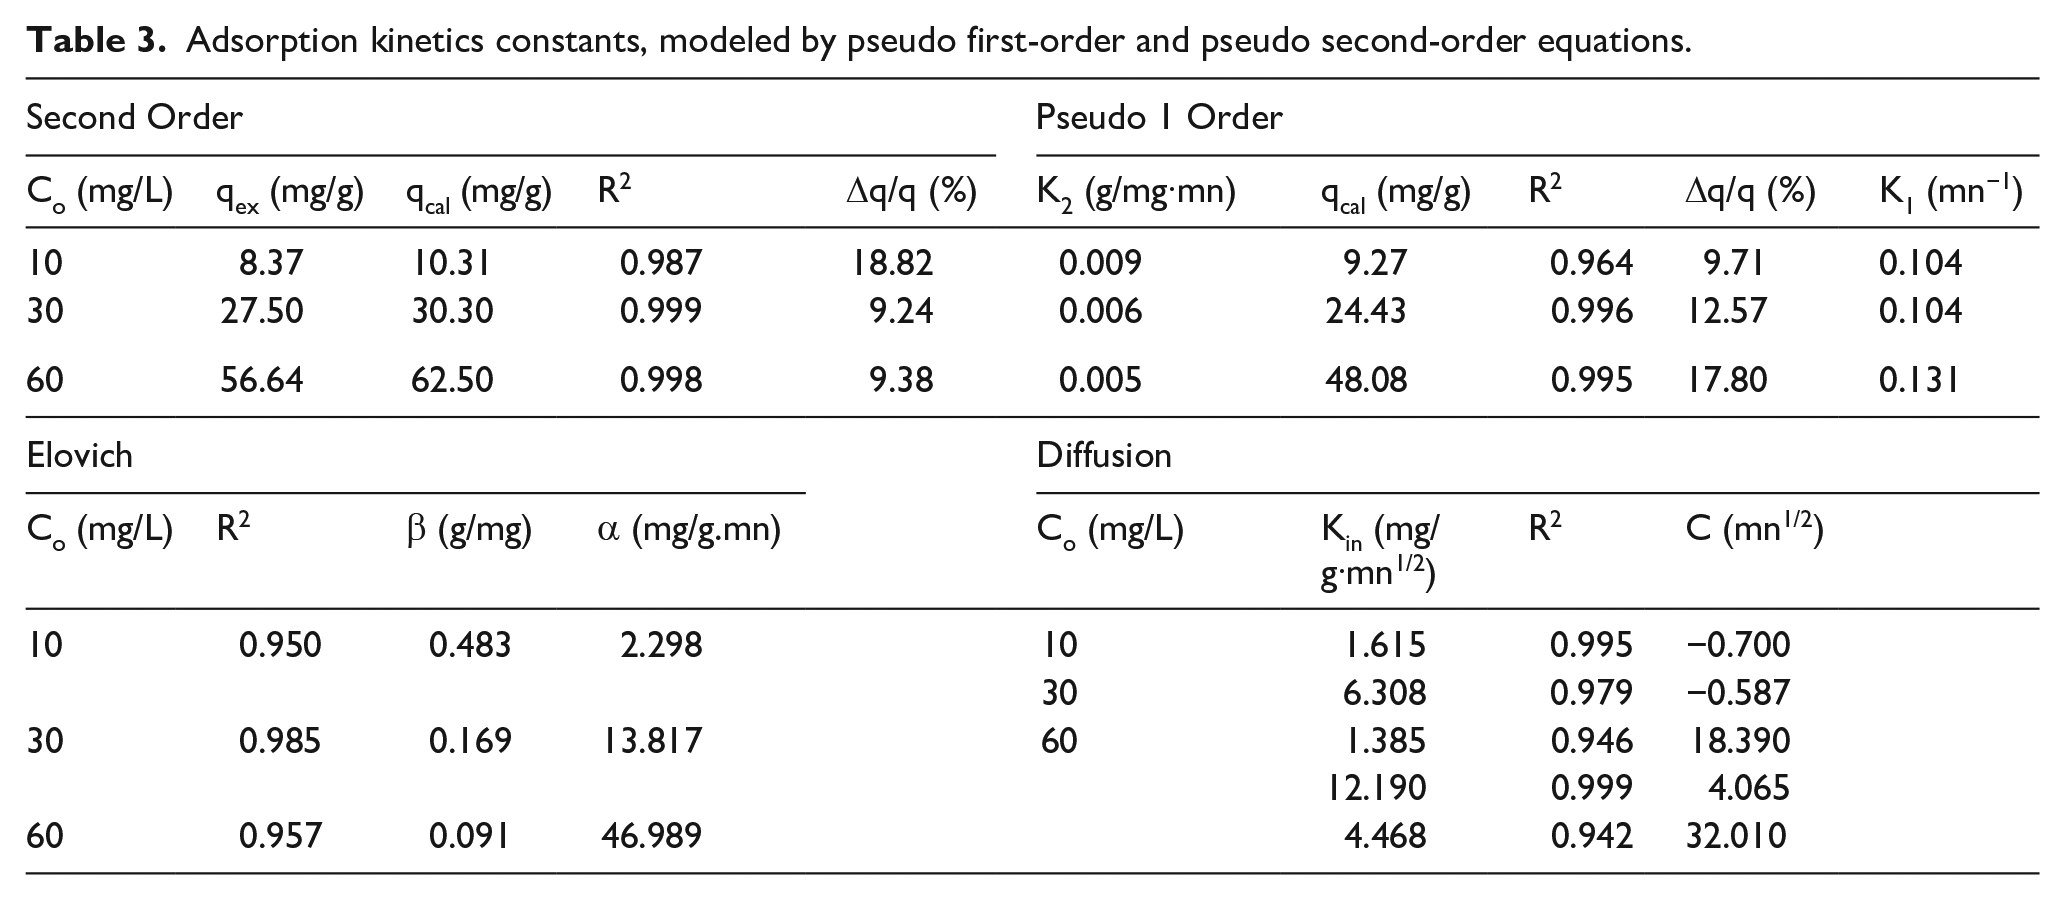
Where KE (L/mg) is the Elovich constant at equilibrium, qmax (mg/g) the maximum adsorption capacity, qe (mg/g) the adsorption capacity at equilibrium, and Ce (g/L) the concentration of the adsorbate at equilibrium. Both the equilibrium constant and maximum capacity is calculated from the plot of ln(qe/Ce) versus qe. The constants of the different models deduced after modeling are grouped in Table 3.
Adsorption kinetics constants, modeled by pseudo first-order and pseudo second-order equations.
Adsorption kinetic study
Analysis of adsorption kinetics is crucial to determine the operating conditions that are optimum for a full-scale batch process. It facilitates prediction of the adsorption rate and designing of adsorption processes. The kinetic study is important for the adsorption process because it describes the uptake rate of adsorbate, and controls the residual time of the whole process. Differents models were proposed to understand the behavior of adsorbents and to study the mechanisms controlling the adsorption. In this study, the experimental data of IC adsorption are examined using the pseudo-first and pseudo-second order kinetic model.
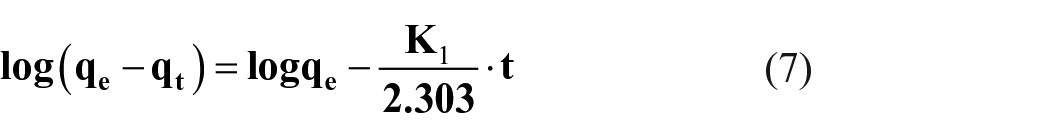
The former is given by the following equation 2 :
The pseudo second order model is expressed by the equation 26 :

Where qt (mg/g) is the amount of IC adsorbed on (APP) at the time t (min), K1 (min−1), and K2 (g/mg·min) the pseudo-first order and pseudo-second order kinetics constants respectively. The slope and intercept of the plots of ln(qe − qt) versus t was used to determine the first-order rate constants K1 and qe (Figure 7). The slope and intercept of the plot of t/qe versus t was used to determine the second-order rate constants K2 and qe (Figure 8). The rate constants, predict the uptakes. For the pseudo-first-order kinetic, the experimental data deviate from linearity, as evidenced from the low values of qe and Co. Therefore, the pseudo-first order model is inapplicable for the present system. By contrast, the correlation coefficient and qe,cal determined from the pseudo-second order kinetic model agree perfectly with the experimental data. The corresponding correlation coefficients for (APP) are summarized in Table 4. The applicability of the pseudo-second-order kinetic model suggests that the adsorption IC onto (APP) is based on chemical reaction (chemisorption), involving an exchange of electrons between adsorbent and adsorbate, In the chemisorption, the dye ions are attached to the adsorbent surface by chemical bond.

First-order kinetic model fit for the adsorption of IC dye onto (APP).

Pseudo-second-order model fit for the adsorption of IC dye onto (APP).
Parameters of the adsorption isotherms for IC dye onto (APP).

R2: determination coefficient; ΔQ: Temkin energy.
The Elovich equation is a kinetic equation related to the chemisorptions process. 27 This equation is often validated for systems where the surface of the adsorbent is heterogeneous. The linear form of the Elovich equation is given as follows:

Where α (mg/g·min) is the initial adsorption rate, and β (mg/g) is the relationship between the degree of surface coverage and the activation energy involved in the chemisorption.
The functional relationship common to most adsorption processes varies almost proportionally with t1/2, the Weber-Morris plot (qt vs t1/2) rather than with the constant time t. 28 Kin is the intraparticle diffusion rate constant. The intercept C gives an idea about the thickness of the boundary layer. This is due to the instantaneous utilization of the readily available adsorption sites on the surface. Kin and C are deduced from the slope and intercept of linear plots. It is well known that a performed batch experiment gives valuable data to evaluate the diffusion coefficients. Under real conditions, the mass transport resistance in the solid is larger than the external fluid film on the solid particles. Equaiton (10) shows the mathematical expression used to study this phenomenon.
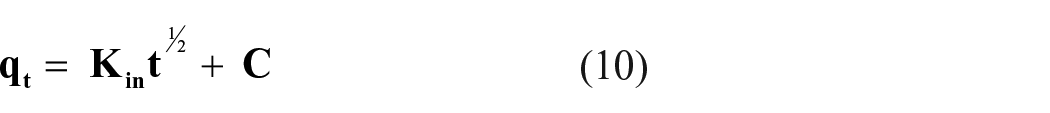
It is possible, from the plots of qt against t½, to distinguish three phases in the adsorption processes. These results imply the possibility that the adsorption processes involve more than a single kinetic stage. If intra-particle diffusion was involved in the adsorption, then a plot of qt against t½ would result in a linear relationship that allows calculation of the value of kin from the slope. The C intercept values give an idea of the boundary layer thickness, that is, the larger the intercept, the greater the effect of the boundary layer. The final stage corresponds to the equilibrium adsorption, when the dye molecules occupy all the active sites on the adsorbent. The values of kin were determined from the slopes of the respective linear plots and are presented in Table 4. The straight lines with higher slope values have larger kin and consequently a higher adsorption rate.
Effect of temperature
The adsorption capacity of (APP) increases with raising temperature over the range (298-308K), above, the vaporization becomes increasing problem The insights of the adsorption mechanism can be determined from the thermodynamic parameters: the free energy (ΔG°), the enthalpy (ΔH°) and the entropy (ΔS°). The thermodynamic equilibrium constant (K) was determined by Khan and Singh 29 by plotting ln(qe/Ce) versus qe and extrapolating to zero qe. Thermodynamic parameters are determined from the following equations.


Where, K is the equilibrium constant, Ce (mg/L) the concentration at equilibrium, T the absolute temperature (K). The plot of LnK versus 1/T (Figure 9) is linear; the values of ΔH° and ΔS° are obtained from the slope and intercept of the Van’t Hoff equation (equation (14)) while the free enthalpy ΔG° at various temperatures are reported in Table 5. The negative ΔG° indicates a not spontaneous process. The negative values of ΔH° and ΔS° show that the IC adsorption on (APP) is endothermic with an increased randomness at the solid solution interface

Regression of Van’t Hoff for thermodynamic parameters of IC adsorption on (APP).
Thermodynamic functions ΔG°, ΔS°, and ΔH° of IC adsorbed on the (APP).

Performance of the (APP)
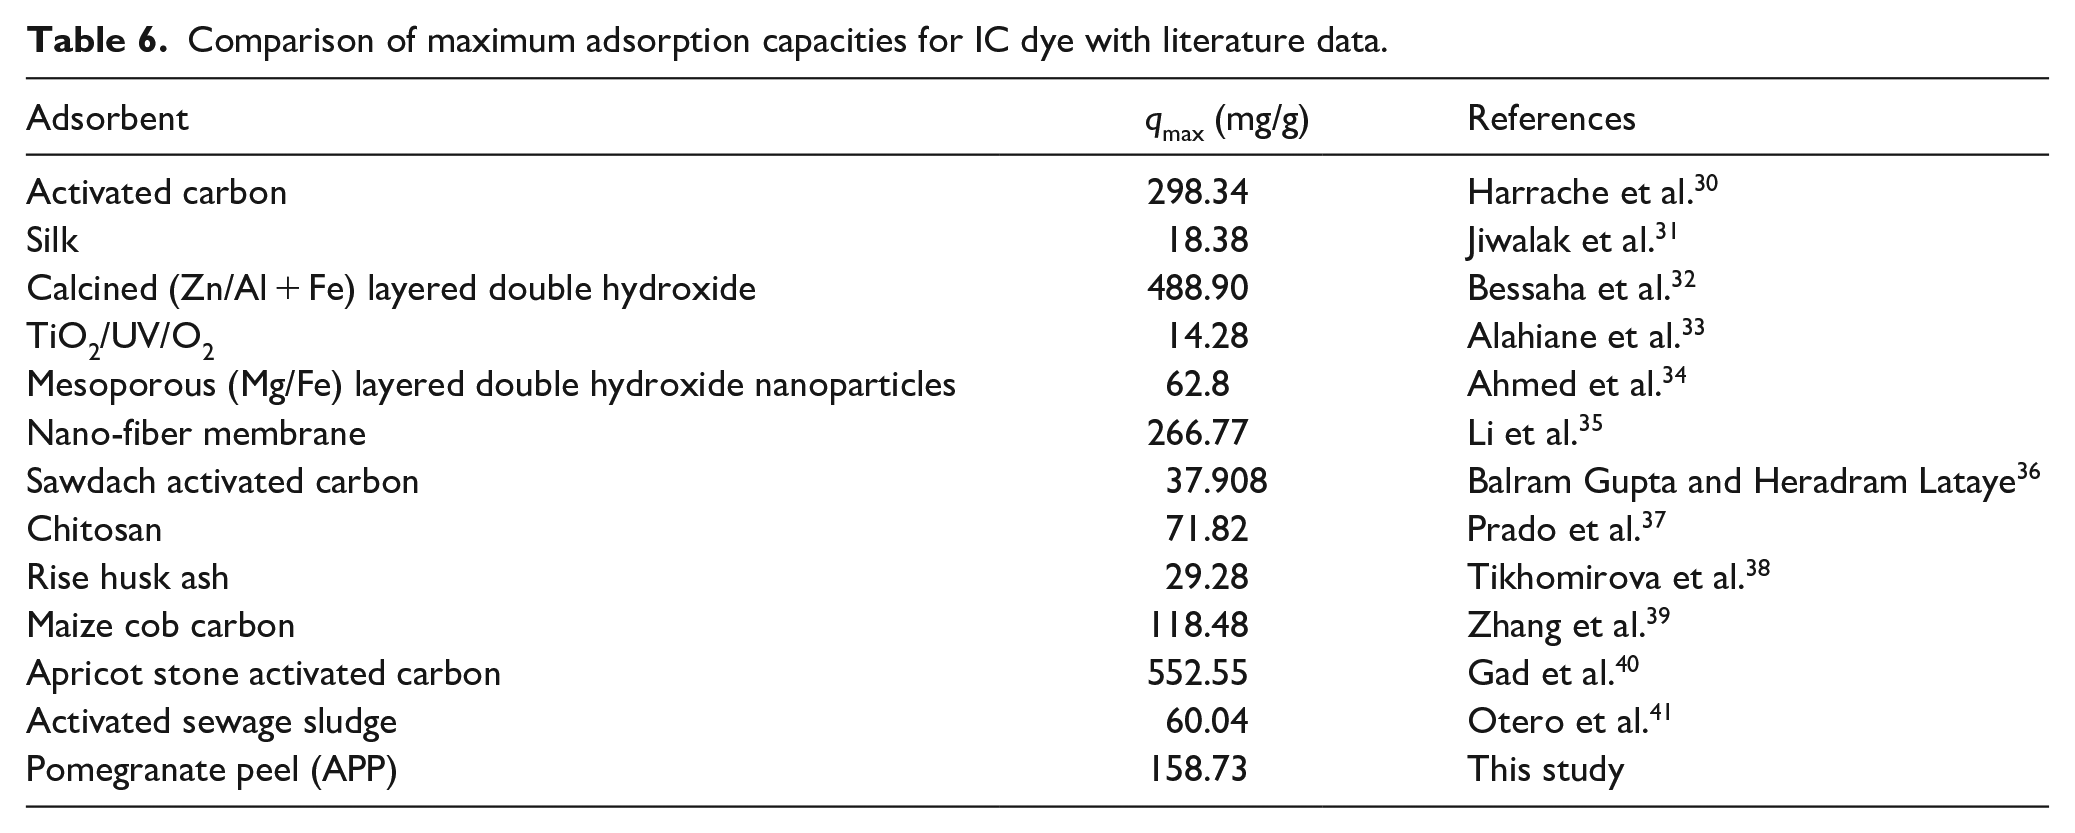
It is instructive for a comparative goal to report the adsorption capacity of some adsorbents reported in the literature. In Table 6, it’s given the different values of the Langmuir maximum adsorption capacity qmax of different adsorbent cited in previous works. We can see that the IC adsorption observed in the present study is well positioned with respect to other researches with a maximum adsorption capacity qmax of 158.36 mg/g at 298 K, relatively interesting compared to other adsorbents. The differences of the dye uptakes are due to the properties of each adsorbent like the structure, the functional groups, and the surface area. (APP) could be an attractive adsorbent for dyes owing to the isoelectric point (pHpzc). The desorption is an unavoidable process and is an intermediate stage toward the adsorbent regeneration. The latter is an essential tool to estimate the reutilization of any adsorbent for industrial applications, owing to the ecological concerns, and to needs for sustainable development. For the regeneration of the adsorbent several methods are distinguished and one can mention the electrochemical, microbiological, thermal, and chemical processes but we have opted for chemical regeneration because of its low economic cost. This study has given encouraging results, and we wish to carry out column adsorption tests under the conditions applicable to the treatment of industrial effluents and to test the homogeneous photodegradation of IC on the semiconductor is our main objective in the future. Preliminary tests were satisfactory; the experiments are currently under way and will be reported very soon in a next paper.
Comparison of maximum adsorption capacities for IC dye with literature data.
Conclusion
In this work, an experimental study on the utilization of (APP) for the removal of IC from aqueous solution was investigated. The potential of this (APP) was studied for decolonization of IC; the influence of the initial pH, dye IC concentration, contact time, adsorbent dose, stirring speed, and temperature on adsorption of IC was investigated.
The adsorption capacity of IC increased with increasing the initial dye concentration, while the optimized pH was found to be 2. The kinetics of IC removal indicated an optimum contact time of 45 min via a two stage of adsorption kinetic profile (initial fast and subsequent slow equilibrium).The IC adsorption APP follows a pseudo-second order kinetic model (R2 = 0.999) that relies on the assumption that the chemisorption may be the rate-limiting step and where the IC ions are attached to the adsorbent surface by forming chemical bonds and tend to find sites that maximize their coordination number with the surface.
The equilibrium adsorption data for IC on (APP) were analyzed by various models. The results indicate that the Langmuir isotherm provides the best correlation (qmax = 158.73 mg/g at 298 K). The negative ΔG° and ΔH° indicate that the adsorption of IC onto (APP) is spontaneous and exodothermic over the studied temperatures range indicated IC is strongly bonded to the adsorbent surface.
The comparison of the adsorption capacity of our adsorbent with others showed its attractive properties from both industrial and economic interests. This study has given encouraging results, and we wish to carry out column adsorption tests under the conditions applicable to the treatment of industrial effluents and to test the homogeneous photodegradation of IC on the TiO2 and SnO2 semiconductors is the future objective of this work.
Footnotes
Acknowledgements
The authors gratefully acknowledge support from University M’hamed Bougara of Boumerdes, Laboratory of Soft Technologies and Biodiversity, Faculty of Sciences.
Declaration of conflicting interests
The author(s) declared no potential conflicts of interest with respect to the research, authorship, and/or publication of this article.
Funding
The author(s) received no financial support for the research, authorship, and/or publication of this article.