
Abstract
This study investigates the potential use of activated carbon, prepared from pomegranate peels, as an adsorbent activated using H3PO4 and its ability to remove crystal violet from an aqueous solution. The adsorbent was characterized by the Brunauer–Emmett–Teller method (specific surface area: 51.0674 m2 g−1) and point of zero charge (pHPZC = 5.2). However, some examined factors were found to have significant impacts on the adsorption capacity of activated carbon derived from pomegranate peels such as the initial dye concentration (5–15 mg L−1), solution pH (2–14), adsorbent dose (1–8 g L−1), agitation speed (100–700 r/min), and temperature (298–338 K). The best adsorption capacity was found at pH 11 with an adsorbent dose of 1 g L−1, an agitation speed at 400 r/min, and a contact time of 45 min. The adsorption mechanism of crystal violet onto activated carbon derived from pomegranate peels was studied using the pseudo-first-order, pseudo-second-order, Elovich, and Webber–Morris diffusion models. The adsorption kinetics were found to rather follow a pseudo-second order kinetic model with a determination coefficient (R2) of 0.999. The equilibrium adsorption data for crystal violet adsorbed onto activated carbon derived from pomegranate peels were analyzed by the Langmuir, Freundlich, Elovich, and Temkin models. The results indicate that the Langmuir model provides the best correlation with qmax capacities of 23.26 and 76.92 mg g−1 at 27°C and 32°C, respectively. The adsorption isotherms at different temperatures have been used for the determination of thermodynamic parameters like the free energy, enthalpy, and entropy to predict the nature of adsorption process. The negative values ΔG0 (−5.221 to −1.571 kJ mol−1) and ΔH0 (−86.141 kJ mol−1) indicate that the overall adsorption is spontaneous and exothermic with a physisorption process. The adsorbent derived from pomegranate peels was found to be very effective and suitable for the removal of reactive dyes from aqueous solutions, due to its availability, low-cost preparation, and good adsorption capacity.
Introduction
There are thousands of various chemicals and toxic substances in effluents discharged from industries. These include organic and inorganic pollutants, which can cause deoxygenation by promoting microbial activity, or substances that are directly toxic to the life-forms in the aquatic system. Therefore, treating such wastewaters is of utmost importance. Organic dyes constitute one of the larger groups of pollutants in wastewater released mainly from the textile industry. The discharge of colored wastewaters into the ecosystem causes environmental problems like aesthetic pollution and perturbation of aquatic life, clearly apparent even at low amounts. The water pollution is an undesirable environmental problem in the world that requires urgent solutions. The aquatic environment is a favorable site to dump complicated human and industrial wastes1–3 causing an increase in pollution and threatens both the environment as well as human health.4–6 Therefore, the removal of toxic dyes from the environment is an important challenge. Ideally, the removal process must be simple, effective, and inexpensive. Several strategies have been suggested to remove dyes from wastewaters, including biological and physical–chemical processes.3,7–12 However, the adsorption has been proven as a most effective and reliable method for the dye removal. Its major advantages for the control of water pollution are less investment in terms of initial development cost, simple design, facile operations, free from generation of toxic substances, and easy and safe recovery of the adsorbent as well as adsorbate materials. 13 Activated carbons are widely used as adsorbents in the wastewater treatment which enable the adsorption of both cationic and anionic pollutants. 14 Recently, the use of agricultural wastes as activated carbon precursors has been found to be renewable and relatively less expensive. Therefore, in recent years research has been focused on the activated carbon based on agricultural waste and lignocelluloses materials which are effective and inexpensive such as date pits, 15 coconut shell, 16 and apricot stone. 17 Physical and chemical activations are the common methods for the production of activated carbons. It is possible to activate carbon in the presence of activating agents such as K2CO3, ZnCl2, H3PO4, and KOH. 18 Activated carbons are famous because they possess outstanding adsorption characteristics due to their improved pore structures and are used for the treatment of industrial wastewaters due to their efficiency and economic feasibility. The ability of activated carbons to adsorb pollutants from aqueous solutions depends on two major factors: experimental conditions of the activation processes and the nature of organic material utilized for the preparation of activated carbon.19–22 In this study, it was necessary to understand how the dye crystal violet (CV) interacts with the adsorbent and to describe the processes involved for the discoloration. For this purpose, we carried out a parametric study of the adsorption, by studying the effect of significant parameters on the decolorizing power like the contact time, adsorbent dose, the pH, stirring speed, and temperature. In this respect, experiments are undertaken for determining the role of these parameters. Furthermore, the adsorption isotherms data were modeled by applying known models. The performances of activated carbon derived from pomegranate peels (ACPP) on dye adsorptions were evaluated using the equilibrium, kinetic, and thermodynamic studies.
Materials and methods
Preparation of dye solution
CV (hexamethyl pararosaniline chloride, Basic violet, Gentian violet) is a cationic dye (purity ⩾ 96.0%), was used as a surrogate indicator to simulate the industrial wastewater to evaluate the adsorption capacity of ACPP. The characteristics and molecular structure of CV (chemical formula is C25H30ClN3) with color index C.I. 42555 are illustrated in Table 1. The molar weight of CV is 407.979 g mol−1, while the International Union of Pure and Applied Chemistry (IUPAC) name is [4-[bis[4-(dimethylamino)phenyl]methylidene]cyclohexa-2,5-dien-1-ylidene]-dimethylazanium;chloride. 23 This cationic dye presents high water solubility at 298 K (4 g L−1) and is positively charged on the nitrogen atom. CV was purchased from Merck (India) Ltd. Stock solution of CV was prepared by dissolving 0.1 g of accurately weighed CV in 1 L of distilled water to obtain 100 mg L−1 dye solutions. The solution was then diluted to prepare standard solutions of different initial concentrations (C0). The CV concentration was measured in the UV spectrophotometer at the maximum wavelength (λmax = 590 nm) using UV–Vis spectrophotometer (UV 2300). The initial pH of CV solutions was adjusted using dilute HCl and NaOH solutions. When dissolved in water, CV has a blue-violet color with an extinction coefficient of 87.000 M−1 cm−1. The color of the dye depends on the acidity of the solution. At a pH 1, the dye is green with absorption maxima at 420 and 620 nm, while in a strongly acidic solution (pH −1.0), the dye turns to yellow with an absorption maximum at 420 nm.
Physicochemical characteristics of ACPP.
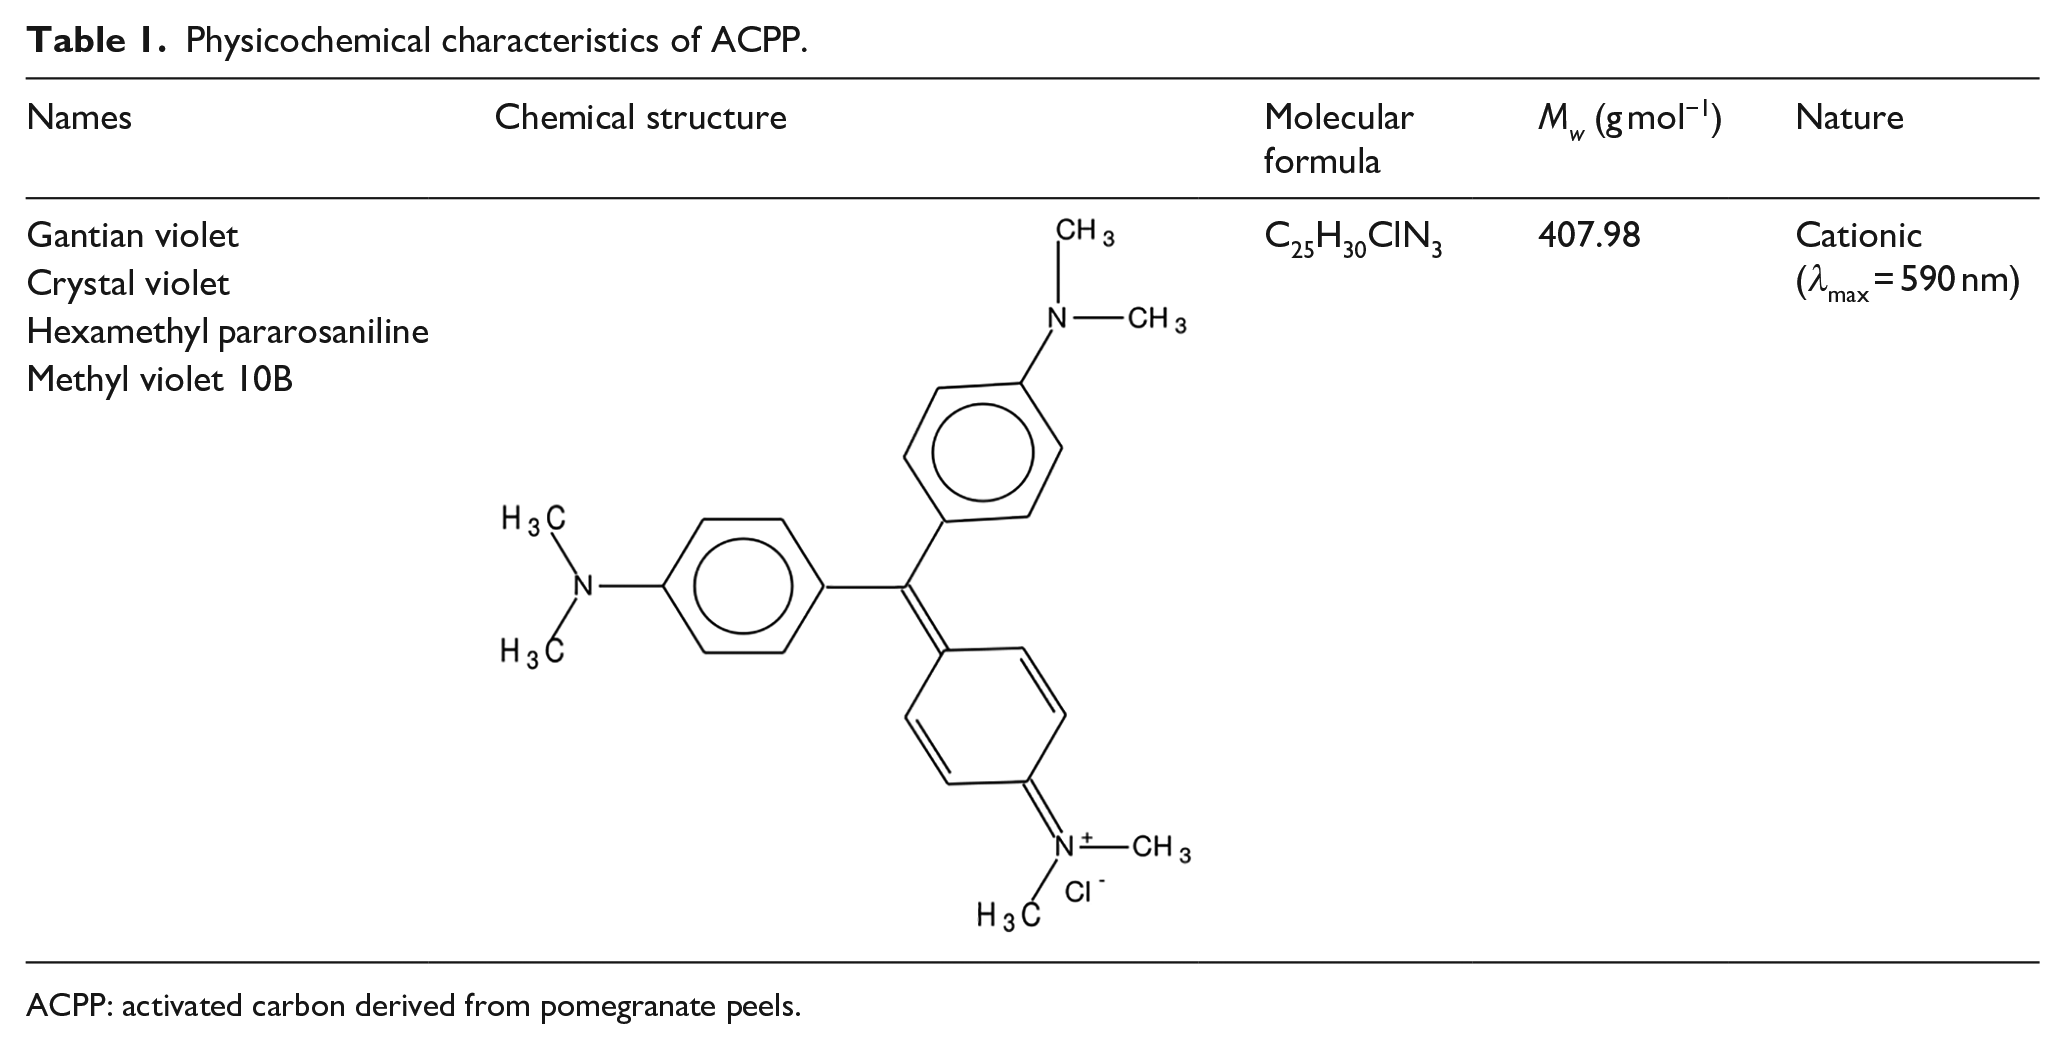
ACPP: activated carbon derived from pomegranate peels.
Preparation of activated carbon
The activated carbons were prepared from pomegranate peels. At first, the precursor was thoroughly washed using distilled water and dried in an air oven at 120°C; such protocol was effective to facilitate the crushing and grinding. A fraction particle size between 0.5 and 1 mm was used for the preparation of activated carbons by impregnation using H3PO4 (purity 85%).
The precursor was activated with a chemical agent in a solid form. The impregnated precursor was carbonized in a horizontal tubular furnace under N2 flow with a heating rate of 5°C min−1to allow free evolution of volatiles, up to the hold temperature for 1 h.
The resulting activated carbon was immersed in HCl (37%, density: 1.18 g mL−1) solution under reflux ebullition (3 h) to extract the resultant compound and excess reagent. Then, the solution was filtered and the black solid was washed using hot distilled water. The adsorbent was dried at 120°C, and kept in tightly closed bottles until use. The activated carbons prepared from pomegranate peels were named as ACPP.
Adsorption experiments
The effects of the initial CV concentration C0 (5–15 mg L−1), solution pH (2–14), adsorbent dose (1–8 g L−1), agitation speed (100–700 r/min), and temperature (298–338 K) on the CV adsorption were investigated in batch configuration for variable specific periods (0–90 min). The CV solutions were prepared by dissolving the accurate amount of CV (99%) in distilled water, used as stock solution, and diluted to the required concentration; pH was adjusted using HCl (0.1 mol L−1) or NaOH (0.1 mol L−1) purity 99%. For the kinetic studies, desired quantities of ACPP were treated with 10 mL of CV solutions in Erlenmeyer flasks and placed in a rotary shaker at 300 r/min, the aliquots were withdrawn at regular times and subjected to centrifugation at 3000 r/min (10 min). The remaining CV concentration was titrated on a Perkin Elmer UV–Vis spectrophotometer model 550S at (λmax = 590 nm). The amount of CV adsorbed qt (mg g−1) by ACPP was calculated from the following relation

where C0 is the initial CV concentration and Ct the CV concentrations (mg L−1) at time (t), V the volume of solution (L), and m the mass of ACPP (g).
Error functions
The linear regression is one of the most viable tool defining the best fitting relationship quantifying the distribution of adsorbates, mathematically analyzing the adsorption systems, and verifying the consistency and theoretical assumptions of an isotherm model. Due to the inherent bias resulting from the transformation which goes toward the diverse form of parameters estimation errors and fits mathematically several rigorous error functions. Because of the inherent bias resulting from linearization of isotherm models, the non-linear regression root mean square error (RMSE) Equation (2), the sum of error squares (SSE) Equation (3), and chi-squares (χ2) Equation (4) test are used as criteria for the fitting quality. The smaller RMSE value indicates the better curve fitting


where qe,exp (mg g−1) is the experimental value of uptake, qe,cal is the calculated value of uptake using a model (mg g−1), and N is the number of data points in the experiment. The smaller RMSE value indicates the better curve fitting.
Effect of different parameters of the adsorption processes
The initial CV concentrations (5, 10, and 15 mg L−1) were tested at different pH values, temperatures, stirring speeds, and adsorbent doses. The effect of pH on the rate of color removal was analyzed at pH values (2, 6, 8, 10, and 12) at 26°C, 150 r/min, 1 mg of ACPP, and 10 mL of CV concentration (5–15 mg L−1). The pH was adjusted using 0.1 N NaOH and 0.1 N HCl solutions using an Orion 920A pH-meter with a combined pH electrode, standardized using National Bureau of Standards (NBS) buffers before every measurement. The effect of adsorbent dose was studied by agitating different masses (0.01–0.08 g), at 26°C, 150 r/min, 0.01 mg of ACPP, and 10 mL of CV concentration (5–15 mg L−1). The effect of temperature on the adsorption capacity of ACPP was carried out at 20°C and 32°C in a constant temperature bath using a natural solution of pH 11, 400 r/min, contact time 45 min, 1 mg of ACPP, and 10 mL of dye concentration (5–15 mg L−1).
Results and discussion
Characterization of the ACPP adsorbent
Brunauer–Emmett–Teller surface area and pore size
The surface area of sample clay was determined by Brunauer–Emmett–Teller (BET) method using Quantachrome Asi Quin, Automated Gas Sorption Analyzer Quantachrome Instrument Version 2.02. The specific surface area and pore structure of the activated carbons were characterized by N2 adsorption–desorption isotherms at −196°C using the ASAP 2010 Micromeritics equipment, this isotherm is identical to type II at low pressures. The specific surface area was determined by the BET equation. The external surface area, micropore area, and micropore volume were calculated by the t-plot method. The total pore volume was evaluated from the liquid volume of N2 at high relative pressure near unity 0.99. The mesopore volume was calculated by subtracting the micro-pore volume from the total volume. The pore size distribution (PSD) was determined using the density functional theory (DFT) model (Table 2).
Physical characteristics of ACPP.

Determination of the point of zero charge (pHPZC)
The determination of the point of zero charge (pHPZC) was conducted to investigate how the surface charge of ACPP adsorbent depends on pH. pHPZC of the activated carbon was determined using the procedure described elsewhere. 24 0.01 M of NaCl was prepared and the initial pH was adjusted between 2 and 12 using HCl or NaOH solution (0.1 M). 50 mL of NaCl solution was placed in Erlenmeyer flasks along with 0.1 g of adsorbent. The flasks were kept under agitation (150 r/min, 48 h), and the final pH of the solution was measured. The intersection point of the curves pHfinal versus pHinitial and the bisector were taken as pHPZC.
Optimization of analytical parameters
Effect of pH
The pH of the solution is one of the most sensitive parameters in the absorption capacity. It can be seen that when the pH of the solution increases the adsorption capacity increases (Figure 1).

Evolution of the adsorption of CV dye onto ACPP as a function of pH.
The effect of pH on CV adsorption on ACPP can be explained on the basis of pHpzc. Negative surface charges (ACPP) predominate above pHzpc which favors cations fixation due to electrostatic attraction forces. However, below pHZPC, the positive charges predominate, and favors anion fixation. Thus, repulsive forces occur between the cations and the adsorbent (ACPP) as the pH of the solution increases, the number of negative charges increase and promotes adsorption of CV by electrostatic attraction. The figure shows that at a pH 11 the maximum adsorption is obtained, which allows us to retain this as optimum pH for the rest of the parametric study.
Effect of initial dye concentration and contact time
The adsorption capacity of CV increases over time to reach a maximum after 60 min of contact time and then reaches a constant value indicating that no further CV ions are removed from the solution. The average equilibrium time is 60 min, but for practical reasons, adsorption experiments can last up to 90 min. The CV adsorption increases from 4.15 mg g−1 (for 5 mg L−1 of CV) to 13.80 mg g−1 for (15 mg L−1 of CV; Figure 2) and from these results, we can deduce that the adsorption on ACPP involves the following three steps:
(a) Relatively rapid adsorption of CV in solution due to the presence of free sites on the surface of the adsorbent particles, which reflects the linear increase in adsorption capacity over time. This step lasts 15 min under the intended conditions of use.
(b) Reduction in adsorption rate resulting in a small increase in adsorption capacity due to the decrease in the amount of CV in solution and the number of sites available for adsorption. This step lasts from 20 to 25 min.
(c) The stability of the adsorption capacity is observed from 60 min; this is probably due to the almost total occupancy of the available adsorption sites, which results in a level.

Evolution of the adsorption of CV dye onto ACPP as a function of time.
The CV ions are adsorbed initially on the external surface area of ACPP which makes the adsorption rate easy and fast. When the external surface is saturated, the CV ions entered inside the pores and absorb on the internal surface of the particles and such phenomenon takes relatively longer time. This may be attributed to an increased driving force due to the concentration gradient with increasing C0 to overcome the mass transfer resistance of CV ions between the aqueous and solid phases. Therefore, a higher concentration C0 increases the adsorption capacity; the same result is obtained in the literature. 25
Effect of agitation speed
The effect of the stirring speed in the range (100–700 r/min) on the adsorption capacity of CV on ACPP is also studied. The optimal adsorption capacity is obtained at 400 r/min (Figure 3), which gives the best homogeneity of the mixture suspension. Above 700 r/min, a desorption phenomenon occurs. Therefore, a rotational speed of 400 r/min is selected for subsequent tests.
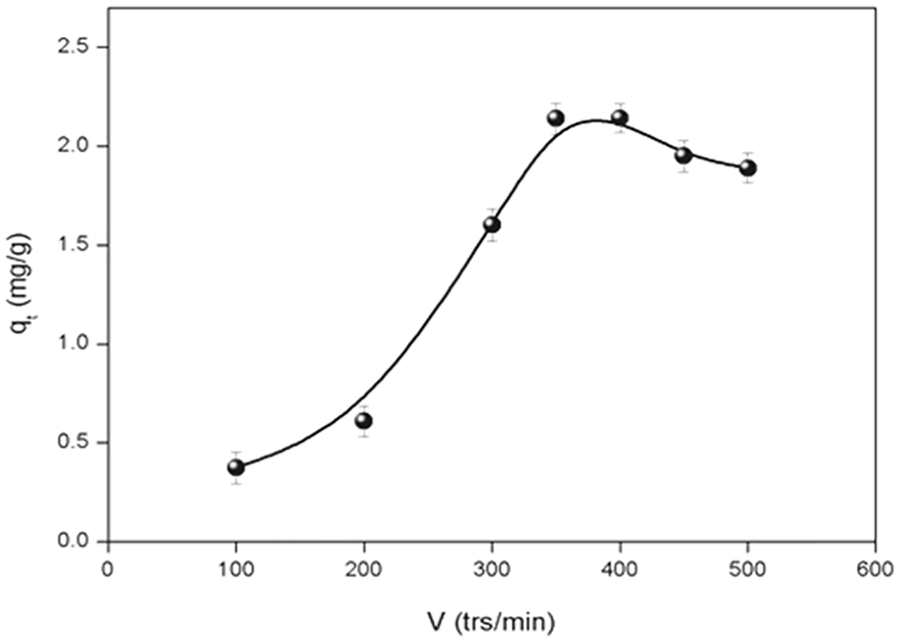
Evolution of the adsorption of CV dye onto ACPP as a function of stirring speed.
Effect of adsorbent dosage
The effect of the adsorbent dose on the removal efficiency of the CV dye is shown in Figure 4. It can be seen that the adsorbed amount of CV increases as the adsorbent dosage ACPP decreases, as the number of active sites to which the dye molecules can bind decreases. The maximum adsorption rate (1.08 mg g−1) is obtained for an optimal adsorbent dosage of 1 g L−1and an initial CV concentration C0 of 5 mg L−1 in (CV) at a free pH. This optimal adsorbent dose will be used for the next parametric study.

Evolution of the adsorption of CV dye onto ACPP as a function of adsorbent dose.
Adsorption kinetic study
To elucidate the CV adsorption on ACPP, particularly, the potential rate controlling step, the dye adsorption data were analyzed using the pseudo-first-order, pseudo-second-order, intra-particle diffusion, and Elovich models, which are described in the following.
The pseudo-first order equation 26 is given in Equation (5)

The pseudo-second-order model 27 is expressed by Equation (6)

For the pseudo-second-order, the initial adsorption rate h (mg g−1 min−1) is expressed by Equation (7)

where qt (mg g−1) is the amount of CV adsorbed on ACPP at the time t (min); K1 (min−1) and K2 (g mg−1 min−1) are the pseudo-first-order and pseudo-second-order kinetic constants, respectively. The slope and intercept of the plots of ln(qe − qt) versus t was used to determine the constants K1 and qe while the slope and intercept of the plot of t/qe versus t was used to determine the constants K2 and qe. The rate constants predict the uptakes and the corresponding correlation coefficients for ACPP are summarized in Table 3. For pseudo-first-order kinetic (Figure 5), the experimental data deviate from linearity, as evidenced from the low values of qe and C0. Therefore, the pseudo-first-order model is inapplicable for the present system. By contrast, the correlation coefficient and qe, cal determined from the pseudo-second-order kinetic model are in good agreement with the experimental data (Figure 6). The applicability of the pseudo-second-order kinetic model suggests that the CV adsorption onto ACPP is based on chemical reaction, involving an exchange of electrons between adsorbent and adsorbate. In chemisorption, the dye ions are attached on the adsorbent surface by chemical bond and tend to find sites that maximize their coordination number on the surface. Prediction of the rate-limiting step is also an important factor to be considered in the adsorption process. Therefore, the kinetic results were analyzed by the intra-particle model, which is expressed as Weber and Morris 28 Equation (8)

where kin (mg g−1 min1/2) is the rate constant for intra-particle diffusion and C represents the thickness of the boundary layer. To further investigate the kinetic data obtained at different adsorbate concentrations and also to evaluate the diffusion mechanism, the intra-particle diffusion model was employed. The plot qt versus t1∕2 (Figure 7) gave a straight line at different adsorbate concentrations from which kin, C, and R2 were determined. The computed values for intra-particle diffusion rate constant C, kin (mg g−1 min1/2), and R2 are also presented in Table 3. In this case, the intra-particle diffusion model cannot be regarded as rate-limiting step; R2 values for intra-particle model are smaller than those of pseudo-second-order kinetic model (Table 2). However, the plots (qt vs t1∕2) are linear and this is an indication that the intra-particle diffusion plays a key role in the adsorption of CV onto activated carbon. If C is zero then intra-particle diffusion is the sole rate-limiting step, and the larger the value of C the greater the contribution of surface adsorption. In addition, it is obvious that both the surface adsorption and intra-particle diffusion participated in the rate-limiting step. 29 The Elovich equation is a kinetic equation related to the chemisorption. 30 This equation is often validated for systems where the surface of the adsorbent is heterogeneous. The linear form of the Elovich equation is given as follows
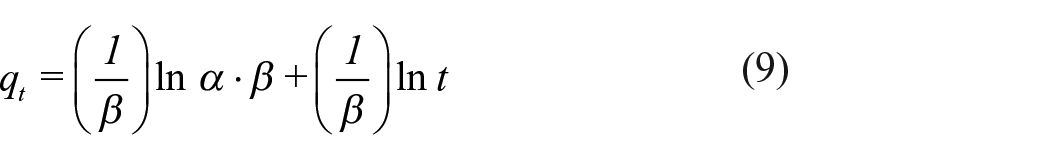
where α (mg g−1 min−1) is the initial adsorption rate and β (mg g−1) is the relationship between the degree of surface coverage and the activation energy involved in the chemisorption.
Pseudo-first-order, pseudo-second-order, Elovich, and intra-particle models constants and determination coefficients for CV adsorption onto ACPP.

CV: crystal violet; ACPP: activated carbon derived from pomegranate peels.
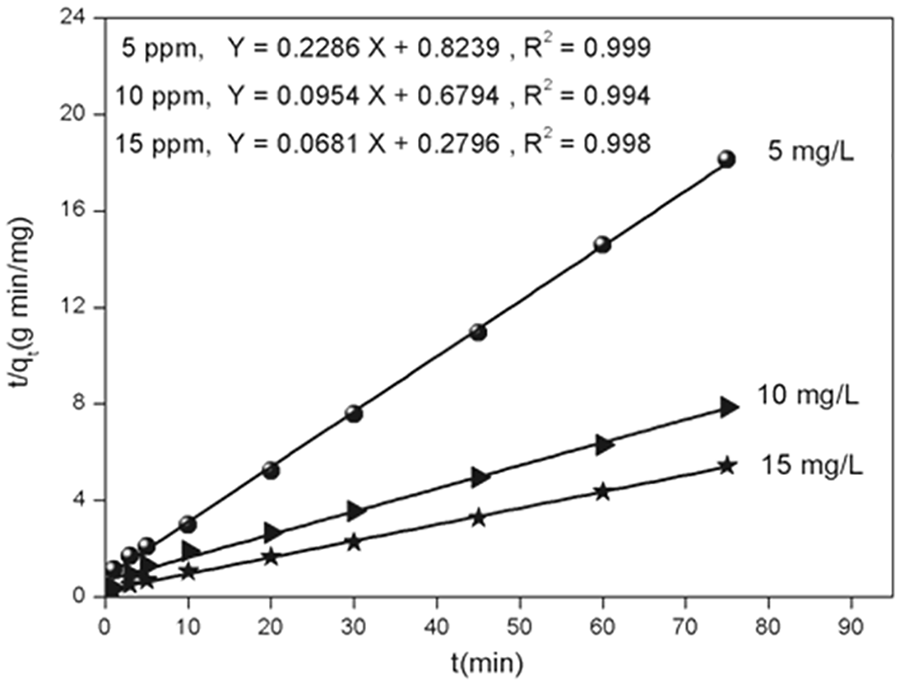
Pseudo-second-order model fit for the adsorption of CV dye onto ACPP.
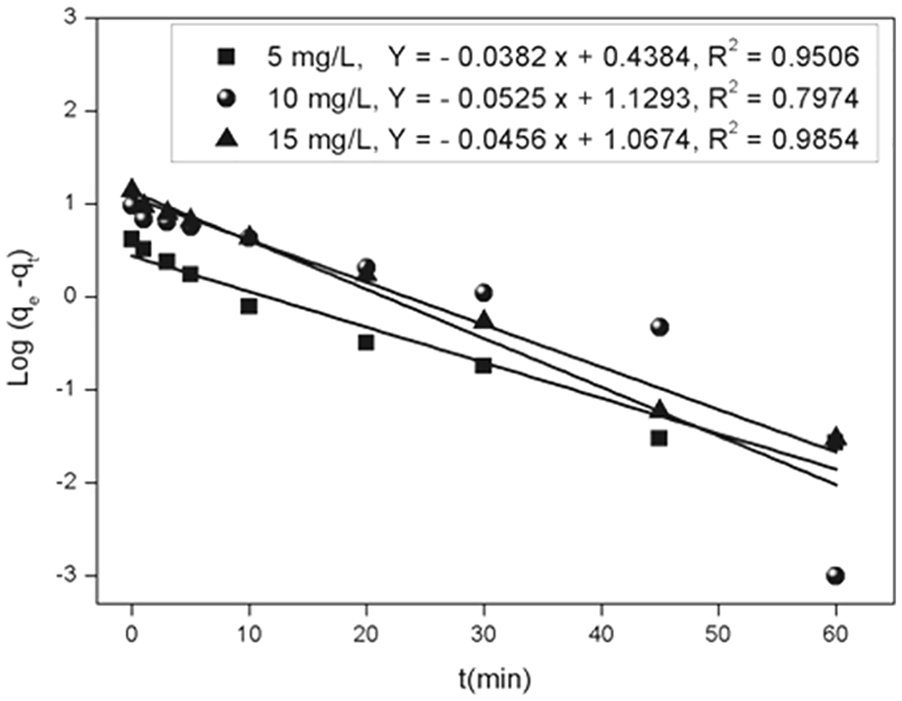
First-order kinetic model fit for the adsorption of CV dye onto ACPP.

Determination of intra-particle diffusion model constants.
Adsorption isotherms
The aim of this study was to understand the CV/adsorbent interaction through the validity of the models and also to find parameters that allow for comparison, interpretation, and prediction of the CV adsorption data (Figure 8).

Adsorption isotherms of CV dye onto ACPP at different temperatures.
Several isotherm equations are available and three important isotherms were applied to fit the equilibrium data of this study namely the Langmuir, Freundlich, and Temkin isotherms. The Langmuir 31 model assumes monolayer coverage of adsorbate on a homogeneous surface of adsorbent. Graphically, the Langmuir isotherm is characterized by a plateau. Therefore, at equilibrium, the saturation point is reached when the adsorption cannot occur. It occurs at specific sites on the homogeneous adsorbent surface. Once a dye molecule occupies a site, there can be no absorption there. A well-known linear expression for the Langmuir isotherm is shown as follows

where Ce is the equilibrium concentration (mg L−1), qmax the monolayer adsorption capacity (mg g−1), and KL the constant related to the free adsorption energy (Langmuir constant, L mg−1). Equilibrium parameter for Langmuir isotherm called separation factor (RL) was expressed as Equation (11). The values indicate the shape of the isotherm; where, RL > 1 is unfavorable, RL = 1 is linear, RL = 0 is irreversible, and finally 0 < RL < 1 is favorable

The Freundlich 32 isotherm is an empirical equation which is applicable to adsorption on heterogeneous surfaces and is not restricted to the formation of a monolayer. It is assumed that an increase in the adsorbate concentration also increases the amount adsorbed on the surface of the adsorbent. The Freundlich isotherm can be expressed in its linear form as follows

where KF is the constant indicative of the adsorption capacity of the adsorbent (L g−1) and 1/n constant related to the adsorption intensity of dye onto the ACPP. For a suitable adsorption system, 1/n value varies between 0 and 1. Temkin and Pyzhev 33 considered the effects of some indirect/adsorbent interactions in the adsorption isotherm and suggested that these interactions are due to the heat of adsorption of all molecules in the layer which decreases linearly with coverage. The Temkin and Pyzhev isotherm can be expressed in its linear form as follows

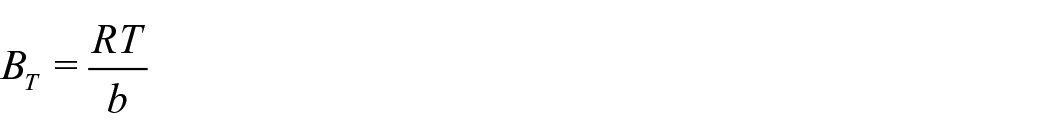
The constant BT (L mg−1) is related to the heat of adsorption, AT (mg L−1) a constant, b (J mol−1) the energy constant of the Temkin isotherm. The calculated parameter characteristics of each isotherm model are given in Table 4. It can be seen from the results that the Langmuir isotherm fits better than those of Freundlich and Temkin with higher determination coefficients of R2 value closer to unity than the other models, and the smaller RMSE, χ2 values indicate the better curve fitting. For all studied temperatures, we can note that the evolution of RL lies between 0 and 1, indicating that the CV adsorption onto ACPP is favorable.
Parameters of the adsorption isotherms for CV dye onto ACPP.
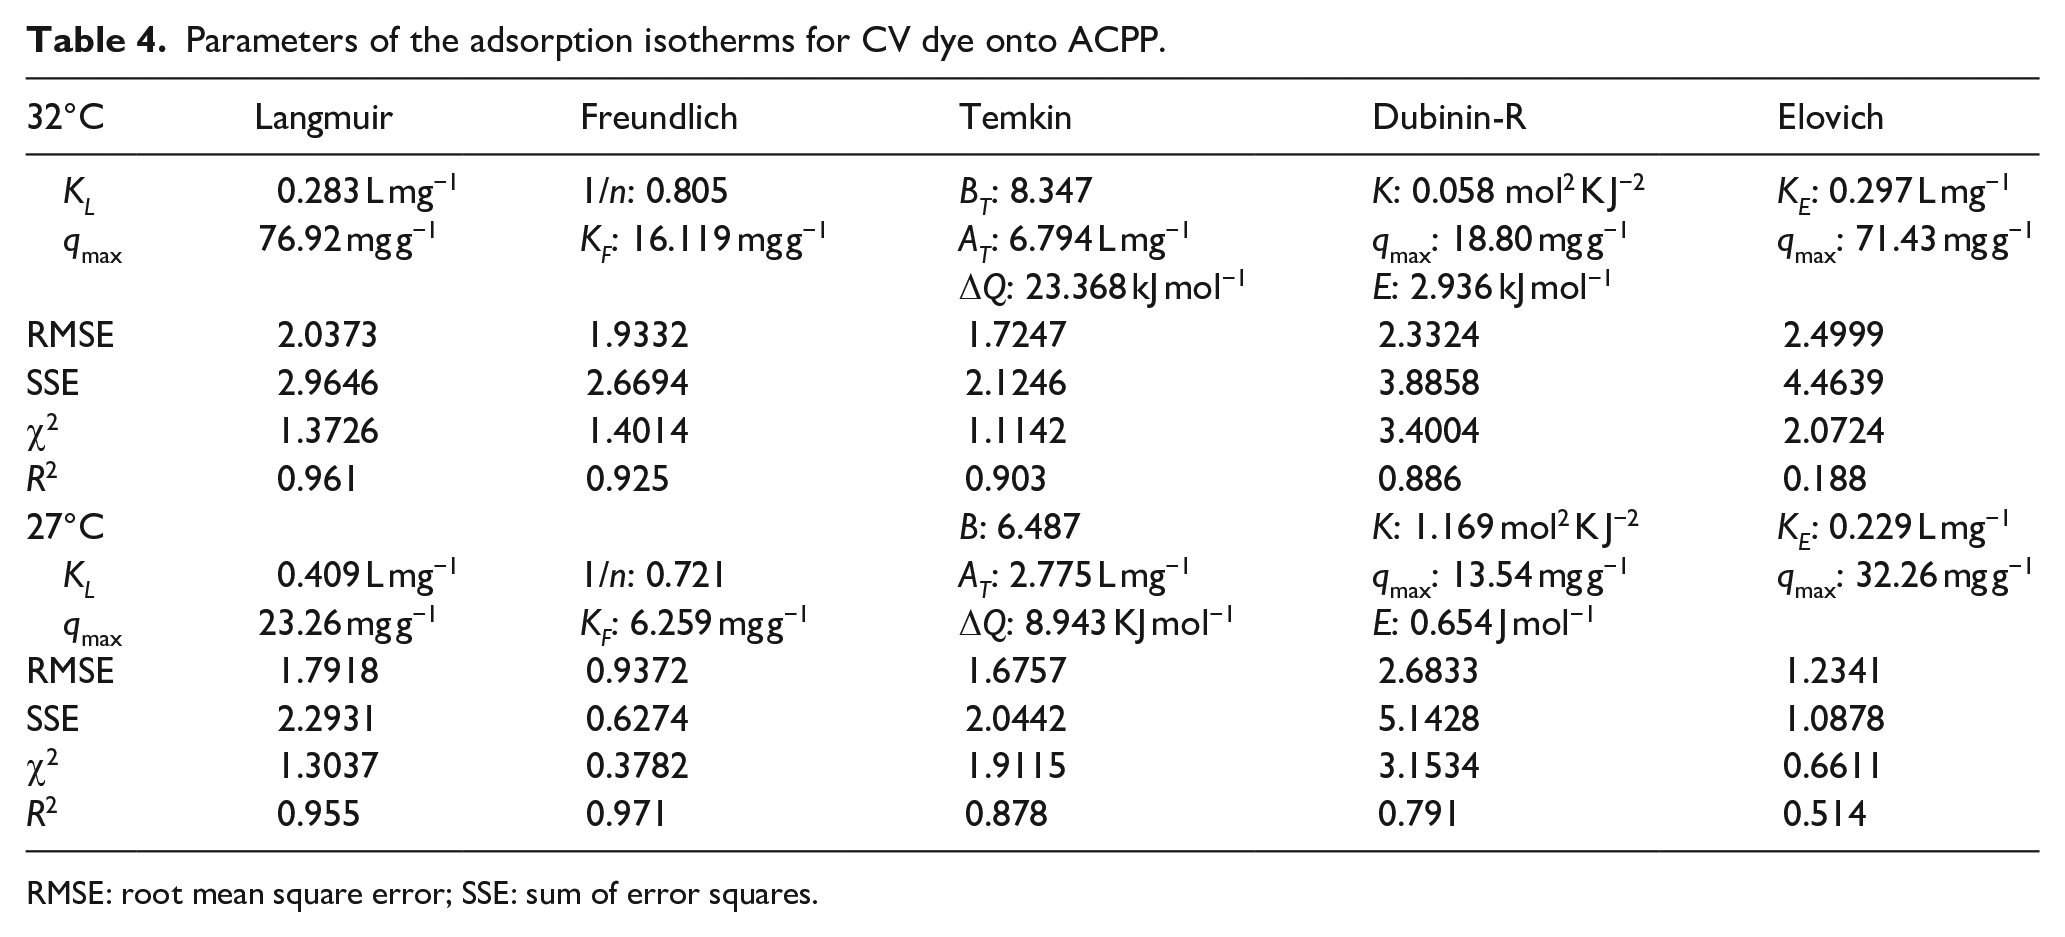
RMSE: root mean square error; SSE: sum of error squares.
Thermodynamic properties modeling studies
The adsorption reaction of coloring molecules on a surface implies a variation of the free energy between the initial and final states. The adsorption capacity of ACPP increases with increasing temperature (299–305 K), indicating that the adsorption is favored at high temperature. The thermodynamic parameters such as ∆G0, enthalpy ∆H0, and entropy ∆S0 are calculated using the following equations


where K0 is the apparent equilibrium constant. The enthalpy (∆H0) and entropy (∆S0) of the adsorption are calculated from adsorption data at different temperatures using Van’t Hoff Equation (16) as follows

The values of lnK0 for thermodynamic calculations are obtained from equilibrium constant (K0) for the adsorption as follows. 34 ,35 Where γ1 is the activity coefficient of the adsorbed solute, and γ2 the activity coefficient of the solute in equilibrium suspension


The ratio of activity coefficients was assumed to be uniform for dilute solutions. As the concentrations of the dye in the solution approached zero, the activity coefficient approached unity.The values of K0 determined from intercept (figures not shown), by plotting ln(qe/Ce) versus Ce and extrapolating to Ce = 0. The ΔH0 and ΔS0 values obtained from the slope and intercept of the plots of lnK versus 1/T are listed in Table 5.
Thermodynamic functions ΔG0, ΔS0, and ΔH0 of CV adsorbed on the ACPP.

Comparison of ACPP with other existing adsorbents
The performance of the various adsorbents and their maximum CV adsorption capacity is compared in Table 6.
Comparison of maximum adsorption capacities for (CV) dye with the literature data.

It can be seen that the adsorption capacity of ACPP is satisfactory in comparison to other adsorbents,35,36 affirming the suitability of the suggested adsorption technique for removal of CV in aqueous solution. Different pathways for binding CV dye to the surface of ACPP might be explained by one or more of these pathways as follows:
(a) Electrostatic interaction of the dye with charged surfaces on the ACPP.
(b) Easy adsorption of the dye onto ACPP by π–π stacking interactions between the aromatic backbone of the CV dye and ACPP.
(c) Surface area, pore diameter, and total pore volume obtained after activation and active sites including −COOH and −OH groups in activated carbon play an important role in determining CV dye adsorption mechanism.
Examination of the results shows that activated carbon (ACPP) has characteristics comparable to industrial activated carbon. These are linked to organic functions and its porosity. The recovery of this waste has a double aspect: its elimination from the environment and its contribution to depollution of water contaminated by high levels of pollutants. This adsorbent can be combined with semiconductors for application in heterogeneous photo catalysis.
Conclusions
This study exhibits the successful preparation of ACPP and its efficiency as an adsorbent for removal of cationic dye from aqueous solution.
The adsorption capacity of CV increased with increasing initial dye concentration, time, and pH, the latter was optimized at ~11. The kinetics of CV removal indicated an optimum contact time of 60 min via the three stages of adsorption kinetic profile. The adsorption of CV ions by ACPP follows a pseudo-second-order kinetic model which relies on the assumption that the physisorption may be the rate-limiting step.
The equilibrium adsorption data for CV on ACPP were analyzed by different models, the results indicated that the Langmuir model provides the best correlation.
The negative value of ΔG0 and ΔH0 indicated that the adsorption of CV onto ACPP is spontaneous and exothermic over the studied range of temperatures.The comparison of the adsorption capacity of the prepared adsorbent with other adsorbents showed its attractive properties from industrial and economic interests.
This study has given encouraging results, and we wish to carry out column adsorption tests under the conditions applicable to the treatment of industrial effluents. Thus, it can be concluded that the ACPP would make a promising cost-effective adsorbent. The study of photo degradation of CV in the presence of TiO2 as semiconductor catalyst combined with the active carbon produced by ACPP constitutes the logical continuation of this study.
Footnotes
Declaration of conflicting interests
The author(s) declared no potential conflicts of interest with respect to the research, authorship, and/or publication of this article.
Funding
The author(s) received no financial support for the research, authorship, and/or publication of this article.