
Abstract
This study aimed to investigate the behavior of nano olive pomace as a raw adsorbent and its biochar in adsorbing thorium (IV) ions (Th(IV)) from aqueous solutions. The study also evaluated and compared their adsorption capacity, removal, optimum adsorption conditions, as well as adsorption kinetics and isotherms. Both adsorbents were characterized by thermal gravimetric analysis, differential thermal analysis, Fourier transform infrared, scanning electron microscope, X-ray diffraction, Brunauer–Emmett–Teller (BET), elemental analysis, specific surface area, bulk density, pore volume, cation-exchange capacity, and pHpzc. The effects of initial concentration, initial pH, adsorbent dosage, contact time, and temperature on the adsorption onto olive pomace and biochar were investigated using the batch method. A pseudo-second-order kinetic model controlled the adsorption of Th(IV) ions, as shown by the kinetic analysis. The Langmuir isotherm best presented the isothermal data for olive pomace and biochar. The maximum Th(IV) adsorption capacities onto olive pomace and biochar were obtained as 68.0 and 154 mg/g at pH 4.0 and 45.0°C, respectively. The adsorption of Th(IV) onto olive pomace and biochar was an endothermic (positive ΔH°), spontaneous (negative ΔG°), and random process (positive ΔS°). After column adsorption, Th(IV) ions were recovered by treating the loaded biochar and olive pomace with 1.0 or 0.1 M HNO3. The first and second stages of recovery employing 1.0 M HNO3 produced the highest recovery percent of Th(IV). The results showed that these adsorbents can be utilized effectively and affordably to extract Th(IV) ions.
Introduction
Thorium, a radioactive actinide metal, is found in trace amounts in rocks, soil, and water (Ismail et al., 2020; Huang et al., 2018). It is primarily extracted from the mineral monazite, along with uranium and other rare-earth elements (Huang et al., 2018). Thorium is more abundant than uranium in the Earth's crust and is refined as a by-product during rare-earth metal extraction. This metal and its compounds, such as thorium oxides, are of growing interest due to their wide industrial applications, including nuclear fuel production, nuclear medicine, ceramics, lighting, and metallurgy (Kütahyali and Eral, 2010). Thorium fuel development gained global attention during the 1960s and 1970s because of its potential to produce fissile 233U (Kaynar et al., 2015). However, despite these benefits, thorium poses environmental and health risks due to its long biological half-life and non-biodegradability (Varala et al., 2016). Prolonged exposure to thorium has been linked to serious health problems, including lung disorders and potential carcinogenic effects on organs such as the pancreas and liver (Nazal et al., 2019). As a result, thorium accumulation in soil, groundwater, and sediments has become a major environmental concern. Various techniques have been developed to remove thorium and other heavy metals from industrial effluents, such as electrochemical methods (e.g., electrocoagulation and electrosorption), solvent extraction, chemical precipitation, and membrane filtration (Aziman et al., 2021; Joseph et al., 2019). However, these methods often face challenges, including high costs, slow processing times, sludge production, and low removal efficiency when dealing with trace metal ions in low concentrations (Varala et al., 2016). As a result, adsorption has gained attention as a more efficient, cost-effective alternative, easy to reuse, and with minimal sludge production, making it a promising solution for Th(IV) removal (Huang et al., 2018; Kütahyali and Eral, 2010; Varala et al., 2016; Khalili et al., 2017). Several adsorbents have been investigated for Th(IV) removal, including metal oxide nanoparticles (Kaynar et al., 2015), plant-based adsorbents such as ginkgo leaves, olive waste, and rice husks (Huang et al., 2018; Varala et al., 2016), and modified materials like silica nanoparticles (Ismail et al., 2020). In Jordan, olive cultivation occupies about 36% of the land, and the country contributes 1.4% of global olive production (Al-Addous et al., 2017). Olive pomace, the residue left after oil extraction, is rich in lignocellulose and has shown adsorbing potential towards heavy metals and radionuclides (Kütahyalı and Eral, 2010). Enhancing olive pomace's adsorption capacity through physical and chemical treatments can further improve its selectivity for heavy metals (Akbas and Yusan, 2020). Biochar, produced from lignocellulosic biomass via pyrolysis, is another promising adsorbent for pollutants.
Hadjittofi et al. studied the activated biochar derived from cactus fibers with HNO3 to increase the abundance of carboxylic groups on the surface since these groups act as strong Th(IV) binding sites. Activated biochar fibers possess increased adsorption capacity for Th(IV) even in acidic solutions (qmax=81mq/g) at pH 3, indicating chemical sorption on oxygen-containing functional groups on the biochar surface. Oxygen-containing functional groups were also shown to be incorporated into the structure of a rice straw biochar upon post-pyrolysis treatment with a mixture of H2SO4 and HNO3, evidenced by higher O/C ratios in the final product.
Chen et al. (2019) studied the removal of aqueous Th(IV) and found an appropriate method for the disposal of wild duckweed in a eutrophic water body. Alkali-treated duckweed biomass, duckweed-based hydrothermal biochar (hydrochar), and pyrolytic biochars at 300°C and 600°C were prepared. The adsorption isothermal data fitted well with the Langmuir model, and the maximum Langmuir adsorption capacities were 104.1, 96.3, 86.7, and 63.5 mg/g for hydrochar, modified biomass, 300°C and 600°C biochars, respectively. The adsorption kinetic data fitted well with the pseudo-second-order kinetic equation. The sorption data of the fixed-bed column also confirmed the highly efficient removal of Th(IV).
Oter and Selçuk Zorer (2020) studied the modified adsorbents obtained from activated carbon for the adsorption of Th(IV) ions from aqueous media. According to the results, both adsorbents had large surface areas after modification. The adsorption process for both adsorption systems was observed to be compatible with the pseudo-second-order kinetic model. The adsorption equilibrium data were best described by the Langmuir model for modified adsorbent with KMnO4 and by the Freundlich model for modified adsorbent with NaOH. Furthermore, the calculated thermodynamic parameters (ΔG°, ΔH°, and ΔS°) showed that both adsorption processes were endothermic and spontaneous.
Philippou et al. (2019) studied the removal of Th(IV) from aqueous solutions, and particularly the effect of particle size on the metal ion adsorption by oxidized biochar fibers derived from pine needles. The adsorption experiments were performed by batch-type experiments and included the effect of particle size on the adsorption capacity (qmax) and adsorption kinetics. The experimental data indicate that there is an optimum range of particle size 100–200 μm in which the maximum values for the adsorption capacity qm =181g/ kg and the kinetic constant k2 = 0.3/ s are observed.
The biochar microporous structure and chemical functional groups, such as phenolic and carboxylic groups, make it effective in adsorbing a wide range of contaminants from wastewater (Sajjadi et al., 2019). It is produced by heating organic materials in the absence of oxygen and has been widely studied for its high porosity and surface area, which are crucial for effective adsorption (Peiris et al., 2019). According to what has been said in the literature, this work attempts to investigate the adsorption of Th(IV) onto both Nano olive pomace and its Nano biochar utilizing a batch technique under a variety of parameters, including time, pH, temperature, and concentration. Adsorption behavior will be understood by analyzing the kinetic and thermodynamic data and applying four adsorption isotherm models to the experimental data. Additionally, the column approach was employed, and the desorption process will be examined with either 0.1 M or 1.0 M HNO3 to determine which is more efficient.
Methodology and characterization
Chemicals
Analytical-grade eagents were used in all experiments in this study. Olive pomace with a particle size of 120 mesh (125 microns) was used as the base material. Thorium nitrate hexahydrate (Th(NO₃)₄·6H₂O) was obtained from BDH Chemicals Ltd Poole, England CAS Number:13470-07-0. Sodium hydroxide pellets were procured from Merck KGaA CAS 1310-73-2 | 106462, while nitric acid (HNO₃), Catalogue number, 5620-4805, 5620-4800, and hydrochloric acid, Catalogue number, HR-0870 (69% and 37%, respectively) were supplied by Tedia. Arsenazo (III) indicator was sourced from Janssen Chimica Catalogue No. 11 150 92.2; 21. Other chemicals used included sodium chloride (NaCl) from Gain Chemical Company CAS number: 7647-14-5, absolute ethanol CAS number:18822871 and acetone CAS number: 64742-88-7, from Selvochem, and hexane, Catalogue number: 22260-11000, from Penta Chemicals. Phenolphthalein CAS Number: 77-09-8 was obtained from BDH Laboratory Supplies.
Instruments
The pH of the solutions was measured using a Bante PHS-25CW Benchtop pH/mV meter. Solution filtration was carried out using nylon syringe filters with a pore size of 0.45 µm. Sample solutions were shaken using a GFL-85 thermostatic mechanical shaker operating at 250 rpm. Th(IV) concentrations in water samples were determined using a VIS spectrophotometer (METASH, model V-5100). Characterization of functional groups was performed using a Thermo Nicolet NEXUS 670 Fourier transform infrared (FT-IR) spectrophotometer. Elemental analyses were conducted with a Euro EA3000 CHNS-O elemental analyzer (Milan, Italy). Thermal stability and decomposition properties were analyzed using thermal gravimetric analysis (TGA) and differential thermal analysis (DTA) with a NETZCH STA 409 PG/PC Thermal Analyzer, operated under nitrogen at a heating rate of 10°C/min over a temperature range of 0–800°C. For structural analysis, X-ray diffraction (XRD) measurements were carried out using a Philips X-Pert PW 3060 system operating at 45 keV and 40 mA. The surface morphology of the adsorbents was examined using a scanning electron microscope (SEM) equipped with an FEI QUANTA 600 FEG system, provided by NCFL. The specific surface area (SSA) and pore size were determined via N₂ at 77.3 K using the Brunauer–Emmett–Teller (BET) method on a Nova 220e surface area and pore size analyzer.
Treatment of olive pomace
Dried olive pomace was obtained from an olive mill, situated in the Madaba area of Jordan. Initially, 1 kilogram of olive pomace was mixed with 3.0 L of deionized water (DI) to facilitate the separation of olive pomace from sediment, insoluble matter, and stones. Then, the olive pomace was washed with hexane several times, then washed with deionized water numerous times, and dried oven (105°C). The olive pomace was milled using an electric mill. The olive pomace distribution has been determined using the sieves set. The milled olive pomace with a particle size of about 125 microns (120 meshes) was collected and repeatedly washed three times with n-hexane and then three times with deionized water. After washing, the solid pomace was heated at 105°C to remove water. Following sample removal and 15 min in the desiccator, the yield of olive pomace was calculated. The yield was calculated using the following equation:

Wi : Initial weight
Wf : Final weight
Preparation of biochar
Aluminum foil was used to enclose a 40 g piece of dried olive pomace so that, when placed in the furnace, the produced gases could escape, a needle was used to make several tiny holes in the covering. To prevent spontaneous combustion, the sample was placed inside a furnace with a continuous flow of nitrogen at a rate (150 mL/min). The furnace was configured to heat to the 300°C pyrolysis terminal temperature at a rate of 10°C per minute, maintaining that temperature for 6 h, then gradually dropping to 40°C. After that, the sample was taken out and put in the desiccator for 15 min. After drying at 105°C and two DI water washes, the sample was sieved through 120 meshes to estimate the biochar yield. The yield was calculated using Equation 1.
Determination of specific surface area
The surface area was computed using the Sears method (Sears, 1956). 0.1 M HCl was used to acidify a sample containing 1.50 g of olive pomace and biochar to a pH of 3.0–3.5, then 30 g of NaCl was added, and the volume was increased to 150 mL using DI. The temperature was set at 25.0°C, and standard 0.1 M NaOH was used as titrant. It was added to produce pH 4.0, and it continues to be added until pH reaches a stable value of 9.0. A volume (V) of 5.8 mL was needed for Olive pomace and 20.9 mL for biochar. The surface area was determined using the Sears equation shown below:

Determination of bulk density (Vv)
The density was measured by filling a 10 mL measuring cylinder with each adsorbent (olive pomace and biochar) and then weighing them. The measured weight, also known as the bulk weight, was divided by the volume of the measuring cylinder that was employed (Ebisike et al., 2020).

Wi is the weight of the empty cylinder (g), Wf is the weight of the cylinder filled with sample (g), and V is the sample volume (mL).
Determination of pore volume and porosity
To free the trapped air in the pores, 2.000 g of olive pomace was immersed in 30 mL of deionized water and heated to 100°C for 25 min. The resultant olive pomace was filtered out of the water and then weighed again. Next, a filter paper was used to dry it superficially. Using equation (4) below and a repeating process for biochar, the weight gain (Winc) per unit mass of the resulting olive pomace, divided by the density of water (d) was obtained (Ebisike et al., 2020).

The volume ratio between the pores and the sample volume is known as porosity, and it is given percentage (Webb 2001).

Determination of cation-exchange capacity
The cation-exchange capacity (CEC) is the ability of a particle to exchange positive ions with the interacting particles. Cations could be exchanged for another positively charged ion from the surfaces of adsorbents. The CEC of sorbents was frequently calculated using Boehm's titration techniques. A 100 mL Erlenmeyer flask was filled with 0.1 g of weighted adsorbent, then 20.0 mL of 0.1 M NaOH solution (b) was added, and then the suspension was shaken for 24 h. Following filtration, 0.1 M hydrochloric acid solution (a) was used to titrate the residual NaOH concentration using an indicator such as phenolphthalein. The CEC in mequiv/g was determined using the following equation (Singh et al., 2010).
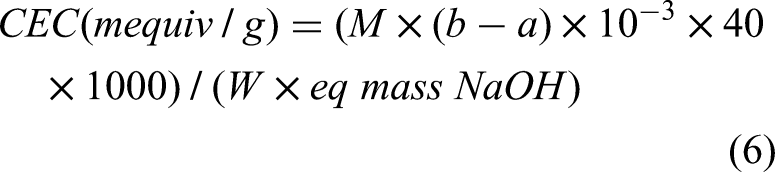
Where:
M = standard molarity of NaOH (mol/L)
b = initial volume of NaOH
a = volume of NaOH being consumed (mL) by the sample.
10−3 = to convert the volume from mL to L
40 = molar mass of NaOH
1000= multiplier for obtaining mile equivalent
W = mass of adsorbents (sample) (g)
eq mass = equivalent mass of NaOH (g/eq)
Determination of pHpzc
Using the recognized acid–base titration method (Jiménez-Cedillo et al., 2013), the point of zero charge (pHpzc) was identified. Various 250 mL Erlenmeyer flasks were filled with 50 mL of a 0.01 M NaCl solution to achieve this. The liquids’ pH was altered from its initial range of 2–10 values by adding 0.1 M HCl or 0.1 M NaOH solutions. Then, each flask received 0.1 g of the sample. The ultimate pH of each solution was determined following equilibration for 48 h at 25°C. Plots of pH (pHfinal - pHinitial) versus pHinitial were made. Each sample's pHpzc value was calculated from the intersection of the pH vs pHinitial curves.
Adsorption
Spectrophotometric determination of Th(IV)
A spectrophotometric analytical technique that depends on the formation of a colorful complex with Arsenazo(III) (as a chromogenic reagent) was used to assess the presence of Th(IV) ions in aqueous solutions (Savvin, 1961). An aqueous solution was created by dissolving 100 mg of Arsenazo(III) at a concentration of 0.10% (w/v) in 1.0 mL of 0.1 mol/L NaOH solution. This solution is made into 100.0 mL by diluting it with deionized water and allowing it to stand for a little while. Th(IV) ions were quantitatively transferred from 0.5 mL of the filtrate solution into a 25.0 mL volumetric flask for spectrophotometric measurement. Volume was increased to 50.0 mL using deionized water after adding 20.0 mL of 9.0 M HCl solution and 1.0 mL of 0.1% (w/v) Arsenazo(III) indicator. Within an hour of the preparation of the sample, spectrophotometric measurements at 660.0 nm were carried out after the solution had been thoroughly shaken. A calibration curve was constructed using 10 to 60 ppm Th(IV). The R2 correlation coefficient for the regression equation was 1 after it was determined using the linear least squares method.
Batch adsorption experiments
The adsorption process was examined as a function of pH, contact time, adsorbent dose, initial concentration, and temperature to determine the optimum condition for Th(IV) adsorption. All work was carried out in the fume hood with bench covers and wearing gloves and masks to avoid any harm and contamination.
Effect of solution pH
Several 100 mL plastic bottles containing 10 mg of each adsorbent were shaken with 25.0 mL of Th(IV) solutions with initial concentrations of 30 mg/L for olive pomace and 40 mg/L for biochar, 0.1 M HCl or NaOH solutions were used to adjust the pH of Th(IV) solutions (before the addition of the adsorbents) between 1 and 7. To achieve equilibrium, the bottles were then sealed and shaken for 24 h at 25.0°C. A Vis spectrophotometer was used to measure the concentration of Th(IV) ions after filtering the suspensions.
Effect of adsorbent dose
Several 100 mL plastic bottles holding 25.0 mL Th(IV) solutions with a starting concentration of 30 mg/L for olive pomace and 40 mg/L for biochar at pH 4.0 were filled with 10, 20, 30, 40, and 50 mg of each adsorbent. After that, the bottles were sealed and left in the shaker for 24 h at 25°C to achieve equilibrium. After the suspensions were filtered, a Vis spectrophotometer was used to measure the amount of Th(IV) in the supernatant. Then, the removal % of Th(IV) was calculated as a function of the adsorbent dosage.
Effect of contact time
Olive pomace and biochar were used in experiments to determine the equilibrium period of the adsorption process. To do this, 10 mg of each material was shaken with 25.0 mL of a Th(IV) solution at pH 4.0 and 30 mg or 40 mg/L, respectively, in a 100 mL plastic bottle. The contact period at 25.0°C ranged from 30 to 1440 min. The solution was filtered using a nylon micro filter (0.45 μm), and the remaining Th(IV) ion concentration in the filtrate solution was assessed using a Vis spectrophotometer. The following equations provide the nonlinear and linear forms of the pseudo-first-order kinetic model:

The equations below give the nonlinear and linear forms of the pseudo-second-order kinetic model:

The following expression represents the intra-particle diffusion rate equation:

The adsorbed amounts of Th(IV) at equilibrium and at any time are denoted by qe and qt, respectively. k1 is the pseudo-first-order reaction rate constant (1/min), and k2 is the pseudo-second-order rate constant (g/ mg.min), and kint is the intra-particle diffusion rate constant (mg/g.min0.5).
Effect of temperature
Adsorption isotherm tests were carried out at pH 4.0 and constant temperatures of 25.0, 35.0, and 45.0°C. To a 25.0 mL Th(IV) solution, 10 mg of olive pomace and biochar were added, with Th(IV) initial concentrations ranging from 10 to 70 mg/L and 30 to 100 mg/L, respectively. The suspensions were shaken for 6 h to bring them to equilibrium, after which they were filtered, and the supernatant was checked for unabsorbed Th(IV) ions using a Vis spectrophotometer. The effectiveness of the adsorption process can be assessed using the following equations, which can be used to calculate the adsorption capacity at equilibrium qe (equilibrium amount of metal ion adsorbed per gram unit of olive pomace and biochar (mg/g), (qt) adsorption capacity at any time t, and removal percentage (% R):


Th(IV) concentrations in aqueous solutions are expressed as Co, the initial concentration, Ce, the equilibrium concentration, Ct, the concentration at time t, m, the mass of the adsorbents, and V, the volume of the aqueous solution, all expressed in mg/L. All experiments were conducted in triplicate to ensure the reproducibility and reliability of the results.
Adsorption isotherms
The Langmuir, Freundlich, Dubinin–Radushkevich (D-R), and Temkin models, among others, were established in this work to explain the experimental adsorption results. The ability of the synthetic olive pomace and biochar to remove Th(IV) is indicated by the information gleaned from the examination of these isotherm models (Table 1).
The equations for the most used isotherm models in linear form.
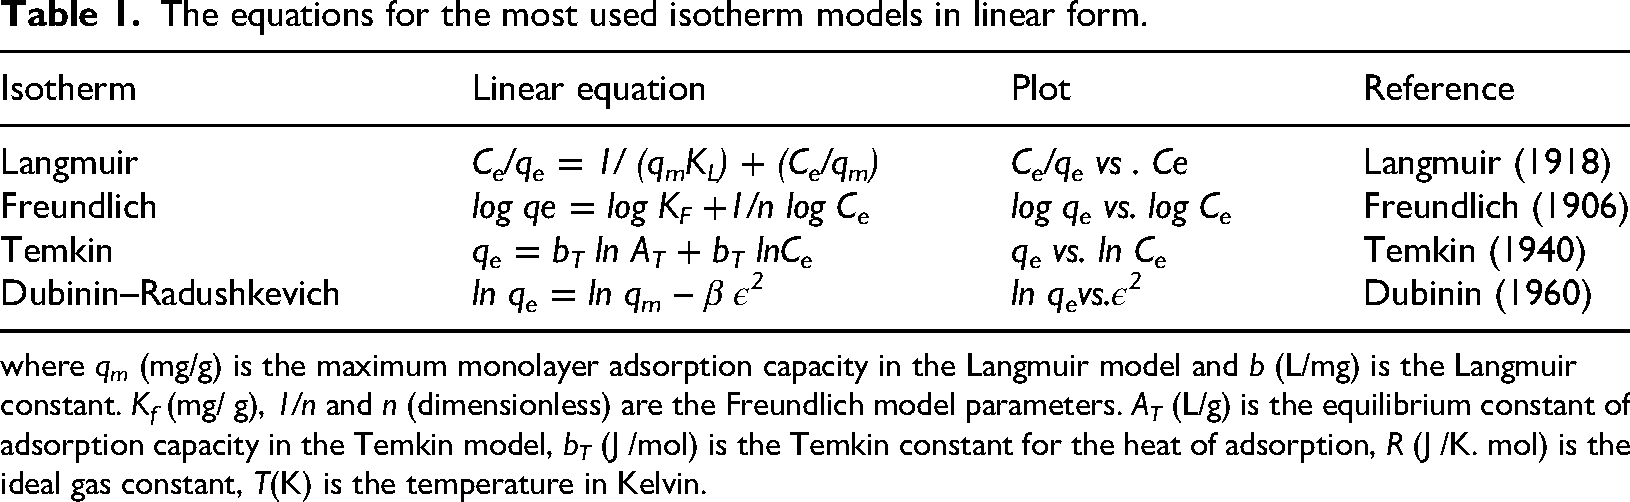
where qm (mg/g) is the maximum monolayer adsorption capacity in the Langmuir model and b (L/mg) is the Langmuir constant. Kf (mg/ g), 1/n and n (dimensionless) are the Freundlich model parameters. AT (L/g) is the equilibrium constant of adsorption capacity in the Temkin model, bT (J /mol) is the Temkin constant for the heat of adsorption, R (J /K. mol) is the ideal gas constant, T(K) is the temperature in Kelvin.
Metal ion uptake using column technique
The glass column used for the Th(IV) adsorption studies had a 20 cm length and a 20 mm inner diameter. The column, which contained 1.000 g of adsorbent, was loaded with a sample of 50.0 mL having a 1000 mg/L Th(IV) concentration, which passed through at a rate of 1.0 mL/2.0 min. After gathering the eluent, the concentration of Th(IV) was then determined using a Vis spectrophotometer.
Desorption
Desorption of Th(IV) was done using the column technique. The previously loaded column was eluted twice with an elution flow rate of 1 mL/2 min, one trial using 50.0 mL of 0.1 M HNO3 and another one using 50.0 mL of 1.0 M HNO3. In each trial of elution, the eluate was collected in five portions of 10.0 mL, and then the concentration of Th(IV) was determined using a Vis spectrophotometer. HNO₃ is commonly used in desorption processes to remove Th(IV) from adsorbents such as biochar due to its acidic nature, which helps break the bonds between metal ions and the adsorbent surface and facilitates desorption. The concentration of HNO3 plays a key role in the efficiency of desorption (Al-Massaedh and Khalili, 2021). Equation (13) was used to calculate the desorption percentage:
Results and discussion
Characterization of olive pomace and biochar
Table 2 lists some of the physical and chemical parameters of the biochar and olive pomace. The comparisons showed that the yield of olive pomace is greater than biochar, as shown in Table 2. The yield of olive pomace is 65% due to the removal of impurities and residual oil. It is consistent with reported values (Chen et al., 2019). The yield of biochar is reduced due to pyrolysis and cellulose and hemicellulose degradation. Dehydrogenation and deoxygenation of the organic components in the biochar resulted in the release of volatile components, which agrees with the work on peat moss and peat moss-derived biochar (Lee et al., 2015). The bulk densities are olive pomace (0.58 g/mL) and biochar (0.50 g/mL) as shown in Table 2. Table 2 shows the percentage contents of %C, %H, %N, and %O for olive pomace and biochar. Olive pomace has high levels of volatile matter and carbon, indicating that it can be used to produce biochar. These results are in good agreement with the results: of carbon (48.20%), hydrogen (3.03%), nitrogen (1.5%), and oxygen (44.13%) reported in the study on olive pomace from Izmir, Turkey (Akbas and Yusan, 2020). Due to pyrolysis, elemental analysis revealed that the carbon content in the biochar was significantly higher than that in olive pomace. The H% and O% content in the biochar is lower than olive pomace, suggesting that the dehydroxylation process is taking place during the formation of biochar (Chen et al., 2019).
Physical and chemical parameters.
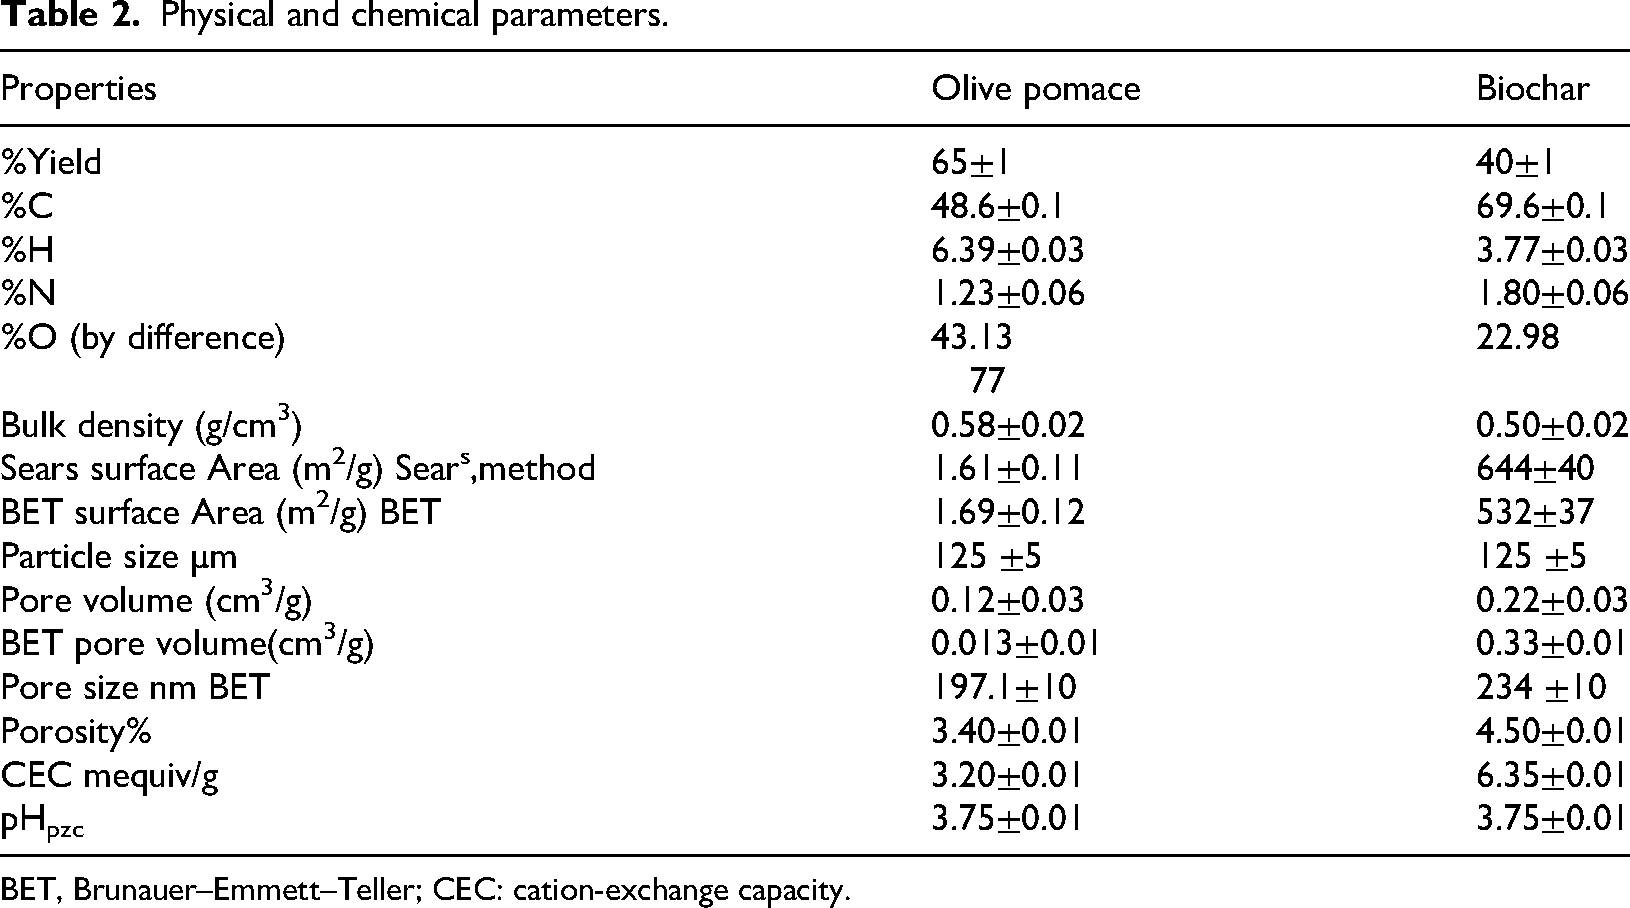
BET, Brunauer–Emmett–Teller; CEC: cation-exchange capacity.
Sears method was used to calculate the SSA of the adsorbents, and the results are shown in Table 2. Surface area values were determined as 1.61 m2/g for olive pomace and 644 m2/g for biochar (Table 1). Therefore, the surface area enhances the adsorption capacity of the adsorbent as shown in Table 4, which is consistent with the literature reports for olive pomace (Akbas and Yusan, 2020), activated carbon derived from olive stones (Bohli et al., 2013), and hydrochar of grape pomace (Petrović et al., 2016). The comparisons revealed that biochar had a greater SSA than olive pomace.
The pore volume increased in this order: biochar was greater than olive pomace, as shown in Table 2. The results obtained indicate that the pore volume shows an increase upon increasing of surface area for olive pomace or biochar. Therefore, biochar showed better potential for removing Th(IV) ions from aqueous media than olive pomace, as shown in Table 4. This is similar to what has been found for coffee husk (Domingues et al., 2017).
Porosity describes the number of pores present in the adsorbents. The porosity increased in this order; biochar is greater than olive pomace (Table 2). The results obtained show that the specific area increases upon increasing porosity. Porosity therefore enhances the adsorption capacity of the adsorbent as shown in Table 4. This is similar to what has been found for carbonate reservoir rocks (Mohammadi et al., 2020).
The CEC increased in this order, with biochar greater than olive pomace. The results indicate that the CEC increases with surface area, as shown in Table 2. The CEC, therefore, enhances the adsorption capacity of the adsorbent (Table 4). This is similar to what has been found by Speroni et al., (2020). The effectiveness of an adsorbent during adsorption can be evaluated using pHpzc. Adsorbent surfaces are positively charged when the solution's pH is lower than the material's pH, favoring the adsorption of anionic contaminants; conversely, negatively charged surfaces favor the adsorption of cationic contaminants when the solution's pH is higher than the material's pH (Jiménez-Cedillo et al., 2013). The pH of olive pomace and biochar is shown in Figure 1 and Table 2. The pHpzc of olive pomace and biochar was (3.75). The surface charge of adsorbents is positive when the solution's pH is less than 3.75. Due to electrostatic repulsion, the enhancement of Th(IV) on the adsorbents’ surface is not conductive, which lowers their adsorption capacity. The surface charge of adsorbents is negative if the solution's pH is higher than 3.75, which attracts cations to facilitate the adsorption of Th(IV).

The pHpzc of olive pomace and biochar at 25°C for 48 h.
Thermogravimetric analysis and differential thermal analysis
The thermal stability characteristics of olive pomace and biochar were evaluated using TGA (Kumar and Tamilarasan, 2013). The TGA spectra of olive pomace and biochar are shown in Figures (2(a) and 2(b)). Adsorbent mass loss processes can be divided into three steps. The mass loss in the first stage occurred between 100 and 200°C, and it was due to moisture loss in the sample and the release of a small amount of volatile compounds (Chen et al., 2019). At temperatures between 200 and 400°C, cellulose, hemicellulose, and other organic functional groups underwent gradual degradation in the second stage (Hernandez-Mena et al., 2014). Between 400 and 800°C, the third stage is where cellulose, hemicellulose, and lignin decompose (Lütke et al., 2019). The highest weight loss of 73.2% and 37.6% at 800°C is for olive pomace and biochar. The increased water content of olive pomace compared to biochar can be used to explain this. As may be seen in Figure 2(b), biochar has higher thermal stability than olive pomace.

TGA and DTA curve's for (a) olive pomace and (b) biochar. TGA, thermal gravimetric analysis; DTA, differential thermal analysis.
The temperature difference between a sample and a reference as the temperature rises is measured by DTA. Possible exothermic and endothermic reactions are identified by a display of the temperature differential thermo-gram. As shown in Figures (2(a) and 2(b)), endothermic reactions occurred at 190 and 160°C for olive pomace and biochar, respectively. It is indicated that heating temperature influences an endothermic transition with denaturation temperature and causes a change in crystallinity (Sahin et al., 2017).
Fourier transform infrared
To describe the functional groups on the adsorbent's surface, an FT-IR experiment was conducted. In Figure 3, the IR spectra of the adsorbent are displayed. Between 3600 and 3000 cm−1, the hydroxyl (OH) and amine (NH2) functional groups are stretched, vibrated, and subjected to rotational vibration. Due to the polysaccharide's OH's stretching vibration, a big peak formed at about 3300 cm−1. At 2925 and 1618 cm−1, respectively, the recognizable strong peaks caused by the stretching vibration of the aliphatic C-H and aromatic C=C are apparent. The stretching vibration of the C=C is what causes the peak to occur between 2200 and 2400 cm−1. The stretched C-O group produced a significant peak at 1107 and 1022 cm−1.

FT-IR spectra of the olive pomace and biochar and after Th(iv) sorption at pH 4.0. FT-IR, Fourier transform infrared.
According to the evidence, hydroxyl, carbonyl, and carboxylic groups also played a role in adsorption. These findings revealed the functional groups that exist on the surface of the adsorbents and the adsorption mechanism that is dependent on these functional groups, particularly hydroxyl and carboxyl groups. Because of the electrostatic interaction between these groups and Th(IV) cations, Th(IV) biosorption to adsorbents was probably caused (Huang et al., 2018). These adsorption bands are associated with the adsorbents in Figure 3. The significant changes in the peak position of symmetric carboxylate at 1259.6 to 1251.7 for pomace and 1240 to 1232.5 cm−1 for biochar upon metal adsorption indicate the formation of inner-sphere surface complexes between Th(IV) and the surface carboxylic moieties as schematically described below (Scheme 1).
Scanning electron microscopy
Morphology of the olive pomace and biochar was investigated using SEM (Figure 4(a) and (b)). Olive pomace (Figure 4(a)) has low porosity, a rougher surface, and high aggregation. The surface of the biochar has a rough structure and less aggregation. When olive pomace is thermally pyrolyzed at 300°C, the volatile matter flows out of the structural components extremely quickly, causing the surface to shrink, split, and produce pores of various sizes and shapes (Figure 4(b)) (Akbas and Yusan, 2020). This is consistent with the hypothesis that certain morphological modifications in the original materials were placed during the creation of the biochar (Hjaila et al., 2013).

SEM image of (a) olive pomace (b) biochar. SEM, scanning electron microscope.
X-ray diffraction
The crystalline structure of olive pomace and biochar biomass can be examined by X-ray diffraction (Ertaş and Alma, 2010). Figure 5 displays the adsorbents XRD spectra. Show that a major part of the olive pomace is amorphous, and diffraction peaks at 2θ of 14.8o, 16.6o, 17.2o, 17.9o, 21.8o, 24.3o, 29.9o, and 34.6o which are related to the crystal structure of cellulose. Similar peaks are shown at 2
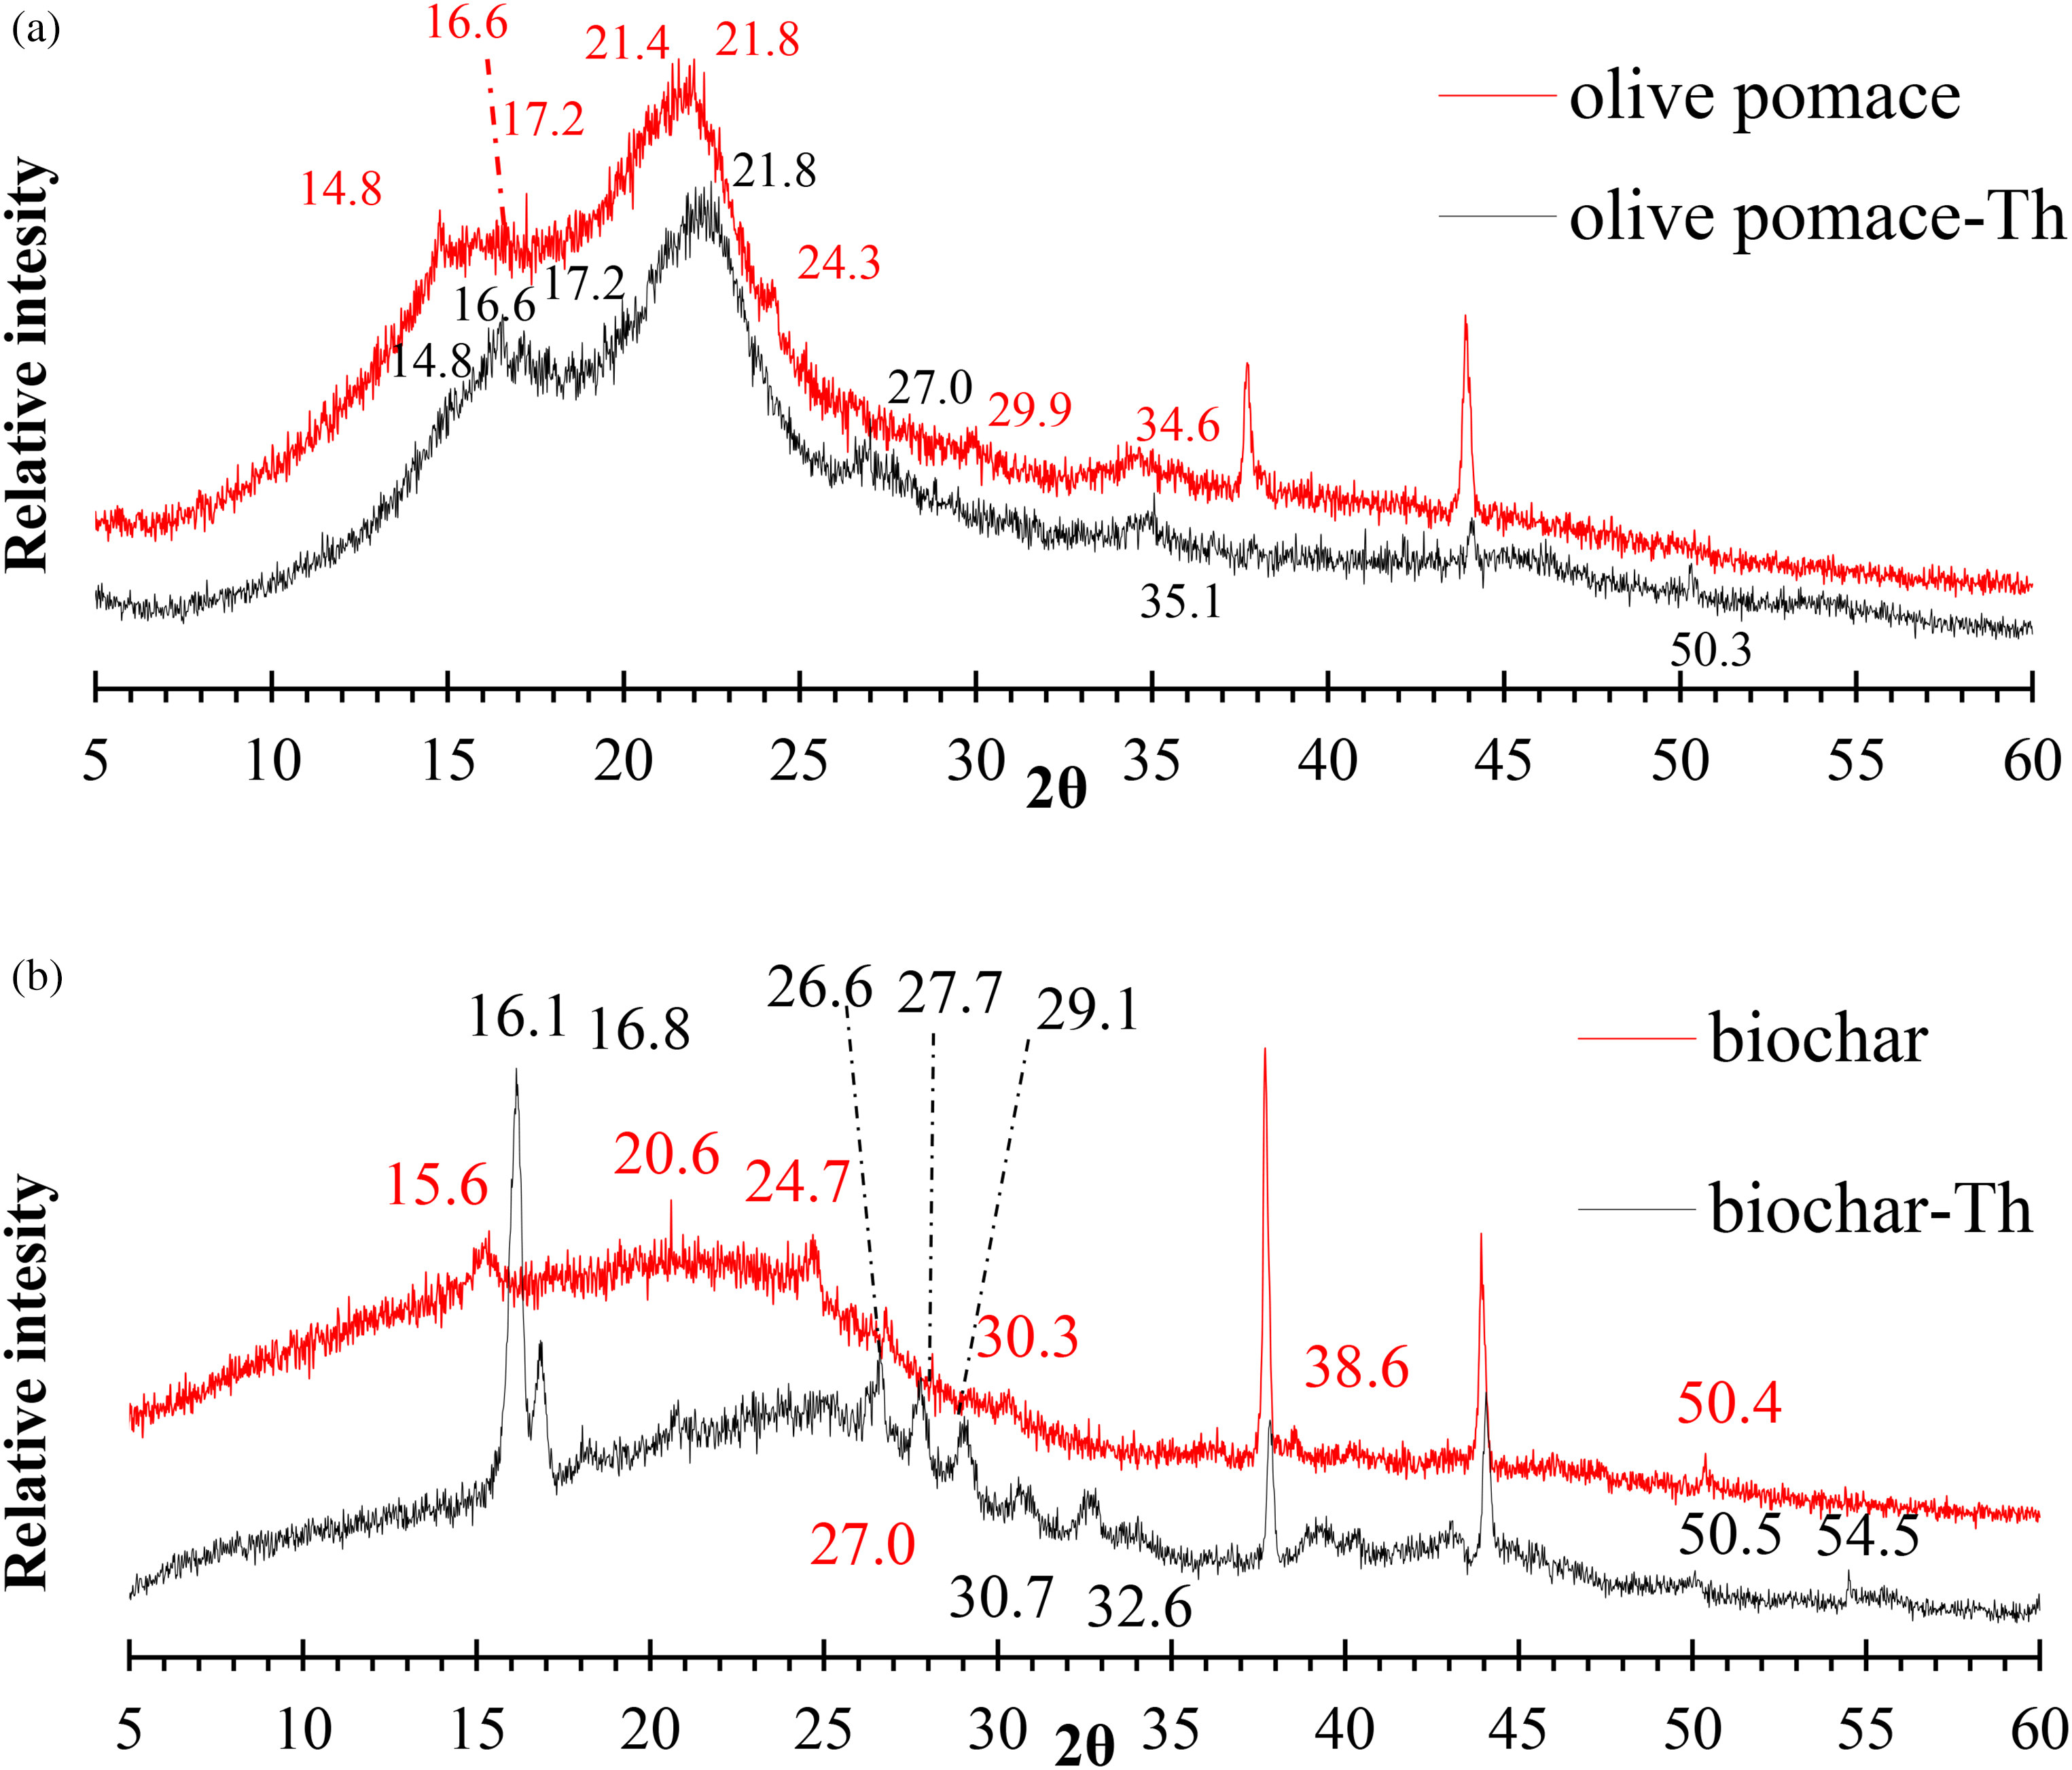
XRD pattern of (a) olive pomace and (b) biochar before and after adsorption Th(IV). XRD, X-ray diffraction.
Where:
Dp: the crystallite length in nanometers, k: the crystallite shape: the X-ray wavelength, β: is the line broadening at half the maximum intensity (FWHM), after subtracting the instrumental line broadening, in radians: the Bragg attitude, and XRD peak position (Holzwarth and Gibson, 2011). Scherrer's equation's parameter values have been as follows: K: 0.94, λ: 1.54 Å for olive pomace and biochar, respectively.
B: 2.9866 ˚ and 0.8400 ˚ for olive pomace and biochar, respectively.
θ: 21.80 ˚ and 24.36 ˚ for olive pomace and biochar, respectively.
The average crystal sizes of olive pomace and biochar were calculated by the equation to be 2.83 nm and 11.00 nm, respectively. This is proof of the Nano nature of olive pomace and biochar.
Brunauer–Emmett–Teller surface area and pore structure analysis
Nitrogen gas adsorption and desorption isotherms of olive pomace and biochar (Figure S1) clearly show that nitrogen molecules have a greater affinity for biochar than for the other adsorbents (solid phases). It rises slowly at low and intermediate relative pressures but rapidly at high relative pressures. Biochar adsorption isotherm rises relatively more rapidly than that of olive pomace. When the relative pressure was reduced, the desorption curve for biochar was higher than the adsorption curve, while in olive pomace it was lower. Brunauer–Emmett–Teller (BET) SSAs and pore size of adsorbent samples are given in Table 3. The BET equation was used to determine the pore size distribution and SSA of the adsorbents using N2 adsorption/desorption data, and the findings are shown in Table 3. Olive pomace BET surface area value is 1.69 m2/g, and for biochar is 532 m2/g (Table 3). On the other hand, the pore volume is 0.013 cm3/g for olive pomace and 0.33 cm3/g for biochar. While the pore size for olive pomace (197.1 nm) is lower than that of biochar 234.3 nm. It can be noticed from Table 3, that Sears and BET methods give relatively close values for surface area and pore volume in the case of olive pomace and biochar. Biochar has more adsorption capacity than olive pomace due to increased surface area and porosity (Table 4).
Kinetic parameters of Th(IV) on: olive pomace and biochar at 25.0 oc.
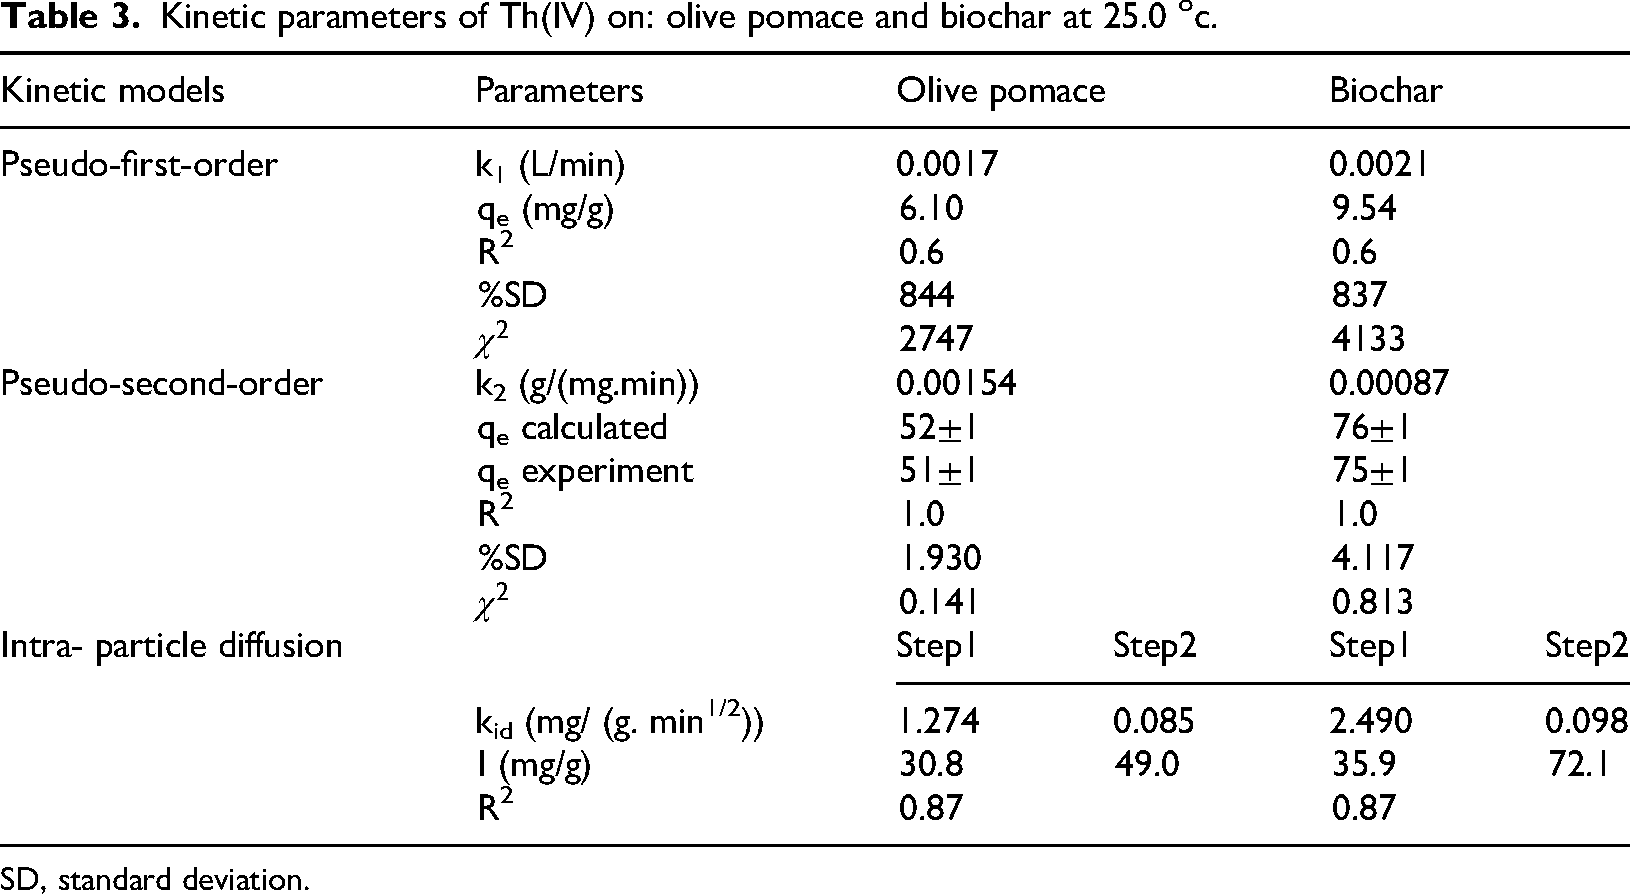
SD, standard deviation.
Langmuir, Freundlich, Dubinin–Radushkevich, and Temkin isotherm parameters adsorption of Th(IV) by olive pomace and biochar.

Effect of pH
One of the most crucial factors affecting the adsorption of metal ions on adsorbents is pH. This factor has a big impact on the surface charge, surface binding sites, chemical stability of the adsorbent, speciation, and precipitation of Th(IV) in aqueous solution (Oter and Selçuk Zorer, 2020; Al-Massaedh and Khalili, 2021). In this work, the impact of initial aqueous solution pH values between pH 1.0 and 7.0 on the adsorption behavior of olive pomace and biochar for Th(IV) was investigated. Figure 6 shows that the percentage of Th(IV) uptake by olive pomace and biochar was low at pH (1.0–3.0), indicating the presence of competitive adsorption between H3O+ and Th(IV) at low pH and the existence of repulsive force between the protonated surface and positive metal ions, which limited the approach of Th(IV). Following that, the percentage uptake of Th(IV) reached its maximum value with the increase in pH to 4.0, because of the decreasing H+ concentration, which caused the positive charges on the surfaces of olive pomace and biochar to decrease or increase the negative charges, making Th(IV) ions easier to adsorb on the adsorbent's surface. At pH 4, about 10% of Th(IV) is free, 10% transformed to Th(OH)3+, and 65% transformed to Th(OH)22+ (Figure 7). The maximum uptake of Th(IV) at pH 4.0 can be due to the development of divalent Th(OH)22+ species, which is predominant at this pH (Langmuir and Herman, 1980) (Scheme 1). Competition of Th(OH)22+ ions with H+ ion for adsorption sites can be one of the main reasons for the reduction of its sorption at low pH. Due to hydrolysis and precipitation species such as Th(OH)4, the adsorption of Th(IV) ions at pH levels higher than 4.0 was not taken into account (Figure 7). The outcome supports the known theory that as pH rises, the amount of negatively charged adsorbent sites increases, and the amount of positively charged adsorbent sites decreases (Huang et al., 2018).

%uptake of Th(IV) by olive pomace and biochar at different pH, 25.0°C and 24 h.

Distribution of hydrolytic thorium species as a function of pH. The species distribution is based on a concentration of 1 μg/L of total dissolved thorium in pure water (e.g., absence of complexing ligands other than OH−) and on thermodynamic data from Langmuir and Herman (1980).
Effect of adsorbent dose
The effect of the olive pomace and biochar dose on the removal % of Th(IV) ions was examined in this study. Figure 8 displays the adsorption capacity (qe) for Th(IV ions as well as the removal efficiency. For Th(IV) ions, uptakes increase with increasing adsorbent mass. This observation results from the greater number of surface-active sites available for adsorption, which are available for Th(IV) ions adsorption. But when the mass of the adsorbents increases, adsorption capacities (qe) decrease. Therefore, 0.01 g of olive pomace or biochar is used throughout all the following experiments at the optimum pH of 4, due to its highest adsorption capacity.

Uptake and adsorption capacity of 30 mg/L Th(IV) by olive pomace and 40 mg/L by biochar at different dosages, pH= 4 and 25.0°C.
Effect of contact time
As illustrated in Figure 9, this work examined the impact of contact duration on the Th(IV) adsorption onto olive pomace and biochar between 0.5 and 24 h at pH = 4.0. As demonstrated in Figure 9, the absorption percentage of Th(IV) grew significantly between the first 0.5 and 6 h and subsequently reached equilibrium after 6 h, indicating that Th(IV) had completely covered all the active sites on the surface of the olive pomace and biochar. Because the surface of the adsorbents contains free active sites, the absorption percentage for olive pomace increased to 68.99% and for biochar to 75.31%. When the contact duration is increased further (6–24 h later), there is no discernible change in the Th(IV) uptake%. This is primarily caused by the saturation of active sites that can interact with Th(IV), proving that an equilibrium between the adsorbents and the aqueous solution has been reached. The final optimum conditions used throughout this work are pH 4, 0.01 g, and 6 h.

%uptake of 30 mg/L Th(IV) by 10 mg olive pomace and 40 mg/L by 10 mg biochar at different time, pH= 4 and 25.0°C.
Effect of temperature
In this work, it was determined whether temperature influenced the percentage of Th(IV) uptake at temperatures between 25 and 45.0°C (Figure 10). Th(IV) ion percentage uptake was found to increase with temperature. Since Th(IV) adsorption onto both adsorbents was through an endothermic reaction, as shown in Thermodynamic studies section with positive ΔH° (Huang et al., 2018).
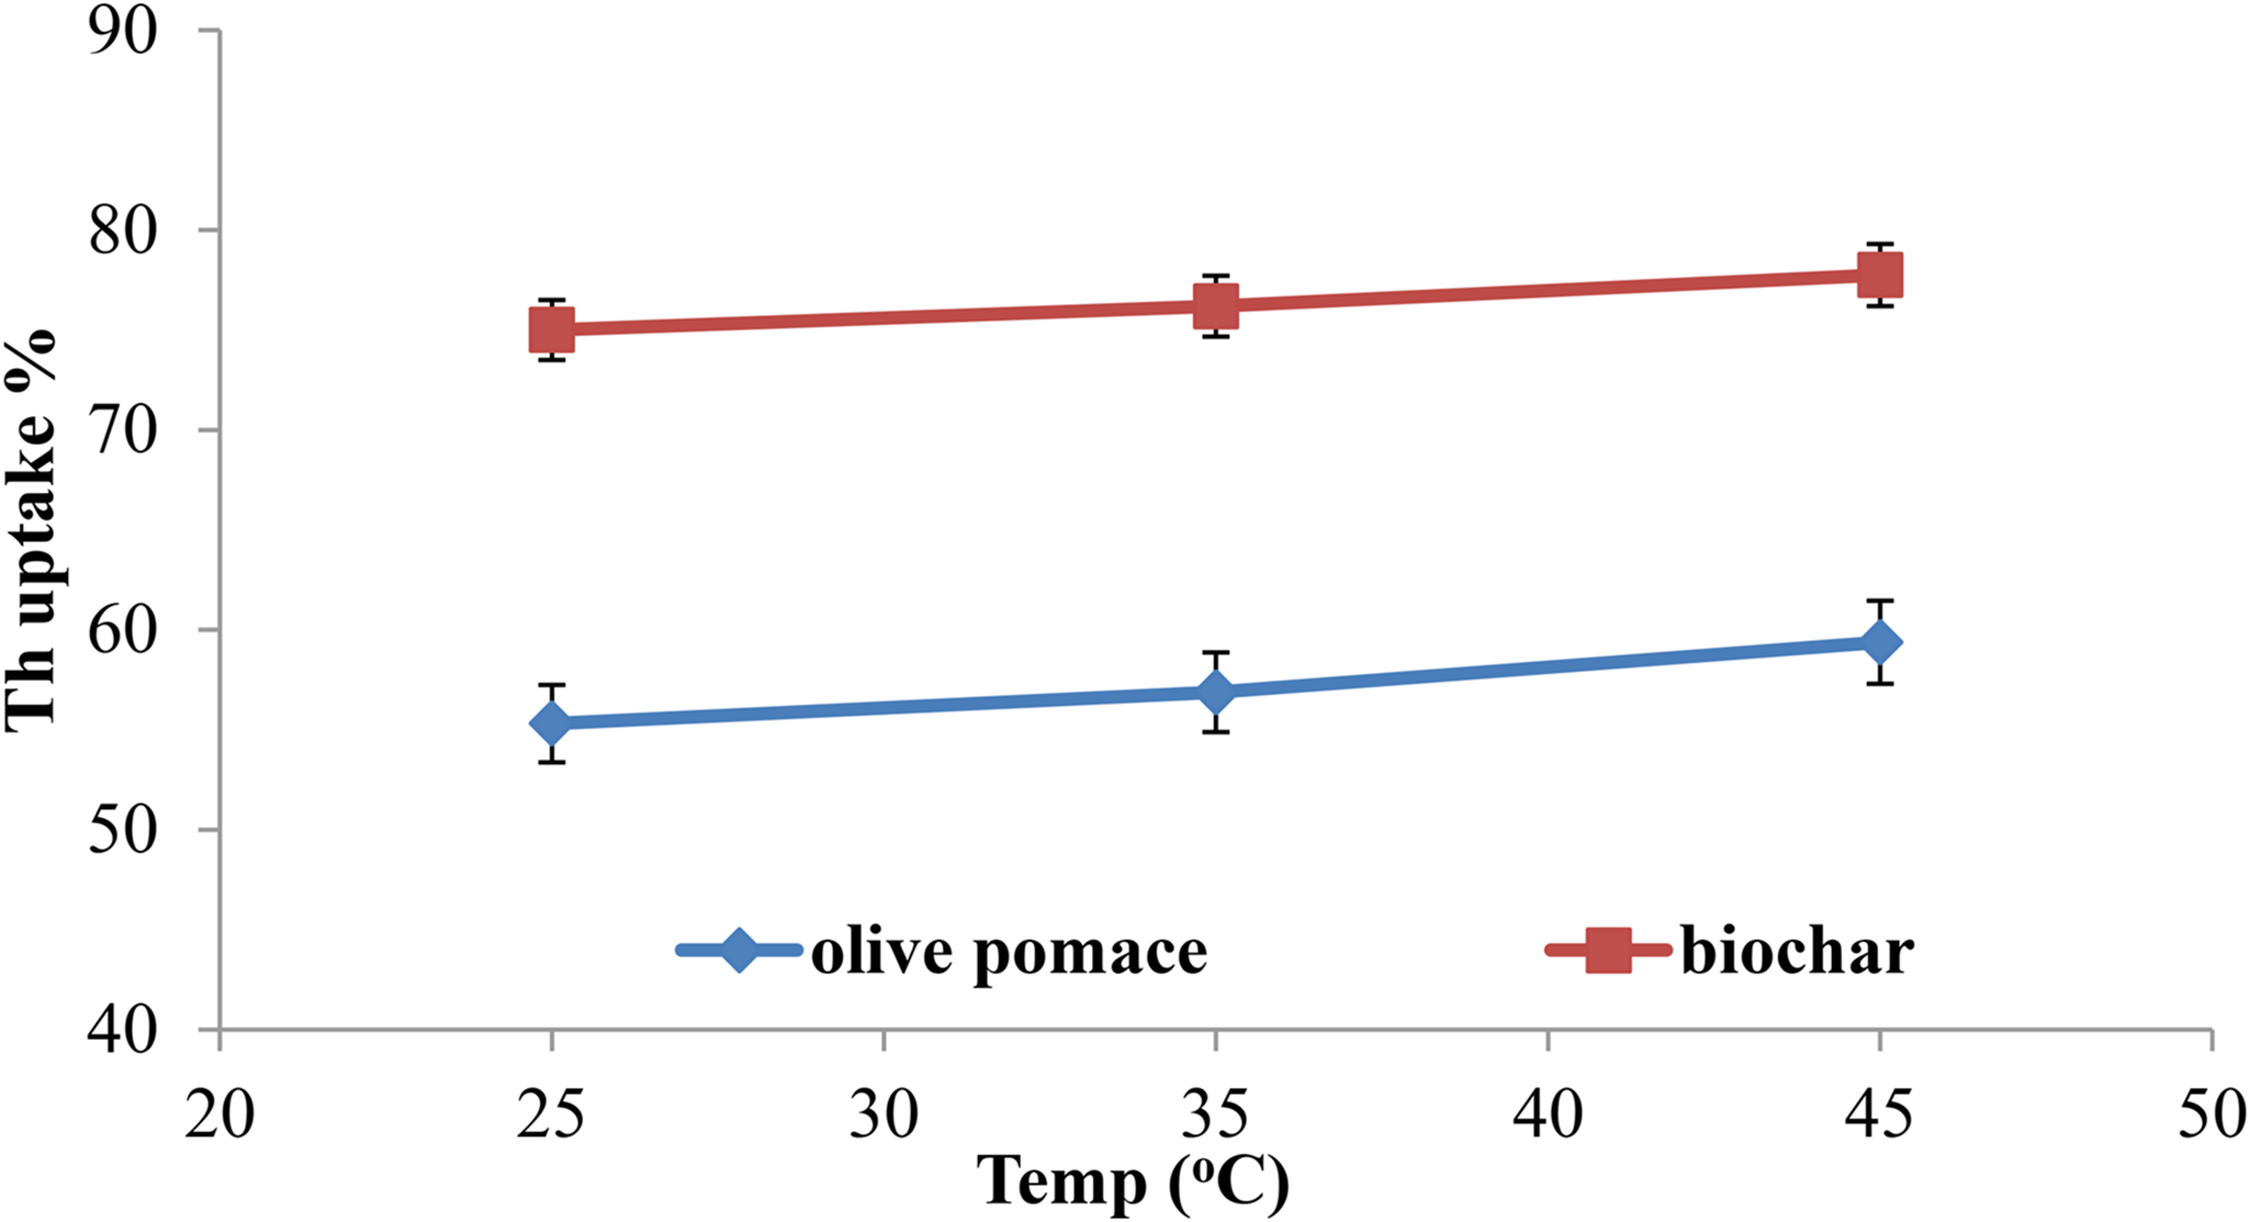
%uptake of Th(IV) by olive pomace and biochar at different temperatures.
Kinetics of the adsorption processes
The adsorption of Th(IV) onto olive pomace and biochar was studied by looking at the adsorption capacity (qe) and contact time (t) at different temperatures. This study's analysis of the kinetic data employed pseudo-first-order, pseudo-second-order kinetics, and intra-particle diffusion models (Srihari and Das, 2008).
To evaluate the kinetic data obtained for Th(IV), the recommended kinetics models were employed. The linearized charts for kinetic models are shown in Figures (S2 and S3). Also, the nonlinear fits both adsorbents perfectly with the pseudo-second-order kinetic model as shown in Figure 11.

Nonlinear regression kinetic models for Th(IV) adsorption on olive pomace and biochar adsorbents. The initial Th(IV) concentration was 30 mg/L for olive pomace and 40 mg/L for biochar, the pH was 4.0, the adsorbent dosage was 0.01 g/25 mL, the contact period was 360 min, and the temperature was 25°C.
These fittings will make it possible to calculate the correlation coefficient (R2), the theoretically derived equilibrium adsorption capacity (qecal), the pseudo-first-order rate constant (k1), the pseudo-second-order rate constant (k2), the reduced chi-square (

Where qeexp is the experimental equilibrium adsorption capacity (mg/g) obtained by applying equation (10) and qecal is the theoretically computed equilibrium adsorption capacity (mg g−1) derived from pseudo-first-order and pseudo-second-order kinetic rate equations. It is a suitable kinetic model for describing the kinetic data for Th(IV) adsorption onto olive pomace and biochar, as shown in Table 2 because it has R2 values of 1.0, low
Adsorption isotherms
The shape of adsorption isotherms reveals crucial details regarding the nature of the adsorption process and adsorption mechanism (Giles et al., 1974; Antilén et al., 2015). The simplest isotherm was first obtained in 1916 by Irving Langmuir who originally derived it for the adsorption of gases by solids. The Langmuir isotherm assumes monolayer adsorption on a uniform surface with a finite number of adsorption sites. Once a site is filled, no further sorption can take place at that site. As such, the surface will eventually reach a saturation point where the maximum adsorption of the surface will be achieved (Langmuir, 1918). The Langmuir model assumes uniform energies of sorption on the surface and no transmigration of sorbate in the plane of the surface. The Langmuir adsorption isotherm is often used for the adsorption of a solute from a liquid solution.
Freundlich expressed an experimental formula that represents the isothermal variation of adsorption of a quantity of gas adsorbed by unit mass of solid adsorbent with pressure (Freundlich, 1906). The Freundlich equation is a practical model permitting multilayer adsorption on the adsorbent. Freundlich isotherm can be used for non-ideal and reversible adsorption on heterogeneous surfaces that are not restricted to monolayer coverage and presume that heterogeneous adsorption energies are associated with different sites.
The D-R isotherm model is valid at low concentration ranges and can be used to describe sorption on both homogeneous and heterogeneous surfaces. It rejects the homogeneous surface or constant adsorption potential (Dubinin, 1960).
Temkin isotherm is the early model describing the adsorption of hydrogen onto platinum electrodes in acidic solutions. This isotherm takes into consideration the interaction between the adsorbent and the adsorbate. It assumes a linear variation of the adsorption heat with the degree of overlap (Temkin and Pyzhev, 1940).
The findings of the Th(IV) adsorption isotherm at pH 4.0 are shown in Figures (12(a) and 12(b)). The findings demonstrated that the adsorption capacity increased along with the equilibrium concentration of Th(IV). The initial concentration of Th(IV) may have been enhanced because of the electrostatic attraction between the adsorbent and Th(IV) and the negatively charged carboxylate, hydroxyl, and carbonyl groups on the surface. For instance, increasing the initial concentration of Th(IV) from 10 mg/L to 70 mg/L increased the adsorption capacity of olive pomace from approximately 25 to 66 mg/g at pH 4 and 45.0°C (Figure 12(a)), but the adsorption capacity of biochar increased from 65 mg/g to 124 mg/g (Figure 21(b)). The fact that the isotherm curves plateau as the equilibrium concentration of Th(IV) (Figures 12(a) and 12(b)) rises indicates that the Th(IV) monolayer has fully developed on the surface of the adsorbent. According to Giles and Smith (Giles et al., 1974; Antilén et al., 2015), the isotherm shapes are used to classify the three main classes of adsorption isotherms (L, H, and S). The adsorption isotherms of olive pomace and biochar are at the L level, according to the model depicting the isotherms for Th(IV) generation in (Figures 12(a) and 12(b)). The adsorption of Th(IV) by the adsorbent is an endothermic process. As shown by the general model that the adsorption capacity increases when the temperature increases.

Adsorption isotherm for Th(IV) adsorption onto (a) olive pomace and (b) biochar pH at 4.0, mass= 0.01 g and at 25.0, 35.0 and 45.0°C.
Langmuir, Freundlich, Dubinin–Radushkevich, and Temkin isotherms
Four isotherm models, Langmuir (Figures 13(a) and 13(b)), Freundlich (Figure S4) Dubinin–Radushkevich (Figure S5), and Temkin (Figure S6) were investigated to better understand the adsorption behavior of Th(IV) using the equations presented in Table 1.

Linearized Langmuir isotherm for Th(IV) adsorption onto (a) olive pomace and (b) biochar pH at 4.0, mass= 0.01g and at 25.0, 35.0, and 45.0°C.
Table 4 shows the isothermal parameter values that were calculated. High correlation coefficients (R2 > 0.9) are observed for the Langmuir, Freundlich, and Temkin isotherm models for the adsorption of Th(IV). The probable reason is that both the monolayer and multilayer adsorption exist in the adsorption process of Th(IV) and the presence of homogeneous and heterogeneous sites on the surface. It could be calculated from the Langmuir isotherm equation that the maximum capacity qm for pomace is 64.5 mg/g and biochar is 133.3 mg/g at 25.0°C as shown in Table 4, with a similar trend at 35.0 and 45.0°C. This is due to a higher percentage of oxygen for olive pomace, while for biochar there is more carbon and nitrogen, as shown in Table 2. The entire above values trend can be explained by surface area, CEC, and porosity as shown before in Table 2. Hence, biochar could be a promising adsorbent for the removal of Th(IV) ions from aqueous solution. The high values of adsorption capacity for Th(IV (IV) for the two adsorbents are due to the high value of charge to radius value for Th(IV) (Z/r=3.54) (Najafi Lahiji et al., 2018). The values of KL for adsorption of Th(IV) by olive pomace and biochar represent the equilibrium adsorption constant (Figures 10(a) and 10(b)); therefore, values of KL (0.084–0.700) were indicative of a favorable adsorption process (Chen et al., 2019). Langmuir isotherm can be used to calculate the value of the separation factor (RL, also called the equilibrium parameter) using the equation as mentioned in Table 1. It was found that the obtained RL values were obtained between zero and one, as seen in Table 4, indicating that the adsorption processes of metal ion Th(IV) on olive pomace and biochar were favorable (Nazal et al., 2019).
To illustrate how metal ions in solution adsorb on heterogeneous surfaces, the Freundlich isotherm is used (Figure S4). The relative adsorption capacity of the sorbent and the intensity of sorption, as indicated by the Freundlich constant KF values from 37.3 to –44.0 and n values from 3.76 to 9.20, respectively, are typical constants. The Freundlich constant (KF) for the Th(IV) adsorption on olive pomace and biochar is shown in Table 4 to rise with rising temperatures, indicating that the adsorption process is endothermic (Arivoli and Henkuzhali, 2008).
The KF value of the Freundlich equation also indicates that biochar has a much higher adsorption capacity than olive pomace, as shown in Table 4. The values of n represent the degree of favorability of adsorption. Table 4 shows that the values of n were greater than one, indicating that the adsorption of Th(IV) on olive pomace and biochar was favorable physical adsorption of Th(IV) onto adsorbents (Oter and Selçuk Zorer, 2020; Al-Massaedh and Khalili, 2021). The homogeneous surface or constant adsorption potential is refused by the D-R isotherm model, which makes it more general than the Langmuir isotherm (Table 4, Figure S5). Adsorption's general mechanism can be inferred from the amount of free energy (E) that is available for adsorption. Physical forces can influence the adsorption if the E value is less than 8 kJ/mol (Chen et al., 2019). The values of qD−Rmax, which are extremely close to qexp, may be seen to grow with temperature. Temkin isotherm plot data for Th(IV) adsorption are provided in Table 4 (Figure S6). The constants AT and B were derived from the slope and intercept of the plot. Results from the Temkin model that indicate a positive bt value smaller than 8 kJ/mol demonstrate that physisorption and endothermic adsorption are both taking place. This is similar to what has been found by Nharingo et al. for acid treated sugarcane. Therefore, the proposed interaction mechanism between Th(IV) and olive pomace and biochar surfaces is mostly an ion exchange and electrostatic. This is similar to what has been found for Salvadora Persica Biomass by Nazal et al., (2019) (Figure 13).
Thermodynamic studies
To examine the spontaneity of Th(IV) adsorption onto olive pomace and biochar, several thermodynamic parameters, including enthalpy (ΔH°), entropy (ΔS°), and Gibbs free energy (ΔG°), were evaluated at temperatures ranging from 25 to 45.0°C and at a pH of 4.0. The enthalpy (ΔH°) and entropy (ΔS°) of the adsorption process were calculated using the Van't Hoff equation as follows:
Where Kd is the Th(IV) distribution coefficient between the adsorbent phase and the aqueous phase (L/g), R is the universal gas constant (8.314 J/mol.K), and T is the absolute temperature (K). The slope and intercept of the lnKd against 1/T line, as shown in Figure 14, are used to calculate the ΔH° and ΔS° values (Table 5). The equation below is used to calculate the value of ΔG° (Table 5):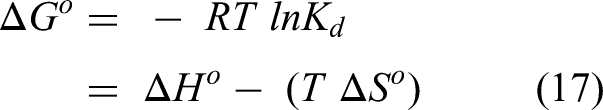

Th(IV) plot of lnKd vs 1/T on biochar and olive pomace

Reaction of Th(IV) with carboxylic functional group.
Thermodynamic function for Th(IV) by adsorbent.

Table 5 includes Kd (distribution coefficient) values determined using the correlation of ln(qe/Ce) with qe (Satoh et al., 1985). The results showed that Kd increased with temperature; this indicates the endothermic nature of Th(IV) adsorption on olive pomace and biochar. Negative ΔG° values represent an energetically more advantageous adsorption process, and the level of spontaneity of the adsorption process is demonstrated by the Gibbs free energy (Xia et al., 2013). As the temperature rises, the ΔG° values become more negative, indicating that Th(IV) adsorption onto adsorbents is more spontaneous. As the temperature rises, the ΔG° values become more negative, indicating that Th(IV) adsorption onto adsorbents is more spontaneous, and mostly ΔGo value is (0 to −20) and (−80 to −400) kJ/mol for physisorption and chemisorption, respectively (Göktepeli et al., 2021). In this work, ΔG° is less than −20 kJ/mol. This indicates that Th(IV) adsorption with olive pomace and biochar is dominated by electrostatic interaction (physical adsorption) as shown in Table 5 (Göktepeli et al., 2021). According to the findings, olive pomace has the highest negative values of ΔGo, indicating that adsorption of Th(IV) onto olive pomace is more advantageous energetically than adsorption onto biochar. The adsorption of Th(IV) on olive pomace and biochar was endothermic, as evidenced by the positive values of ΔH° (Table 5). If ΔH° is less than 84 kJ/mol, the process of adsorption is a physical one for both adsorbents. Similar to what has been found for biochar derived from rice straw (Dong et al., 2018) and adsorption of Th(IV) from aqueous solutions by perlite (Talip et al., 2009). The fact that the metal ions are well solvated and must lose some of their hydration to be adsorbed is one explanation for the positive values of enthalpy ΔH°. This endothermic dehydration process of the ions needs energy, and this energy of dehydration supersedes the exothermicity of the ions adhering to the surface (Mirzabe and Keshtkar, 2015). Both the free energy of adsorption (E) in the (D-R) isotherm model and bT in the Temkin model (Table 4) support this.
The positive ΔS° values for biochar and olive pomace in Table 5 show how the solid/solution contact becomes more unpredictable during the adsorption process. The positive entropy of adsorption is also reflected in the attraction of the adsorbent to the metal ions used. Because the adsorbed water molecules, which the adsorbate species displace, gain more translational energy than is lost by the adsorbate ions, randomness prevails in the system. The dehydration of metal ions also increases the randomness of the system (Khalili and Al-Banna 2015; Mirzabe and Keshtkar, 2015).
Desorption of Th(IV)
An important part of Th(IV) solution treatment is adsorbent regeneration. Desorption studies were carried out using two desorbing agents of 0.1 and 1.0 M of HNO3 while maintaining an elution flow rate of 1 mL/ 2 min. Five 10 mL portions of the eluate were collected, to determine Th(IV) elution from olive pomace and biochar, as indicated in Table 6. These findings show that 0.1 HNO3 has lower desorption, while 1.0 M HNO3 has been determined to be the most effective in removing Th(IV) from olive pomace and biochar.
Loaded concentration and desorption of Th(IV) adsorbed by two adsorbents at pH = 4.0, mass=1.000 g and 25.0°C using column experimental.
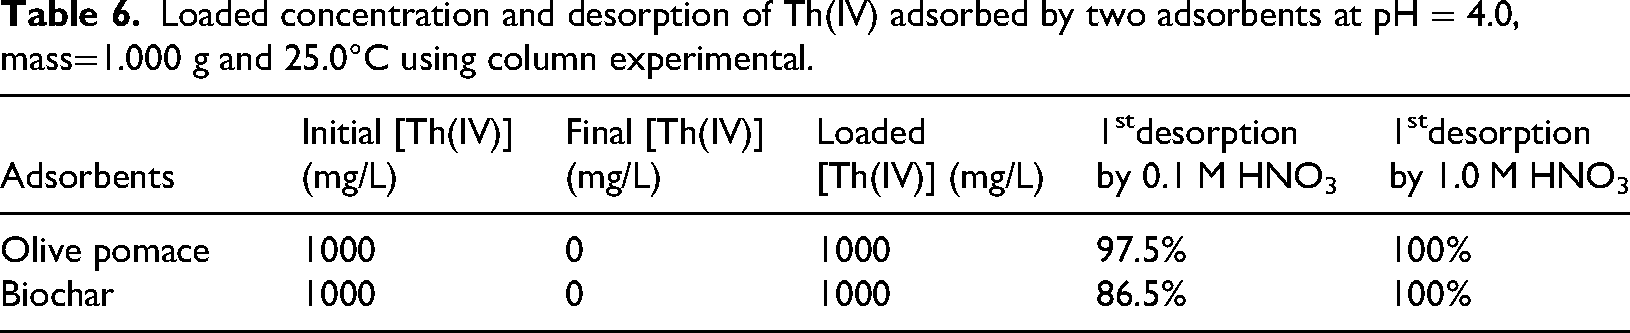
The percentage cumulative recovery numbers shown in Table 7 indicate the following. HNO3 acts as a proton-exchanging agent, increasing hydronium ion concentration to compete with Th(IV) and facilitate the desorption of Th(IV) based on the cation-exchange mechanism. A concentration of 0.1 M provides a mild acidic environment that gently releases Th(IV) ions, while 1.0 M HNO3 is more aggressive, effectively competing with the metal ions for binding sites and enhancing desorption for strongly adsorbed ions. These concentrations offer a balance between effective desorption and maintaining the integrity of the adsorbent (Yuan et al., 2020). This is in favor of a physical as opposed to a chemical adsorption mechanism (Khalili and Al-Banna, 2015). Reloading of columns with Th(IV) ions was done after the first desorption. The uptake capacity for reloading follows this order, olive pomace greater than biochar due to higher contact time as shown in Table 7.
Reloaded concentration of Th(IV) adsorbed by adsorbents at pH 4.0 and 25.0 oc after desorption by 0.1 m and 1.0 m HNO3.

After reloading, Th(IV) ions removal and adsorbent regeneration were accomplished using the same two eluting agents, 0.1 M HNO3 and 1.0 M HNO3. The cumulative recovery percentage was determined as stated in Table 7. According to these findings, the desorption percentage for biochar and olive pomace by 1.0 M HNO3 content was higher than by 0.1 M HNO3.
Comparison with another adsorbent
The adsorption capacities of the olive pomace and biochar should be compared with those of other adsorbents, which are listed in Table 8, to support their effectiveness as adsorbents. When compared to other adsorbents, our biochar has a higher capacity than olive pomace, biochar from Salvadora Persica branches, and Duckweed biochar, but less than pine needles biochar for Th(IV) adsorption. Biochar has a higher value than most of the biosorbents mentioned in Table 8 due to its high surface area, pore volume, pore size, negative surface charge, oxygenated functional groups, and nano nature (Table 2).
Adsorption capacity of various adsorbents for Th(IV) at different pH.

Conclusions
In the present work, olive pomace and biochar have been characterized by TGA, DTA, FT-IR, SEM, XRD, BET, elemental analysis, SSA, bulk density, pore volume, cation-exchange capacity, and pHpzc. Removal of Th(IV) by olive pomace and biochar from aqueous solutions using batch adsorption experiments was carried out under various experimental conditions. Desorption of loaded metal ions on olive pomace and biochar was investigated at 25.0°C using two concentrations of HNO3. From the results obtained, the following points were concluded: Biochar pyrolysis at 300°C resulted in materials of high porosity and surface area, which affect the sorption capacity and binding mechanism of Th(IV) on the biochar surface. The adsorption equilibrium for Th(IV), on olive pomace and biochar occurs within 6 hours, and the adsorbed metal ions increase with increasing pH. Kinetic studies indicated that adsorption equilibrium data fitted well with the pseudo-second-order model. Langmuir adsorption isotherm showed better fitting for the obtained adsorption data than the Freundlich, Temkin, and Dubinin–Radushkevich adsorption isotherm models with a maximum adsorption capacity (qm) 154 mg/g at pH 4.0 and 45.0°C of biochar. The E and bT values from the Temkin model are less than 8 kJ /mol, indicating the physical adsorption of Th(IV) onto olive pomace and biochar. The adsorption of Th(IV) by olive pomace and biochar is endothermic and spontaneous. Recovery of Th(IV) loaded onto olive pomace and biochar was obtained using 0.1 M HNO3 or 1.0 M HNO3, after two cycles, the highest percentage was for olive pomace. This study recommends the use of Madaba olive pomace and biochar to remove Th(IV) ions from aqueous solutions in separation and purification processes due to its green, low cost, high availability, high recovery, and Nano nature.
Supplemental Material
sj-docx-1-adt-10.1177_02636174251366591 - Supplemental material for Thorium(IV) removal by nano olive pomace and its nano biochar: A comparative study
Supplemental material, sj-docx-1-adt-10.1177_02636174251366591 for Thorium(IV) removal by nano olive pomace and its nano biochar: A comparative study by Akram I. Abu Shawer, Fawwaz I. Khalili and Ehab A. Hamzeh in Adsorption Science & Technology
Footnotes
Funding
The authors received no financial support for the research, authorship, and/or publication of this article.
Declaration of conflicting interests
The authors declared no potential conflicts of interest with respect to the research, authorship, and/or publication of this article.
Data availability statement
All the data are available in the manuscript.
Supplemental material
Supplemental material for this article is available online.
References
Supplementary Material
Please find the following supplemental material available below.
For Open Access articles published under a Creative Commons License, all supplemental material carries the same license as the article it is associated with.
For non-Open Access articles published, all supplemental material carries a non-exclusive license, and permission requests for re-use of supplemental material or any part of supplemental material shall be sent directly to the copyright owner as specified in the copyright notice associated with the article.