
Abstract
Envelopes are main structures of stratospheric airships. They are usually made of laminated fabrics and prone to tearing, so it is significant to study their tear strengths. This paper aims to investigate the tear strength of an envelope for stratospheric airships by uniaxial and biaxial tear tests. Three uniaxial tear specimens and 15 biaxial tear specimens under five different stress ratios (warp stress vs weft stress) were tested, and their tear strengths were measured. Two-dimensional digital speckle correlation method was used to obtain specimens’ strain contours. The test results show that the average tear strength of uniaxial specimens is 32.99 N/mm, over 20% higher than those of biaxial specimens, ranging from 25.50 N/mm to 27.25 N/mm. It reveals that weft stress reduces the tear strength; nevertheless, the stress ratios slightly affect the tear strength. Besides, the strain contours clearly show three zones in each specimen – the low-strain zone, the high-strain zone, and the medium-strain zone. Depending on the strain contours and previous research on imperfect composite materials, we inferred that the crack-tip stress concentration factor of a uniaxial specimen is lower than that of a biaxial specimen. It explains the difference in tear strength between uniaxial and biaxial specimens. These findings suggest using biaxial tear test to measure the tear strength of an SSA’s envelope.
Keywords
Introduction
Stratospheric airships (SSAs) are powerful high-altitude platforms for long-term detection, telecommunication, and scientific observation. 1 Many countries have contributed to design and build SSAs. Envelopes are main structures of SSAs. Generally, an envelope should maintain its aerodynamic shape depending on internal pressure and resist external environments such as ozone and ultraviolet. 2 To meet these requirements, an envelope is generally made of a laminated fabric, which consists of several layers including a load-bearing fabric layer, an environment-resisting film layer, and a leak-proof film layer. 3 Like other fabrics, an envelope is prone to tearing if there are defects or local stress concentration on it. Once the envelope tears, SSA will be at risk of losing control or even crashing. Therefore, investigating envelope’s tear strength is a continuing concern within researchers.
Many literatures have shown studies on tear strengths of various envelopes. US Navy firstly developed a uniaxial central crack tear test on an airship envelope in the 1950s. 4 Federal Aviation Administration (FAA) then adopted this test in FAA-P-8110-2 (Figure 1(a)). 5 Recently, Chen and Chen 2 and Chen et al. 6 conducted uniaxial tear tests on an envelope Uretek-3216LV. As shown in Figure 1(b), the specimen size is the same as that of FAA’s specimen, but the clamped regions in their tests were quite different. This difference surely affects the stress distribution near the crack tip. Therefore, the measured tear strengths based on these two tear tests are quite different. Additionally, some researchers have tested specimens that are 300 mm × 50 mm in size.7–9 Whereas, Chen et al. 10 have verified that specimen size surely affects the tear strength of an envelope. A specimen with large size would be much appropriate for measuring an envelope’s practical tear strength. In this study, larger uniaxial specimens, which sizes are 590 mm × 160 mm, were adopted to reduce this effect.

In addition to uniaxial tear test, biaxial tear test was originally developed to study tear properties of textile membrane structure materials.11–14 Then, many researchers used this test method on airship envelopes. Maekawa et al. 15 have carried out a biaxial tear test on Zylon envelope to investigate the effect of crack length on the tear properties (Figure 2). Empirical formulas were also evaluated to be applied to this material. The findings of Luo et al.16–17 shows the tear forces of two PVC coated fabrics under biaxial load are a little higher than under uniaxial load. But there is only one sample for each configuration of fabrics. More tests should be conducted to support the conclusion. Chen and Chen 2 have conducted a similar test on Uretek-3216LV. They found that tear strength and failure performance were significantly related to stress ratios, and the specimens under biaxial loads could show a higher tearing resistance than those under the uniaxial loads. However, the conclusion may not be accurate because of the different size of uniaxial and biaxial specimens.

Biaxial tear test. 15
Pressurized envelope tear test was also conducted by Maekawa et al. 15 (Figure 3(a)) and Lagerquist and Keen 18 (Figure 3(b)). These test methods included effects of internal gas pressure on envelope tear strength, but their warp-stress/weft-stress ratio were invariable, which highly depended on the envelope shape.

Pressurized envelope tear test: (a) pressurized cylinder and (b) pressurized diaphragm.
In addition to the tests, many researchers have theoretically analyzed tear strengths of fabrics. For instance, Hedgepeth and Dyke 19 proposed the first micromechanical analytical model of a damaged filamentary structure under uniaxial tensile load and found the static and dynamic stress concentration factors (SCF) in unbroken yarns. However, the investigation was limited by the assumption that both the yarns and matrix behave elastically. 20 Hedgepeth 20 and Dyke 21 then developed the model for SCF problem of a three-dimensional square or hexagonal array and a two-dimensional array, where two plastic behavior was assumed: an ideally plastic behavior of the matrix adjacent to a broken yarn and the bond failure between a broken yarn and the adjacent matrix. According to their statistical analysis, SCF of the first intact filament adjacent to plastic matrix decreases. Beyerlein and Phoenix 22 got the similar conclusion: either plastic yielding or fiber-matrix debonding greatly reduces the SCF at the crack tip by a new developed computational technique called the quadratic influence superposition (QIS) technique. They also studied the effects of the statistics of fiber strength on the fracture process and the fracture resistance for an elastic composite lamina with an internal crack.23–25 Besides, Godfrey et al. 12 and Godfrey and Rossteeos 14 presented a micromechanical model to predict the onset of tearing at slits in biaxially stressed uncoated and coated plain weave fabrics. Analytical results obtained for the model exhibits good agreement with experimental results.
Although some researchers have proposed empirical formulations by assuming the stress (strain) distribution pattern near a crack tip, there have been few literatures about measuring the stress (strain) field of biaxial tear specimens. 9,15,26 Only in a few literatures,7,27 the digital speckle correlation method was adopted to measure strains of uniaxial tear specimens.
This paper aims to investigate the difference in tear strength of an airship envelope between uniaxial and biaxial tear test, and the effect of loading stress ratios on its tear strength. Three strip specimens and 15 cruciform specimens were manufactured, and each specimen has a 30 mm-long central crack. We used two-dimensional digital speckle correlation method (2-D DSCM) to measure the strain field of all specimens. According to the strain contours, we proposed a possible explanation for the test results.
Experiment
Material
The envelope material is laminated with a polyvinyl fluoride (PVF) film and a plain-woven fabric composed of Vectran fiber (Figure 4). The PVF film prevents gas leakage and protects the fabric against weathering, ultraviolet, and a wide variety of chemicals. 1 The fabric is used as a loading-bear layer because Vectran fiber made from liquid crystal polymer (LCP) exhibits excellent strength and rigidity: its average tensile strength is about 25.51 cN/denier (2.90 GPa), which is five times stronger than steel and 10 times stronger than aluminum. 28 Besides, Vectran fiber has high resistance to chemicals and extreme temperatures, low creep and moisture regain. 29

Micrographs of the fabric: (a) Vectran fibers and PVF film and (b) cross-sections of the fabric.
In this fabric, 18 and 17 Vectran yarns per centimeter respectively lay in warp and weft directions. The yarn linear density is 220 denier. The thickness of the envelope is 0.17 mm and the areal density is about 130 g/m2. According to the standard, MSAJ/M-03:2003, 30 the measured ultimate tensile strengths of the envelope are 91.46 N/mm in the warp direction and 83.98 N/mm in the weft direction.
Specimens
One uniaxial sample and four biaxial samples were used. And accordingly, three specimens per sample were tested. Their geometric dimensions are shown in Figure 5. In the center of each specimen, a 30-mm long crack was introduced along weft yarns, which means 54 warp yarns were cut. Besides, each loading arm of specimens was cut into four parts equally. The loading arms were folded back and welded so that Polyethylene (PE) bars were installed in the pockets (Figure 5(c)). 31

Geometric dimensions of specimens: (a) uniaxial tear specimen (UTS), (b) biaxial tear specimen (BTS), and (c) welding end.
Experimental procedures
To study the effect of loading stress ratios on the specimen’s tear strength, we set six loading stress ratios γ defined as equation (1), as shown in Table 1. Those loading ratios on BTS are common in airship envelopes.

The loading stress ratios of specimens.

Here,
Specimens were clamped on a biaxial tensile apparatus. The minimal initial force applied on each specimen arm is 200 N. The loading speed in the warp direction is 25 N/s for all specimens so that the warp forces (stresses) are identical at the same loading time. The loading speed in the weft direction equals to 25
We used 2-D DSCM to measure the strain fields of specimens during the whole loading process. Figure 6 shows the two kinds of specimens, on which 160 mm × 160 mm speckle stickers were affixed. During the test, legible speckle images were taken every 2 s. Finally, Ncorr, an open-source 2-D digital image correlation Matlab program,32,33 was used to analyze the images and a series of strain contours was drawn.

Two kinds of specimens: (a) UTS and (b) BTS.
Results
Failure performance and crack propagation
The test processes of UTS and BTS-2 are shown in Figure 7, where t is loading time. Although the processes are similar, there are many differences between them. At the beginning, both cracks were in the straight-line shape. With the increasing loading (t = 0~120 s), the crack of UTS opened into a larger oval than that of BTS-2. After that, warp yarns of BTS-2 at the crack tips were broken one by one, and the cracks propagated along weft direction. At the same time, Del-zones appeared at crack tips. UTS had larger del-zones than BTS-2. Finally, both of them were torn into two parts brutally, but UTS failed much later than BTS-2 (192 s vs 134 s) and the surface of UTS was out-of-flatness obviously while that of BTS-2 retained smooth.
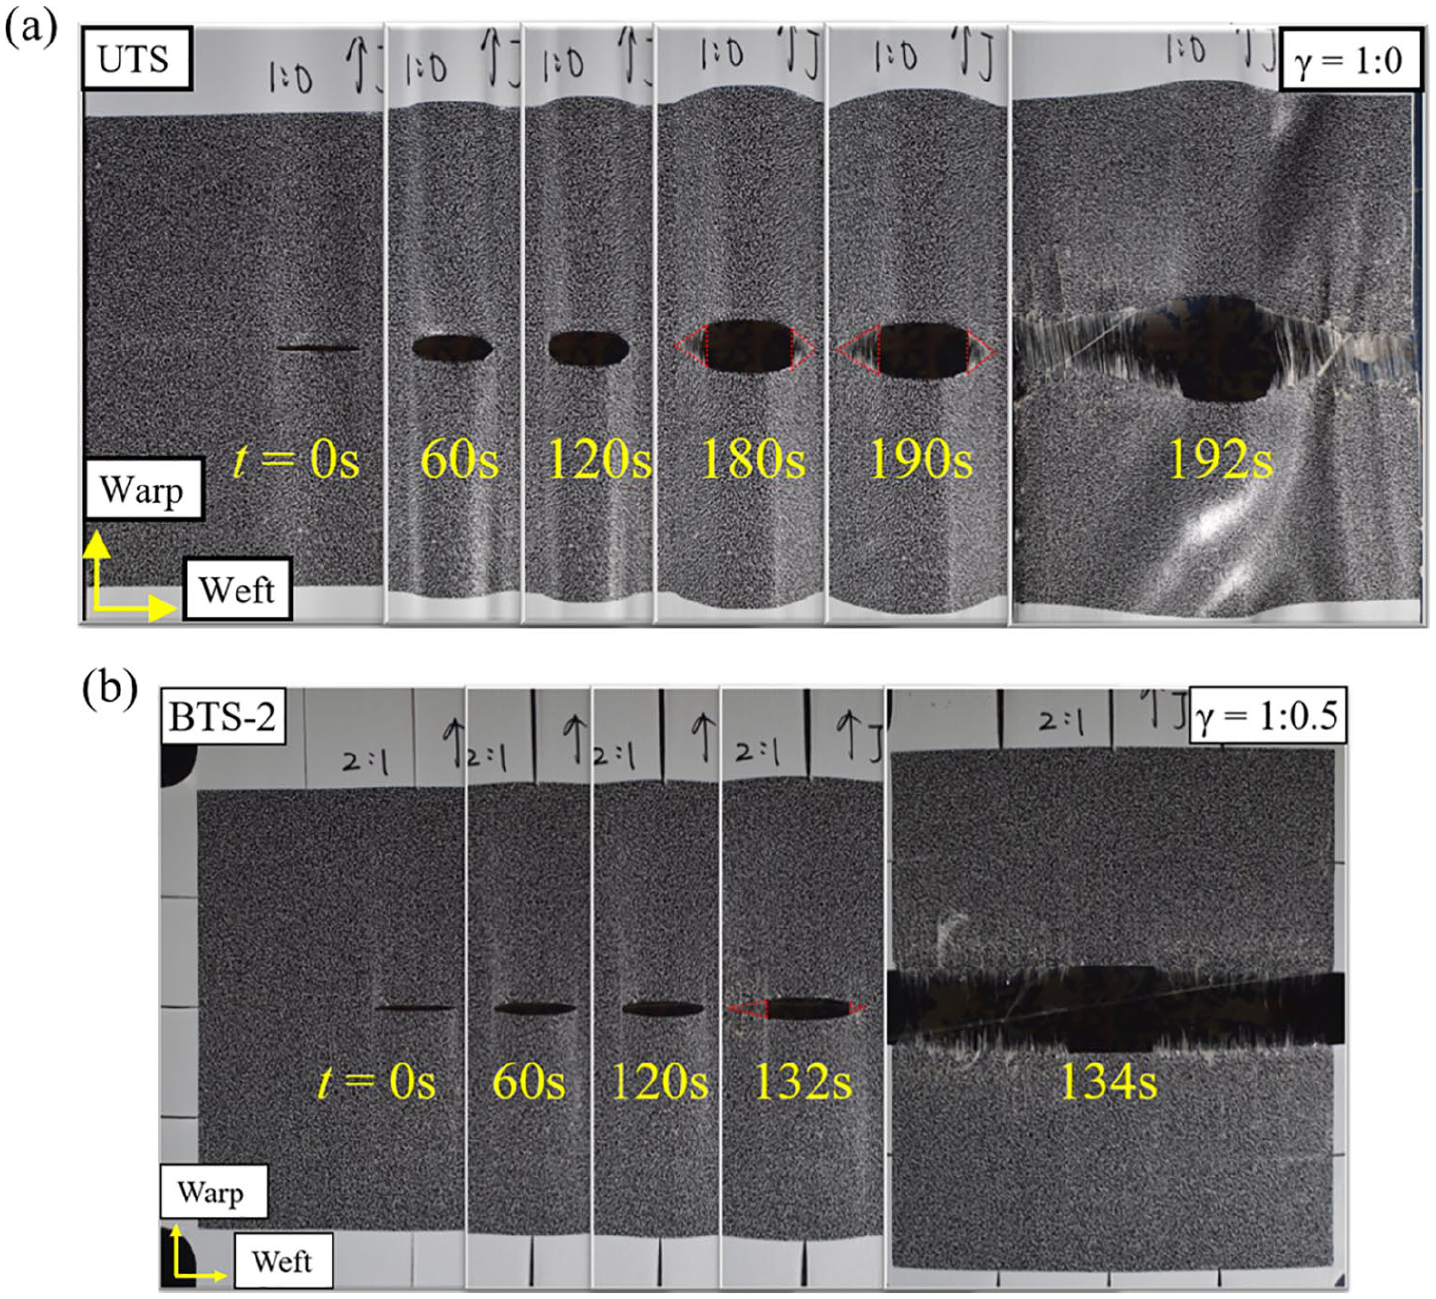
Test process of specimens: (a) UTS and (b) BTS-2.
As shown in Figure 8, the failure morphologies of BTS-1, 3, and 4 were the same as BTS-2. For BTS-5, unfortunately, debonding happened at a welding end before its crack propagated. Consequently, we could not measure the tear strength of BTS-5, which is excluded in the following analysis.
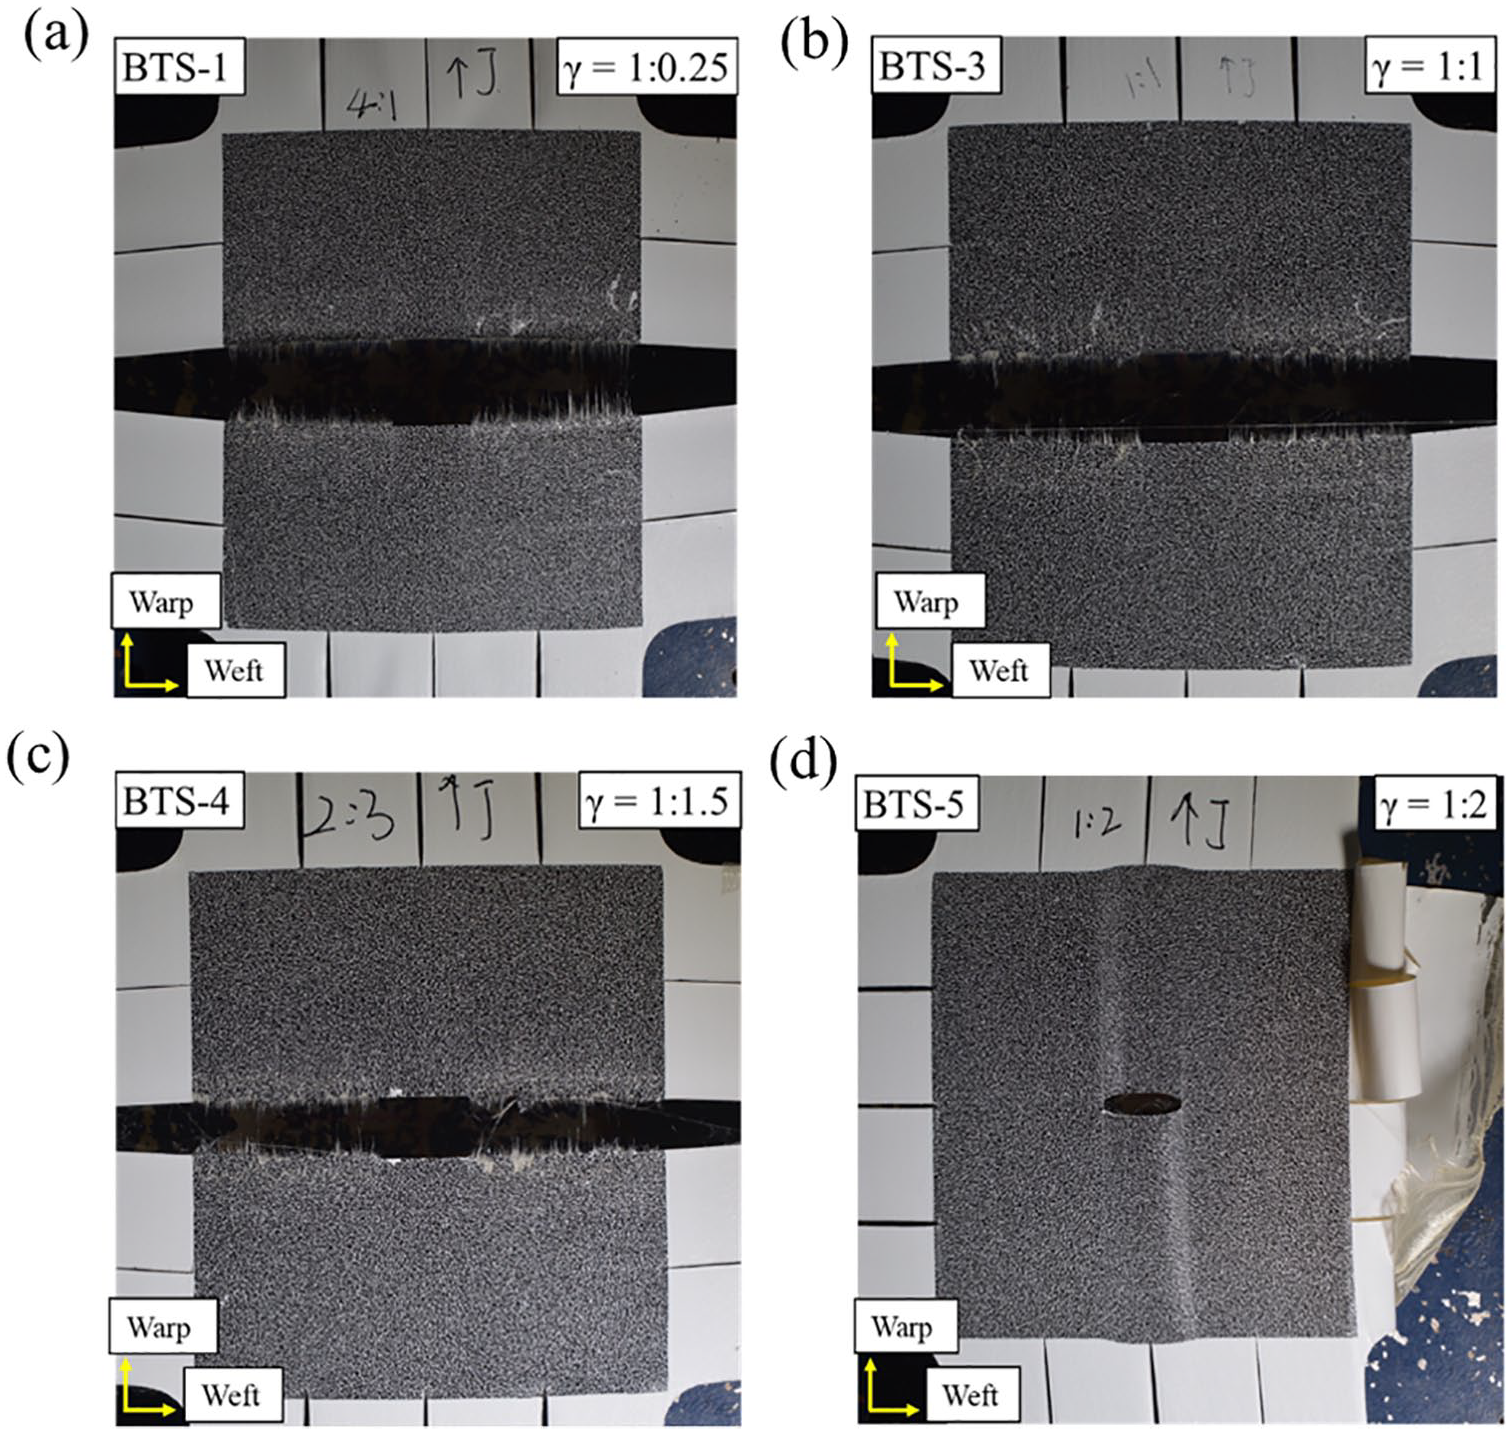
Failure of specimens: (a) BTS-1, (b) BTS-3, (c) BTS-4, and (d) BTS-5.
Figure 9 shows the deformation of specimens at t = 120 s. The crack-opening distance of UTS,

Deformation of specimens at 120 s: (a) UTS, (b) BTS-1, (c) BTS-2, (d) BTS-3, and (e) BTS-4.
Stress-displacement curves
Figure 10 presents stress-displacement curves of five specimens with different γ. The displacement is the elongation of an entire specimen in warp direction. Obviously, the peak stress (tear strength) of UTS was much higher than the others, while those of BTS-1to BTS-4 were close. The slopes of the five curves were small and similar, when the loading stresses were less than about 5 N/mm. The stresses then increased gradually faster. Otherwise, the warp displacement of BTS in the central section (160 mm × 160 mm) were generally lower than that of UTS since the weft stress suppressed crimp exchange. Hence, the BTS curves progressively shifted left of the UTS curve for stresses above 8 N/mm.

Stress-displacement curves of specimens.
Tear strength
Tear strengths of all specimens are listed in Table 2. The tear strength of UTS was 32.99 N/mm, which is 36.07% of warp tensile strength and over 20% greater than those of BTS. It illustrated that the weft loading force dramatically reduced the tear strength. On the other hand, no significant difference was found among the tear strengths of BTS (Figure 11). We could conclude that the loading stress ratio, ranging from 1:0.25 to 1:1.5, affected the tear strengths of BTS slightly.
Tear strengths of all specimens.


Tear strengths of all specimens.
Strain contour
Figure 12 shows the strain contours of UTS and BTS-2 at 10 s, 60 s, and 120 s. There were three different strain zones in each contour: low strain zone (L-zone), medium strain zone (M-zone), and high strain zone (H-zone). The strain in both M-zone and H-zone grew up significantly with the loading increasing, but the strain in L-zone changed a little. What’s more, the L-zone in UTS kept rectangular, whereas the L-zone in BTS gradually shrank to a triangular. Besides, due to the absence of weft tension, the UTS strain generated by straightening warp yarns via crimp interchange was higher than the BTS-2 strain. This resulted the total UTS strain in M-zone was higher at the same loading time.

Strain contours of specimens in warp direction: (a) UTS and (b) BTS-2.
Discussion
The objective of this work was to study effect of loading stress ratios on tear strength of a laminated fabric by conducting uniaxial and biaxial tear tests. To explain the effect, strain contours of UTS and BTS-2 were analyzed and compared.
We extracted the strains of UTS and BTS-2 along line A~D and exhibited them in Figure 13. At the same loading time, most of the strains in line A are higher than those in line C except the strains at the crack tip (inside the green rectangles in Figure 13(a) and (b)). Those unusual crack-tip strains (up to 14%) significantly exceed the fracture strain of Vectran fiber (about 4%), which is probably caused by the complex deformation – both tensile and shear deformation – or the interfacial debonding of PVF coating and yarns (Figure 14).
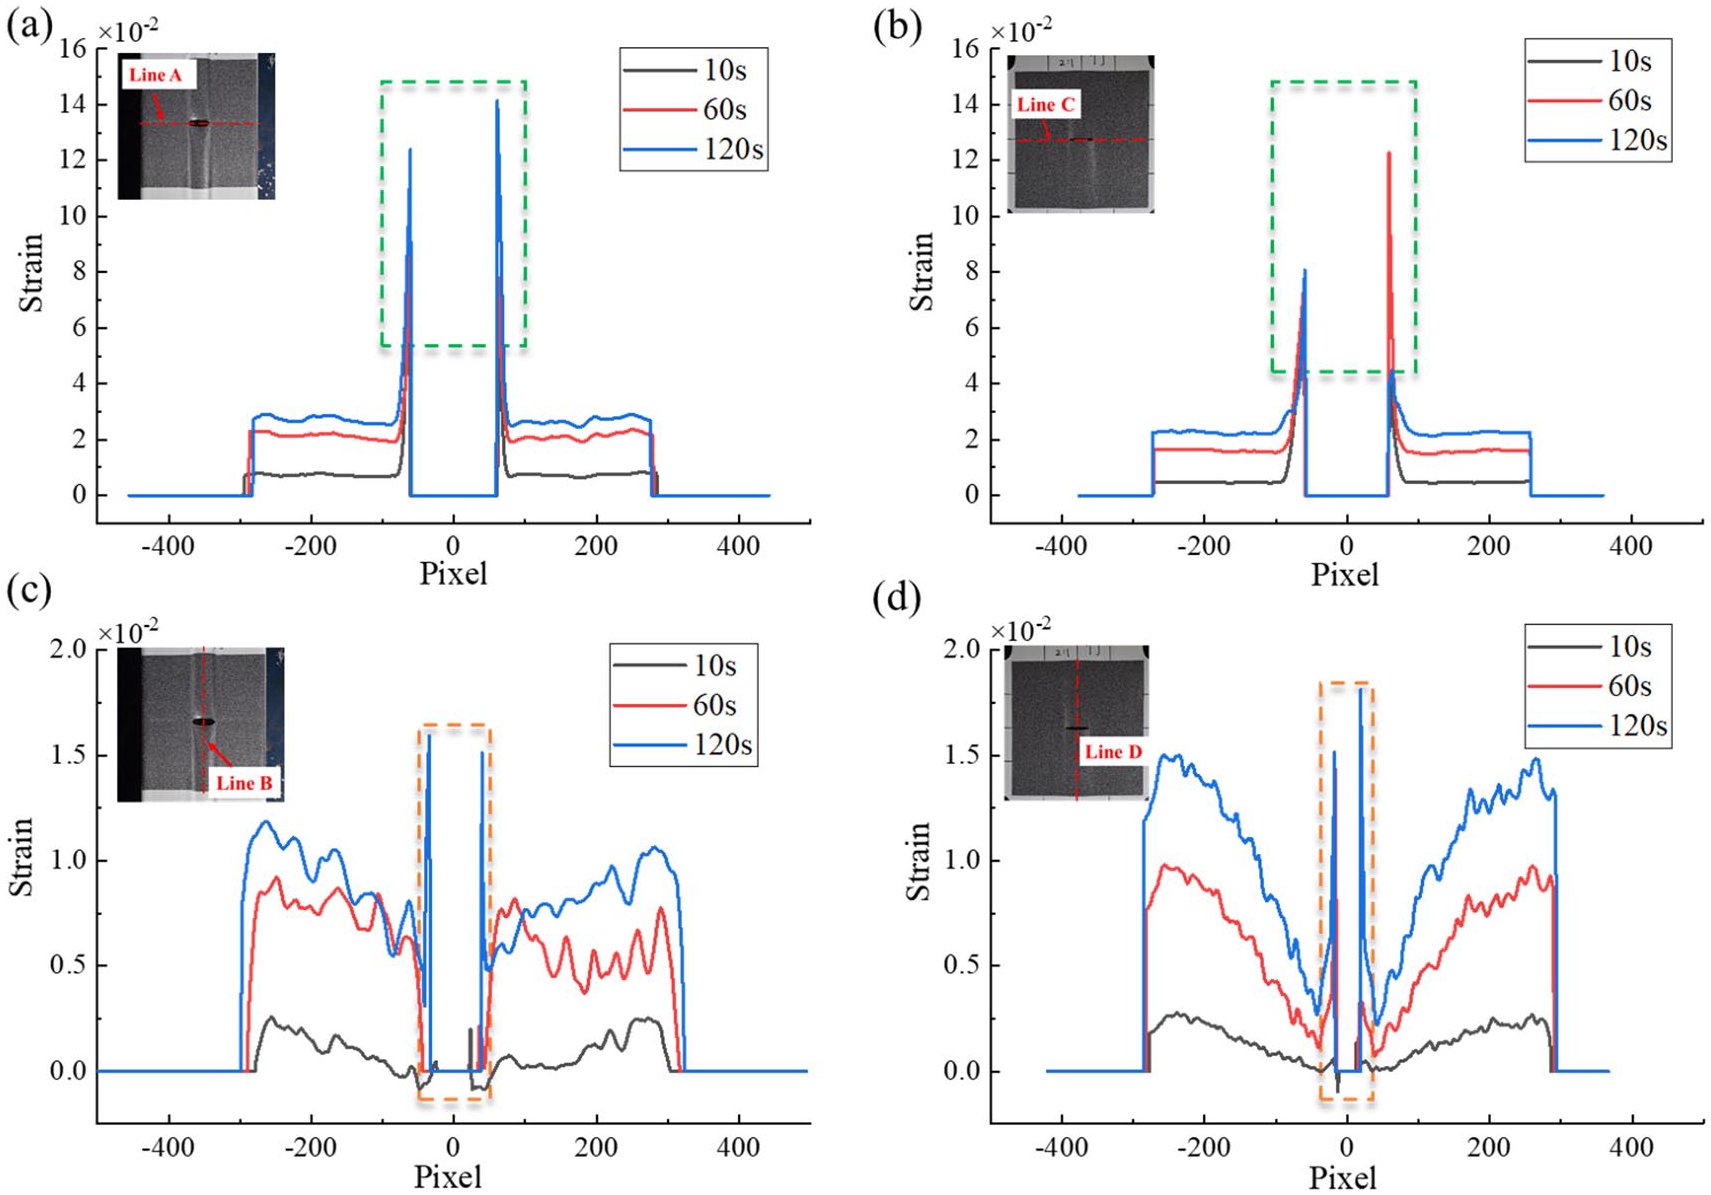
Strains of specimens: (a) UTS (Line A), (b) BTS-2 (Line C), (c) UTS (Line B), and (d) BTS-2 (Line D).

Interfacial debonding of PVF coating and yarns.
As shown in Figure 13(c) and (d), the strains in line B and line D are quite different. Outside the orange rectangles, the strains in line B increase slightly from middle to two sides; however, the strains in line D increase sharply. A possible explanation for this is that the warp deformation of BTS-2 is constrained by the weft tension. Contrary to expectations, some strains, which should be zero, close to crack edges (inside the orange rectangles) are too high. The reason for this is not clear but it may have something to do with the large displacement and distortion around the crack edges. Therefore, these strains are disabled and should be neglected.
Although the strain around the crack cannot be accurately measured by 2-D DSCM, the strain distribution of specimens was obtained approximately (Figure 12). This will help us to analyze the test result: the tear strength of UTS is higher than those of BTS.
According to the deformation of specimens (Figure 9), the sketches of yarn deformations around crack tips can be drawn approximately as shown in Figure 15. The max static frictional force (max-SFF) between warp and weft yarns at their crossing points is related to a loading stress ratio. Generally, a small loading stress ratio will lead to a large frictional force. Especially, the max-SFF of UTS would be much smaller than that of BTS, which means that several warp yarns around crack tips more easily slides at cross points in the case of UTS. This gives a possible explanation for the difference of the shape changes of L-zones in Figure 12.

The deformations of yarns around crack tips: (a) UTS and (b) BTS.
As mentioned in Introduction, a similar situation has been respectively studied by Hedgepeth, 20 Dyke and Hedgepeth 21 and Beyerlein and Phoenix, 22 where an ideally plastic behavior of the matrix adjacent to a broken yarn was assumed. Their results show that the SCF and limit shear stress decreases rapidly with increased load factor, which defined as the ratio of the load at infinity to the load at infinity required to raise the shear stress to the limit value. Therefore, it can be deduced that the SCF is positively correlated with the limit shear stress. According to the Godfrey et al.’s 12 work, the limit shear stress of a matrix may be regard as playing the same role as the max-SFF. It means the SCF is also positively correlated with the max-SFF. Then, the SCF of UTS, having smaller max-SFF, would be lower than that of BTS. Finally, we can conclude that the tear strength of UTS is higher than those of BTS.
However, this outcome is contrary to that of Chen and Chen 2 who found that the biaxial test can show a greater tear strength than the uniaxial test. This rather contradictory result may be due to the small size of uniaxial tear specimen in their test (Figure 1(a)). On the other hand, the loading stress ratios affect the tear strengths of BTS slightly. This result also differs from Chen and Chen’s. 2 In his test, the tear strengths of specimens vary with the loading stress ratios. This discrepancy could be contributed to the difference in coatings. In their case, the envelope material includes five functional layers.
The major limitation of the biaxial tear test is the absence of an airship’s radius and internal pressure on its envelope surface (Figure 16). These two factors may affect the tear strength of airship envelopes.34,35 This will be studied in our future work.

An airship envelope’s free-body diagram.
Conclusion
The present research aims to investigate the difference in tear strength of a laminated fabric for SSA between uniaxial and biaxial tear tests and the effects of loading stress ratio. We conducted tear tests on three uniaxial tear specimens and 15 biaxial tear specimens, whose ratios range from 1:0.25 to 1:2. Each one has a 30 mm-long central crack along weft direction. Their tear strengths were measured. 2-D DSCM was used to obtain the specimens’ strain contours, which clearly show three zones in each specimen – the low-strain zone, the high-strain zone, and the medium-strain zone.
This research has shown that the tear strength of UTS – 32.99 N/mm – is over 20% higher than those of BTS – 25.50 N/mm~27.25 N/mm. While, the loading stress ratio between 1:0.25 and 1:1.5 has a little influence on the biaxial tear strength. According to strain contours and previous research on imperfect composite materials, a possible explanation is that weft tension enlarges the max-SFF between warp and weft yarns, which increases the SCF of BTS on the first intact yarn at a crack tip. Hence, the cracks on BTS will propagate at lower stress than UTS. This new understanding should help to improve predictions of tear strengths of airship envelopes as well as other laminate fabrics.
Footnotes
Declaration of conflicting interests
The author(s) declared no potential conflicts of interest with respect to the research, authorship, and/or publication of this article.
Funding
The author(s) received no financial support for the research, authorship, and/or publication of this article.