
Abstract
To solve the problem of fatigue life prediction of notched 3D woven composites, a novel fatigue life prediction method based on progressive damage and field intensity theory is proposed. By analyzing the initial loading process of 3D woven composite structure based on progressive damage method, the stress field when the fatigue damage develops gently and the dangerous area where the fatigue damage occurs first are obtained. Then combining with the concept of notch field intensity function, the failure criteria of composites and the three-dimensional space vector stress field intensity method, the fatigue damage degree field intensity of the fiber yarns in the dangerous area is analyzed and the most damaged fiber yarn is found. The fatigue life of the structure is calculated with the field intensity equivalent stress and the S-N curve of this fiber yarn. In order to verify the effectiveness of this method, the fatigue life of notched 3D woven composites under several stress levels is predicted and compared with the existing experimental data. The compared results show that the fatigue life prediction values are all within the two-fold error bounds of the experimental data, which are in good agreement with experimental results. Compared with the progressive damage fatigue life prediction method of woven composites, the prediction accuracy of the method proposed in this paper is improved by 31.5% on average, and the calculation efficiency is also greatly improved.
Introduction
Woven composite is a high-performance composite material. It is composed of several groups of fiber yarns interwoven along with their respective directions and then compounded with the matrix material. 1 Based on the fabric’s structures, woven composites are divided into 2-dimensional woven composites (2DWC) and 3-dimensional woven composites (3DWC). 2DWC have high specific strength and specific modulus, but their performance in the thickness direction is poor. 2 Compared with 2DWC, 3DWC have better structural integrity, fracture toughness, and anti-fatigue performance.3–5 With the excellent performance and low cost, 3DWC have been extensively used in aerospace, automobile, civil infrastructure, and other fields. 6
In recent years, lots of researchers have studied the fatigue behavior of 3DWC.7–10 However, there are relatively few studies on fatigue life prediction method. Ding et al. 11 and Yan 12 predicted the residual modulus of the material by studying the dynamic mechanical properties of 3DWC, and predicted the fatigue life with the residual strength model. By studying the relationships between fibers fracture, cycle number, fatigue peak stress, and interface wear damage mechanism based on the global load sharing criterion, Li 13 established the fatigue life prediction method of 3D woven ceramic-matrix composites. Wicaksono and Chai 14 studied the fundamental properties of woven composites under cycle loading, and predicted the fatigue life of the material combining with stiffness decay model. Qiu et al. 15 and Song et al. 16 established the progressive damage fatigue life prediction method (PDM) of 3DWC based on the degradation laws of component material properties, combined with failure criteria and stiffness reduction method. PDM can effectively reflect the development process of fatigue damage, and has been widely used in the fatigue life prediction of 3DWC. However, the disadvantages of PDM are also obvious. With the degradation of component materials properties, it is necessary not only to carry out iterative calculations with an increase of fatigue cycles, but also to reduce the material stiffness under the current number of cycles, which consumes a lot of calculation time.
In practical application of 3DWC, it is inevitable that there will be holes, which will lead to stress concentration. Stress field intensity method (SFI) is a strength and fatigue life analysis method considering the influence of stress gradient.17,18 Because of its excellent calculation accuracy and efficiency, SFI has been widely used in fatigue life prediction of isotropic materials such as metals.19,20 Due to the complex microstructure of 3DWC, the boundaries between the different component materials are obvious. This structure not only makes the stress field intensity calculation area discontinuous, but also makes the stress of fiber yarn too large under the condition of stress concentration, which makes it difficult to predict the fatigue life with SFI. Therefore, the current applications of SFI in the field of woven composites are almost limited to structural strength prediction,21,22 and there are just a few studies on fatigue life prediction. 23
In this paper, aiming at the fatigue life prediction of notched 3DWC, we combine PDM with SFI and take the advantages of the two methods to establish a progressive damage-field intensity fatigue life prediction method (PDFIM). Compared with PDM and SFI in the literatures,15,16,23 PDFIM has made some advancements in the following aspects: (i) Compared with PDM, the calculation efficiency of PDFIM has been greatly improved by reducing the number of iterative calculations; (ii) In the process of calculating the stress field intensity of 3DWC, the homogenization of the composites is avoided, and the influence of the microstructure of the composites on the fatigue life is considered; (iii) Based on the failure criteria of materials and SFI, a method to evaluate the overall fatigue damage degree of anisotropic materials is established. In the following sections, the development law of fatigue damage of 3DWC is introduced, which is the basis of PDFIM, and the theory and the program realization of PDFIM are proposed. In addition, by comparing the fatigue life prediction values of notched 3DWC with the existing experimental data, the effectiveness and advantages of PDFIM are verified.
Fatigue damage development law of 3DWC
The fatigue damage development process of 3DWC is plotted in Figure 1. As shown, the process is mainly divided into three stages and the expansion rate of fatigue damage generally shows the rule of “fast first, then slow and then fast.”16,24 At the beginning of fatigue life, the damage of 3DWC includes a small amount of transverse cracking damage of fiber yarns and some matrix cracking damage, and the former occurs mainly at the intersection of fiber yarns. In the middle stage of the fatigue life, the damage of composites just extends slightly, and only some longitudinal fracture damage occurs in a few fiber yarns which are in the load direction. At the end of the fatigue life, a large amount of longitudinal fracture damage of fiber yarns occurs in the composites and extends along the vertical load direction, accompanied by a large number of transverse cracking damage of fiber yarns and matrix cracking damage. Finally, a large number of longitudinal fracture damage across the fiber yarns leads to structural failure.
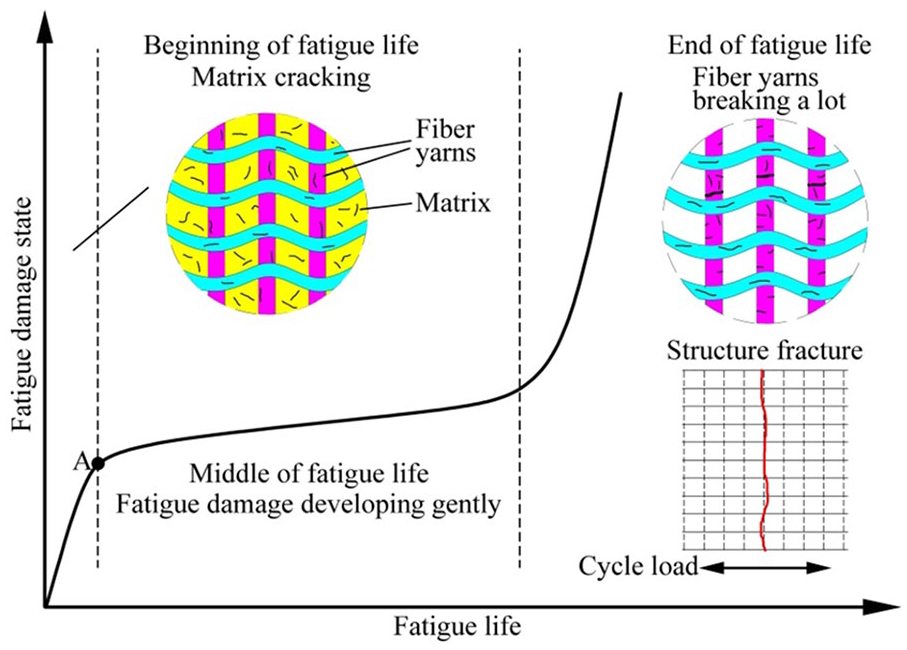
Fatigue damage development process of 3DWC.
By further studying the fatigue damage development law of notched 3DWC, Song 25 found that there was some damage in the structure under the initial cycle load. Due to the stress concentration phenomenon caused by the opening, a small part of the fiber yarns near the notch are damaged in addition to the matrix. Fatigue damage will cause continuous stress redistribution during the load cycles, and according to Song et al.’s 25 research, compared with the later process, the initial cycle load will cause greater fatigue damage, which will lead to more severe stress redistribution. In the later process, the generation of damage and the stress redistribution will tend to be gentle. Therefore, we assume that after the initial cycle loading process is completed, the fatigue damage will enter a gentle development stage, which accounts for the majority of the fatigue life, and the fatigue damage at point A in Figure 1 is the damage at the completion of the initial loading of the structure. And we take the stress state at this point as the research object, and regard the fatigue life of the most damaged fiber yarn at this state as the fatigue life of the whole 3DWC.
Description of PDFIM
Based on the fatigue damage development law of 3DWC, PDFIM is mainly divided into three parts: in the first part, PDM is used to analyze the stress in the initial loading process of the composite structure. The stress field when the fatigue damage develops gently and the structure’s dangerous area in the process of cycle loading are obtained. In the second part, combined with the concept of notch field intensity function, the fatigue damage degree field intensity (FDDFI) of the fiber yarns in dangerous area is analyzed by using the three-dimensional space vector stress field intensity method (TSVM) and the fiber yarns failure criteria. In the third part, the field intensity equivalent stress of the maximum FDDFI fiber yarn is calculated, and the fatigue life of the whole structure is calculated based on the fiber yarn fatigue life model (S-N curve).
Stress analysis of structure under cycle load with PDM
Under the maximum fatigue load F, when cycle number increases from

where
To simulate the initial loading process, the cycle number n and the cycle number increment ∆

For the structure of notched 3DWC, equation (2) can be solved by the finite element method to obtain the displacement increment and the geometrical variations. However, as a part of the component materials are damaged under load, the stiffness matrix of this part of the materials will degenerate, and the stress of the structure will be redistributed. Specific failure criteria and stiffness degradation scheme are in the next section. At this point, equation (2) needs to be solved iteratively by the finite element method until no new damage occurs.
Failure criteria and stiffness degradation scheme of component materials
When the structure is subjected to cycle load, the component materials of 3DWC are damaged. At this time, there are mainly the following damage modes: fiber yarn tensile damage in the longitudinal direction and transversal direction; fiber yarn compressive damage in the longitudinal direction and transversal direction; pure resin matrix damage. Pure resin matrix can be regarded as isotropic material. Therefore, in this paper, the improved 3D Hashin failure criteria 26 and the Mises criterion are used as failure judgment criteria for fiber yarn and pure resin matrix, respectively. The specific form can be given as follows:
(i) Fiber yarn tensile damage in longitudinal direction:

(ii) Fiber yarn compressive damage in longitudinal direction:

(iii) Fiber yarn tensile damage in transversal direction:

(iv) Fiber yarn compressive damage in transversal direction:

where
(v) Pure resin matrix damage:

where
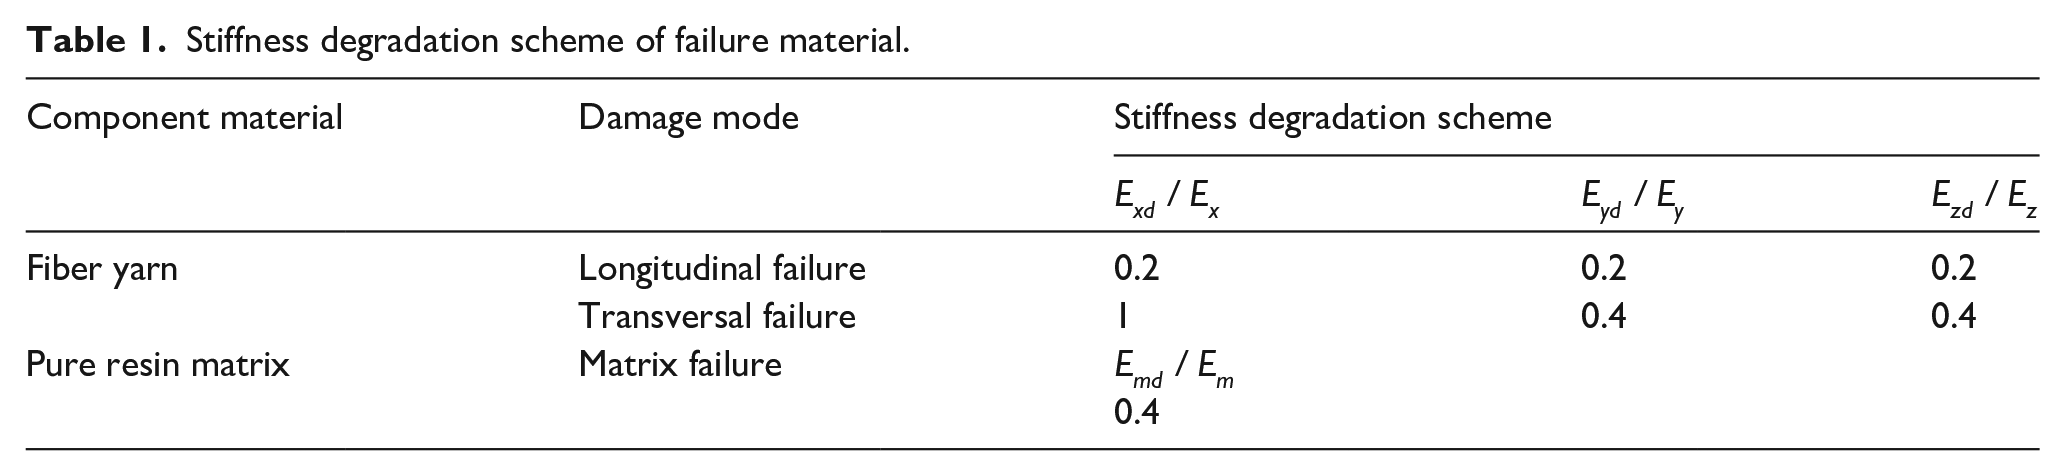
After the component materials’ failure judgment is completed, to simulate the changes in the structural bearing capacity, it is necessary to degrade the stiffness of the damaged materials that meet the failure criteria. The stiffness degradation scheme by Song et al. 27 is used here. The specific form is shown in Table 1, where the subscript d represents the stiffness of material after failure.
Stiffness degradation scheme of failure material.
Based on the failure criteria and stiffness degradation scheme of component materials, the finite element method is used to iteratively solve equation (2) until no new damage occurs. At this time, the simulation of the initial cycle loading process is completed. The structure’s current damage state can be regarded as the initial damage state, and the dangerous area of the structure under cycle load can be determined. Meanwhile, the current stress field can be regarded as the stress field when the fatigue damage develops gently.
FDDFI calculation of fiber yarns in dangerous area
After obtaining the stress field and the dangerous area during the gentle development of fatigue damage, it is necessary to find the most damaged fiber yarn in the dangerous area. In this section, combining the concept of notch field intensity function with the failure criteria of fiber yarn, the variable of fatigue damage degree (FDD) is defined, which can represent the damage degree of fiber yarn under cycle load. In addition, the calculation method of FDDFI is established by combining TSVM and FDD.
The notch field intensity function is defined as 21

where D is the field intensity area, which indicates the damage area at the notch of the composite (Figure 2); R is the radius of the notch; S is the area of D;
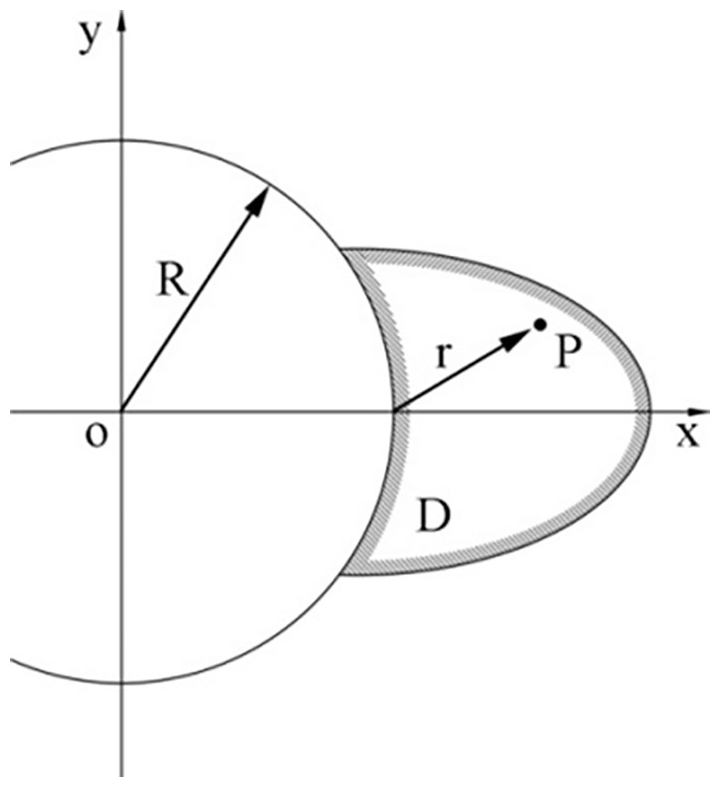
Field intensity area.
In order to measure the overall damage degree of fiber yarn in 3D damage area, the concept of notch field intensity function is extended to the 3D space. At this time, the fiber yarn failure criteria (equations (3)–(6)) can be used as the failure surface function

When the FDD of a point in the damage area is equal to 1, the stress state of the point meets the fiber yarn tensile failure criterion in longitudinal direction. Therefore, the FDDFI in 3D space is expressed as

where Ω is the 3D damage area. However, owing to the fact that the 3D space shape of the composite structure is sometimes irregular in practical engineering applications, it is difficult to describe the integral domain mathematically. Therefore, equation (10) is not convenient to use directly in the actual application.
Combined with the calculation process of 3D field intensity equivalent stress in TSVM, 28 the FDDFI in 3D space can be rewritten. As shown in Figure 3, the 3D damage area is determined by the intersection region of the fiber yarn structure and the sphere centered on the dangerous point. The dangerous point is the maximum FDD point in the fiber yarn structure, and the radius of the sphere will be discussed later.

Three-dimensional calculation space of damage area in fiber yarns.
In TSVM, the 3D field intensity equivalent stress is obtained by summing the projections of the one-dimensional field intensity equivalent stress of each calculation direction on the main calculation direction. According to this calculation process, the FDDFI in 3D space in equation (10) can be rewritten. The specific process is as follows:
The one-dimensional FDDFI of the kth calculation direction

where
According to the calculation process in TVSM, the FDDFI in 3D space is expressed as

where N is the number of calculation directions in 3D calculation space;
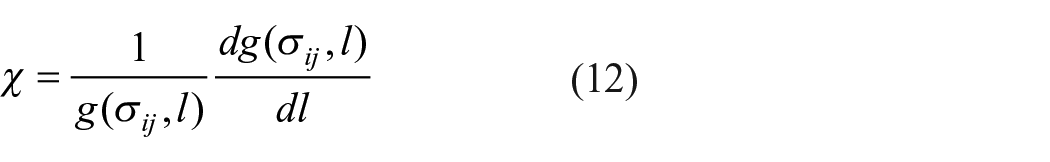
Substituting equation (9) into equation (11), the FDDFI in 3D space of fiber yarns is obtained:

It can be found that
In the calculation process of FDDFI, the radius of the 3D calculation space should not be greater than the width or thickness of the fiber yarn. As shown in Figure 4, if the radius of the sphere is larger than the size of the fiber yarn, such as r1, a part of the sphere will exceed the geometric structure of the fiber yarn, and the calculation directions of this part of the sphere will be lost, such as the calculation direction q1. When the radius is smaller, such as r2, all calculation directions in the intersection region will be considered. Finally, by comparing the FDDFIs of each fiber yarn, the fiber yarn closest to complete damage is obtained. In fact, the process of failure judgment and stiffness reduction is a process of stress redistribution. In this process, the effect of completely failed fiber yarns on fatigue life of structure has gradually transferred to other fiber yarns. Therefore, when the fatigue damage develops gently, the whole structure’s fatigue life is determined by the stress state of the fiber yarn closest to complete damage. If a fiber yarn has been completely failed, its FDDFI will not participate in the comparison.
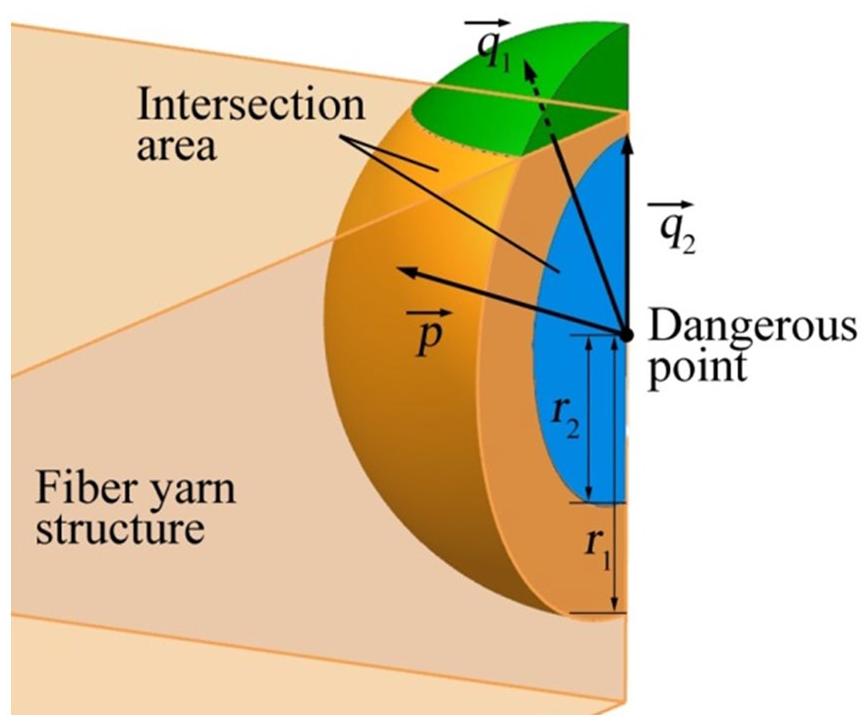
Influence of radius of intersection region on calculation direction.
Fatigue life calculation
After the fiber yarn with the largest FDDFI is determined, the fatigue life is calculated by SFI. In the previous section, the main calculation direction in 3D damage area has been obtained in the FDDFI calculation process. The largest relative FDD gradient is in this direction, so it can be considered that the material damage changes fastest in the main calculation direction, which can be regarded as the fatigue damage propagation direction.
The field intensity equivalent stress in the main calculation direction can be obtained with SFI:

where

where
It is worth mentioning that since the fiber yarns’ fatigue life determines the fatigue life of 3DWC in PDFIM, the application scope of PDFIM is not limited by the load ratio (R = load min/load max). When the load ratio is between −1 and 1, as long as the fatigue life model of the fiber yarn under this load ratio is known, the fatigue life of the composite can be predicted by PDFIM.
The program realization of PDFIM
Figure 5 shows the program flow chart of PDFIM, which is mainly divided into three parts:
(i) Progressive damage analysis of the initial loading process;
(ii) Calculation of FDDFI of fiber yarns in dangerous area;
(iii) Calculation of fatigue life of 3DWC.

Program flow chart of PDFIM.
Fatigue life prediction results and verification
Fatigue tests results of 3DWC
In order to verify the effectiveness of PDFIM, the experimental results by Song 29 are selected as the comparison objects. Song performed warp direction tensile-tension fatigue tests of centrally notched 3D angle-interlock woven T300/QY8911-IV composite plates under several stress levels (85%, 82%, 80%) at room temperature, and the load ratio was 0.1. The notched plate’s strength in warp direction was 417 MPa, so the applied maximum stresses under the three stress levels were 355, 342, and 334 MPa. Two samples were tested under each stress level and the fatigue life value was the average of the results.
The fabric used in the tests adopted a curved shallow-crossing linking structure, and the yarn density of warp and weft was 10 and 3.5 (tows/cm), respectively. There were six layers of weft in the thickness direction. The 3DWC were prepared from the fiber yarn and the matrix by the resin transfer molding (RTM) technology. The mechanical properties of carbon fiber and resin matrix are shown in Table 2, and the geometric size of the samples is shown in Figure 6.
The mechanical properties of carbon fiber and resin matrix.

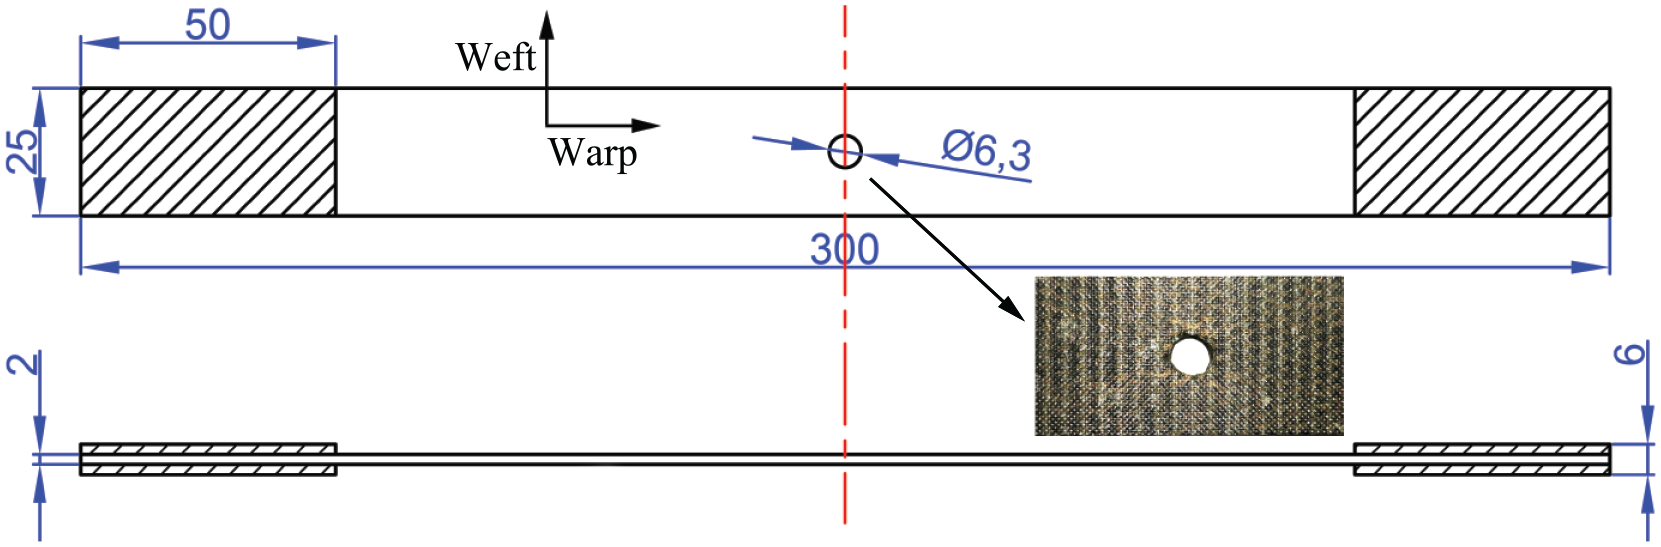
Geometric size of centrally notched 3DWC plates (mm).
The tests results are shown in Table 3.
Warp direction tensile-tension fatigue tests results.

Fatigue life prediction
Finite element model of 3DWC
The 1/4 structure of the centrally notched 3DWC plate is selected as the object, and the finite element model of the 1/4 structure is established. As shown in Figure 7, six full-thickness unit cells are arranged along the edge of the notch in the width direction of the structure, including four intact unit cells and two incomplete unit cells affected by the notch. The elements of these unit cells are refined, which are called small-size elements. The structure far away from the notch is meshed by hexahedral elements. These elements are large-size elements. Owing to the fact that the nodes on both sides of the joint surface of the two different size elements are not completely coincident, this situation will lead to errors in the process of finite element calculation. Therefore, the elements of these two sizes need to be connected by constraint equations or other methods.

Finite element model of 1/4 centrally notched 3DWC plate.
Initial loading damage simulation
Taking the calculation process under the 85% stress level as an example, the initial loading process of the finite element model is simulated by PDM. The stress field during the gentle development of fatigue damage and the dangerous area of the structure under the cycle load is obtained.
The damage of the finite element model when the initial loading process is completed is shown in Figure 8. As shown, the dangerous area during cycle loading is the two-unit cells next to the notch. Affected by the phenomenon of stress concentration, a large amount of damage will occur along the width direction of the structure in each component in the dangerous area after the initial load. Several warp yarns even have longitudinal damage across the fiber yarn, indicating that they have been completely damaged.

Damage of each component of the structure.
As shown in Figure 9(a), before the progressive damage analysis, there is obvious stress concentration in the warp yarns next to the notch, so that the local stress value is very large. When SFI is used to predict fatigue life, it is necessary to substitute the field intensity equivalent stress into the S-N curve to get the predicted value. If equation (15) is directly used to calculate the field intensity equivalent stress of the fiber yarn this moment, the value of the equivalent stress will be very large, even greater than the fiber yarn’s strength. If this equivalent stress is substituted into equation (16) for fatigue life prediction, the result will show that the whole structure will be failed immediately. However, in fact, only a part of the fiber yarns next to the notch are failed at this moment, and the whole structure is not completely destroyed. According to the difference between the two figures in Figure 9, it can be seen that the stress concentration phenomenon in the structure has been effectively alleviated due to the stress redistribution in the process of progressive damage analysis. Compared with Figure 9(a), it can be seen that the stress distribution in Figure 9(b) is smoother, which indicates that the stress concentration phenomenon has been significantly improved.

Stress field of warp yarns before and after progressive damage analysis.
Warp yarns FDDFI calculation in dangerous area
When the 3DWC structure bears the warp direction tension-tension cycle load, most of the load is on the warp yarns, and the weft yarns are slightly damaged and the stress state of the weft yarns has little effect on the fatigue life of the structure. Therefore, only the damage degree of warp yarns is discussed here. The damage of the three rows of warp yarns next to the notch at the completion of the initial loading is shown in Figure 10. As shown, the first and second rows of warp yarns have longitudinal damage across the fiber yarns, which indicates that all of these warp yarns have been longitudinally fractured. In contrast, in the third row of warp yarns, only two warp yarns of No. 1 and No. 5 are broken similarly, while the middle three warp yarns are not completely broken.

Damage of warp yarns next to the notch.
Therefore, only the FDDFIs of the middle three warp yarns need to be calculated and compared. The calculation results are shown in Table 4. It can be seen that the degree of longitudinal damage of the warp yarn number (iv) is the largest.
FDDFIs of warp yarns in dangerous area.

Fatigue life calculation with SFI
In the previous section’s calculation process, the main calculation direction of the 3D damage area of the fiber yarn with the maximum FDDFI is obtained, and the direction vector of the main calculation direction is [0.042, 0.065, −0.103]. It can be concluded that the relative FDD gradient in this calculation direction is the largest, which means the longitudinal damage develops fastest, and this direction can be considered as the damage propagation direction. SFI can be used to calculate the field intensity equivalent stress

Longitudinal stress and relative stress gradient of main calculation direction.
The fatigue life of this warp yarn, that is, the fatigue life of the whole 3DWC structure, is obtained by substituting the field intensity equivalent stress
Prediction results and tests data.

The comparison result is shown in Figure 12. It can be seen that under various stress levels, the prediction results of the warp direction tension-tension fatigue life of centrally notched 3DWC plates by PDFIM are all within two-fold error bounds of the experimental data, which indicates that this method can predict the fatigue life well. Compared with the PDM prediction results, the prediction accuracy of PDFIM is reduced by 11.9% at the stress level of 85%, while it is improved by 79.6% and 26.7% at the stress level of 82% and 80%, respectively. The prediction accuracy is increased by 31.5% on average.

Prediction results of PDM and PDFIM.
Comparison of calculation efficiency between PDM and PDFIM
From the progressive damage analysis process of 3DWC, 15 it can be seen that the calculation efficiency of PDM is most affected by two factors: cycle increment and the number of iteration calculations per cycle. In this paper, when calculating the 85% stress level example, the total number of elements in the model is 316912, cycle increment and the number of iteration calculations per cycle are 500 and 10, respectively. In the final stage of fatigue life, cycle increment is reduced to obtain an accurate fatigue life prediction value. On the computers with the same hardware level (Intel Xeon E3-1230 quad-core @ 3.30GHz 8GB RAM), the time required for PDM to predict the fatigue life is 49 h, while that for PDFIM is only 2.5 h. Therefore, it can be seen that the calculation efficiency of PDFIM is improved by 94.8% compared with PDM.
In theory, to ensure the accuracy of the progressive damage stress analysis, the cycle increment in the calculation process should be small enough, and the number of iteration calculations per cycle should be large enough. However, in the actual calculation process, to shorten the calculation time, the cycle increment can be increased or the number of iteration calculations can be reduced appropriately. The PDFIM proposed in this paper only carries out progressive damage analysis during the initial loading process, so the number of iteration calculations is the total number of calculations. And compared with the progressive damage calculation process, the calculation time of FDDFI and the fatigue life is almost negligible. Assuming that the fatigue life of a structure is 10,000 cycles, Figure 13 shows the total number of calculations of the two methods under different conditions. It can be seen that the total amount of calculation of PDFIM is far less than that of PDM. With the improvement of the prediction accuracy of the latter, the gap of calculation efficiency between the two methods is becoming larger and larger.

Total number of calculations in different methods.
Conclusion
In this paper, aiming at the problem of fatigue life prediction of notched 3DWC, a novel method of PDFIM is proposed. Meanwhile, FDD, a variable used to measure the damage degree of fiber yarn and the calculation method of FDDFI in 3D space are defined. By comparing the fatigue life prediction values of notched 3DWC with the experimental data, conclusions can be listed as follows:
(i) When predicting the warp direction tension-tension fatigue life of the centrally notched 3D angle-interlock woven T300/QY8911-IV composite plates, the predicted results of PDFIM under several stress levels are all within two-fold error bounds of the experimental data, which verifies the effectiveness of this method.
(ii) Compared with PDM, the prediction accuracy of PDFIM is improved by an average of 31.5% under several stress levels. In addition, due to the total calculation amount reduction, the calculation efficiency is greatly improved.
(iii) Due to the limitation of test conditions and existing experimental data, it is unable to further verify the accuracy of PDFIM in other situations, such as different load ratio, temperature, notch size and so on. Under these conditions, the scope of application of PDFIM needs to be determined in future work.
Footnotes
Appendix
In order to allow readers to read this paper more clearly, Table A.1 lists the meanings of some abbreviations that are frequently used and easily confused.
Declaration of conflicting interests
The author(s) declared no potential conflicts of interest with respect to the research, authorship, and/or publication of this article.
Funding
The author(s) received no financial support for the research, authorship, and/or publication of this article.