
Abstract
In the process of fabricating a three-dimensional (3 D) woven perform, the variant structures introduced during adding and reducing tows, lead to changes of local tow orientation and woven pattern, which affects the mechanical response of 3 D woven composite. In this study, specimens with variant structure were manufactured by adding and reducing tow techniques, and representative unit cells of normal and variant structure were established by topological method. A multi-scale damage model was proposed to analyze the damage behaviors and predict the strength of 3 D woven composites with the user subroutine UMAT of ABAQUS/Standard. The results show that the variation of tensile modulus and strength between the experimental and simulation value were less than 4%. In addition, it is proved that the damage propagation of the macro-scale model with variant structure can be successfully captured.
Keywords
Introduction
Due to their excellent multi-directional load bearing capacity, higher delamination resistance, and better impact performance, three-dimensional woven composites (3DWC) are widely applied in structural components various fields, including aerospace, automotive, marine, civil engineering, etc. [1–3]. However, the geometry of 3DWC is usually complex in practical applications, such as turbine blade, radome, nozzle, etc [1,3–5]. Especially when the cross-section of the composite component varies along the longitudinal direction, cutting the composite according to the designed dimensions is a routine method. However, post-processing techniques deteriorate the mechanical properties of composite due to fiber damage [6,7]. In order to maintain the integrity of the fiber structure and the stability of composite, the near-net-shape technique of 3DWC has attracted researcher's attention.
Based on the cross-section change along the longitudinal direction of the composite, adding tow, reducing tow or adding-reducing tow technique can be selected in the weaving process. In previous researches, many efforts have been devoted to analyze the influence of the technique on the mechanical properties of 3DWC, including tow fineness-change [8], unit tow-reduction [7,9], row or column tow-reduction [6]. During the application of adding and reducing tow, local variation structures were formed, such as throughout holes, tow offset, woven pattern changes, etc [10]. The above researches showed that the fractures of the specimens with variant structure is usually located at the position of the cross-section change, that is, the tow-addition or tow-reduction region, due to the stress concentration.
The tow interwoven architecture of 3DWC can have an effect on damage behavior in a complex way [11]. Multi-scale progressive damage model has been broadly employed to analyze the damage and failure behavior of 3DWC in on-axis tension [12,13], off-axis tension [14], compression [15,16], flexure [17] and impact [18,19]. But limited works have been reported on investigating the mechanical properties of 3DWC with variant structure, and its failure behaviors are still not fully understood.
In order to eliminate the influence of geometric dimension, the uniform cross-section of the 3DWC specimens with the variant structure were prepared by the adding-reducing tow technique. The topology method was used to characterize the spatial structure change of the tow. The meso-scale and macro-scale progressive damage models were established respectively to analyze the influence of variant structure on the failure mode of 3DWC. The experimental results were compared with the modeling to verify the consistency.
Materials and experimental methodology
Manufacturing 3D woven fabric
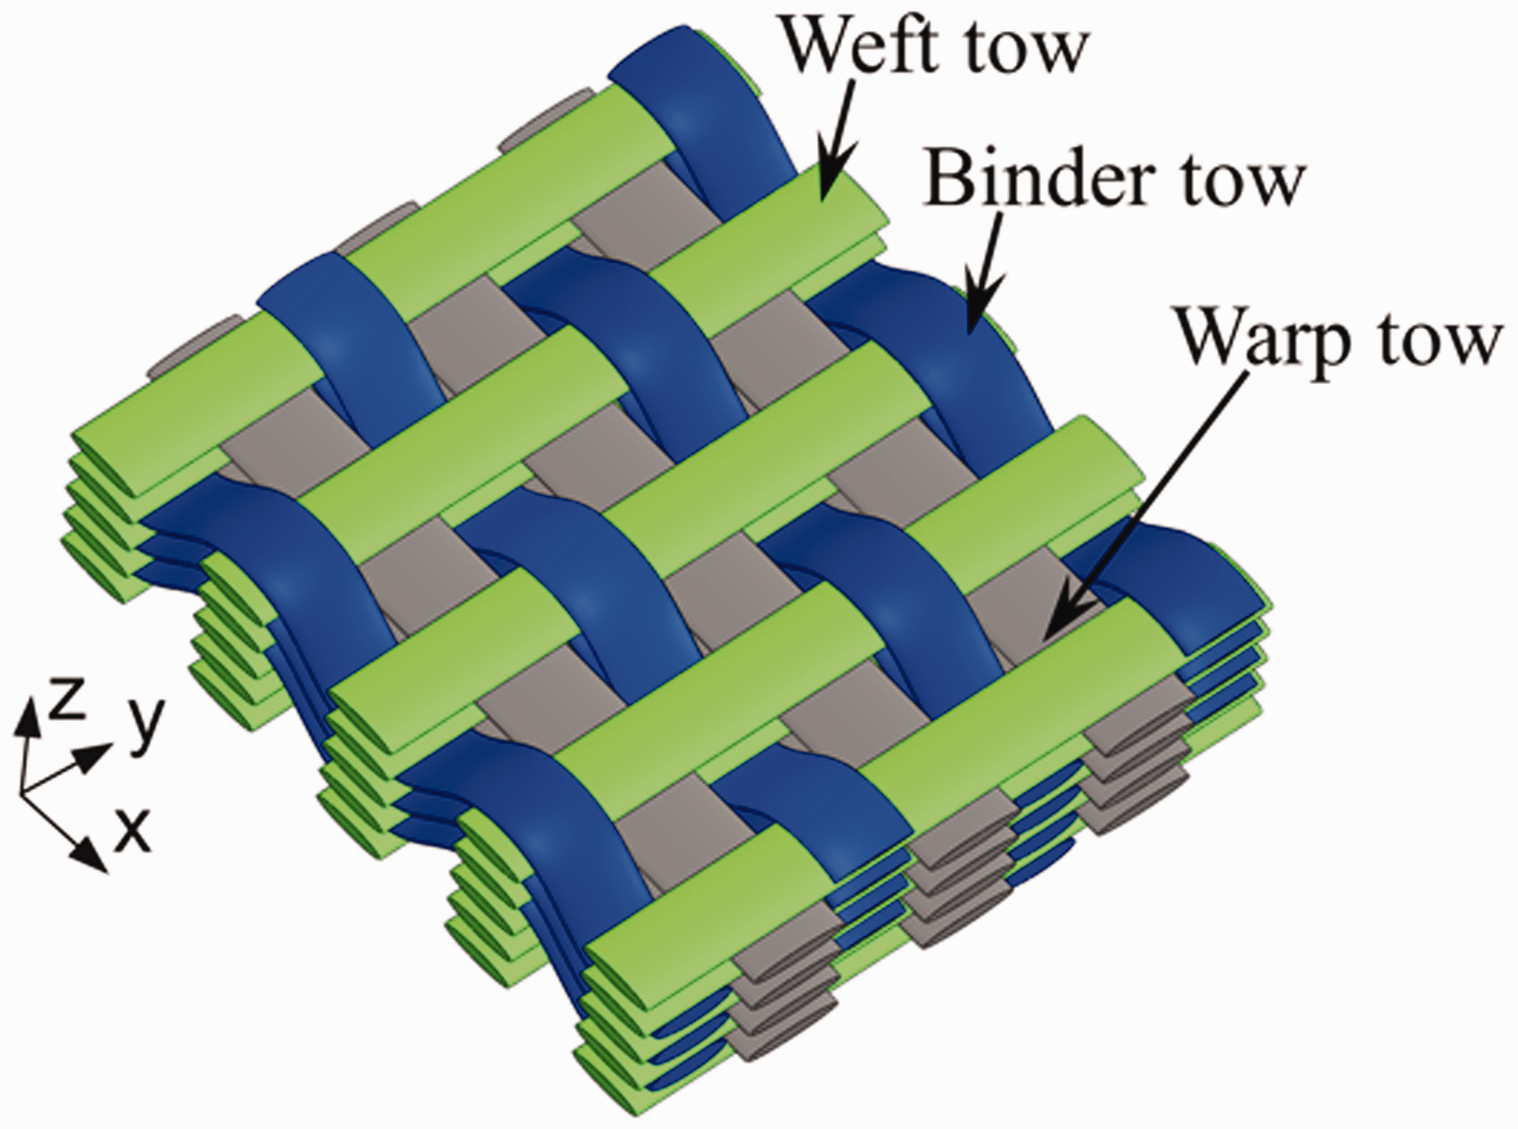
The three-dimensional woven fabric (3DWF) used in this research work is composed of three tow systems: binder tow, warp tow and weft tow. It is also called angle interlock layer to layer 3 D woven fabric. The warp tows are oriented along the x-direction while the weft tows along the y-direction. Binder tows, running along the warp direction, interlock the multiple weft tow layers through the thickness direction. The tow is untwisted quartz tow (Hubei Feilihua Quartz Glass Co., Ltd., China). The weaving process of the 3DWF is shown in Figure 1. The heald frames

Weaving process.
Idealized weave architectures.
Geometric and mechanical parameters of the materials.

3DWF specimens with constant cross-section can be obtained by repeating the above steps. The fabric specimens with varying cross-section can be achieved by two methods: cutting after weaving and reducing the number of tows in the cross-section during the weaving process. The first method destroys the integrity of the fabric geometry and sacrifices the mechanical properties of the 3DWC. The mechanical properties of the 3DWC prepared by the second method have a higher retention rate 9 . The load-bearing capacity of the composite specimen prepared by the tow reduction technique is determined by the load-bearing capacity at the smallest cross-section of the specimen. It is a challenge to simultaneously consider the two factors of specimen: geometry and variant structure. Therefore, it is necessary to prepare a uniform cross-sections specimen with variant structure to eliminate the influence of geometric dimension.
Theoretically, when one tow is removed, adjacent tows fill the corresponding vacancies, and the number of tows in the cross section of the specimen decreases 7 . In order to ensure that the structure of 3DWF does not change, the number of reduced tows should be a multiple of the fabric structure cycle. In order to avoid the concentrative structural defects and maintain mechanical properties of 3DWC to the most extent, the distribution of the tow reduction units should be uniform. Based on the above design rules, the variant structure is located in the middle of the tensile specimen, and the 3DWF geometry in other regions is uniform, as shown in Figure 3.

Tensile specimens with the variant structure.
As shown in Figure 4, in order to easily describe the adding and reducing tow technique in the subsequent weaving process, some variables and terms need to be firstly defined. The tows on the same heddles are defined as a column, and the same height tows on different heddle eyes are defined as a row. The [n, m] means that the tow is located in the mth row of the nth column. According to the specimen size and 3DWF structure parameters, there should be [25 × 4] tows (along the x direction) in the cross section of the specimen. Reducing tow means that the warp tow or the binder tow is removed from the heddle eyes and does not participate in the subsequent weaving process. Adding tow means that the number of tow columns will become more at the designated position in the y direction of the specimen and will participate in the subsequent weaving process.

Adding-reducing tow plan. ● represent the warp tows and binder tows.
Weaving needs to be stopped when the tow addition and reduction technique is applied. First, remove the tows in the 9th column, and move the tows in the 10th - 17th column to the left to fill the corresponding vacancies, and the corresponding column number becomes 9th - 16th. Adding a column of tows between the 16th column and the 18th column to keep the number of tows [25 × 4] along the x-direction (including warp tows and binder tows) in the specimen cross section [25 × 4] unchanged. After reducing and adding tows, rearrange the column number of the tows along the x-direction. The movement of the tows in the 8th and 9th column is the same, and the movement of the tows in the 17th and 18th columns is the same, which does not affect the weaving process, but change the local geometry of 3DWF.
In the second step, remove the tows in the 9th column and move the tows in the 10th - 17th column to the left to fill the corresponding vacancies. And add a row of tows between the 17th and 18th columns. After reducing and adding tows, rearrange the column number of the tows along the x-direction. The movement of the tows in the 8th and 9th columns is different. The movement of the tows in the 17th and 18th columns is different. The 3DWF geometry becomes the same as before adding and reducing tows. The number columns of the tow reduction and addition should be a multiple of the 3DWF geometry cycle to keep the geometry unchanged. Weaving is continued to the desired length of the specimen.
The movement of the tows in one column is the same, only the spatial topology of the surface tows needs to be analyzed. Rearrange the column number of the tows along the x-direction after each step. As shown in Figure 5(a), in the first step, after the tow [1,9] is removed, the adjacent tows [1,10] and [1,11] move to the left to fill the corresponding vacancies. In the second step, the tow [1,10] replaces the tow [1,9] to reach the position where the tow [1,9] should be in the second step. The tow [1,11] replaces tow [1,10] to reach the position where tow [1,10] should be in the second step. The tow path [1–10] is longer than normal. The tow [1,9] is removed, and the adjacent tows [1,10] and [1,11] move to the left again and fill the corresponding vacancies. In the third step, the tow [1,10] replaces the tow [1,9] to reach the position where the tow [1,9] should be in the third step. The tow [1,11] replaces the tow [1,10] to reach the position where the tow [1,10] should be in the third step. After the tow reduction is completed, the 3DWF geometry becomes normal.

Topological tow traces. (a) reduce tow, (b) add tow.
As shown in Figure 5(b), in the first step, the tow [1,16] replaces the tow [1,15] to reach the position where the tow [1,15] should be in the first step. The tow [1,17] replaces the tow [1,16] to reach the position where tow [1,16] should be in the first step. Add the tow [1,17] in the corresponding vacancies. In the second step, the tow [1,16] replaces the tow [1,15] to reach the position where the tow [1,15] should be in the second step. The tow [1,17] replaces the tow [1,16] to reach the position where the tow [1,16] should be in the second step. Add the tow [1,17] in the corresponding vacancies. The tow path [1–17] is longer than the normal. In the third step, after the tow addition is completed, the 3DWF geometry becomes normal.
From the analysis above, it can be found that the directions of the 3DWF geometry do not change before or after tow reduction and addition, therefore, no obvious structural defects are induced near the variant region. After the first tow reduction, there will be the interval column path [1–10] and after tow addition, there will be the interval column path [1–17]. After the second tow reduction and addition, the interval column path will disappear. Results indicate that structural pores tend to occur around the tow reduction and addition where the distance between two interlacing points becomes longer. The 3DWF specimen is shown in Figure 6.

3DWF specimen.
Experiment settings
The 3DWF preforms were fabricated on a 3 D woven loom developed by the Institute of Composite Materials, Tiangong University. The preforms were impregnated by TDE‐86 epoxy resin of Tianjin Jingdong Chemical Composites Co., Ltd., and cured following the Resin Transfer Molding (RTM) process. The specimens were prepared and tested according to the ASTM standard D3039 [20]. The 50 mm long aluminum tabs were bonded onto the ends of each specimen, which could prevent gripping damage. The tensile tests were carried out using a Shimadzu material testing machine with a 250 KN load cell. The speed of the crosshead is 2 mm/min. The direction of tensile load is parallel to the warp direction, and five specimens of each group were tested. With the help of the digital image correlation (DIC) system of the GOM 3 D LTD, the full-field strain information was obtained during the tensile process, and the acquisition frequency was maintained at the value of 1 Hz. To effectively record the imaging information of the specimen surface during the DIC experiment, the specimen’s surface was sprayed with gray spots, as shown in Figure 7.
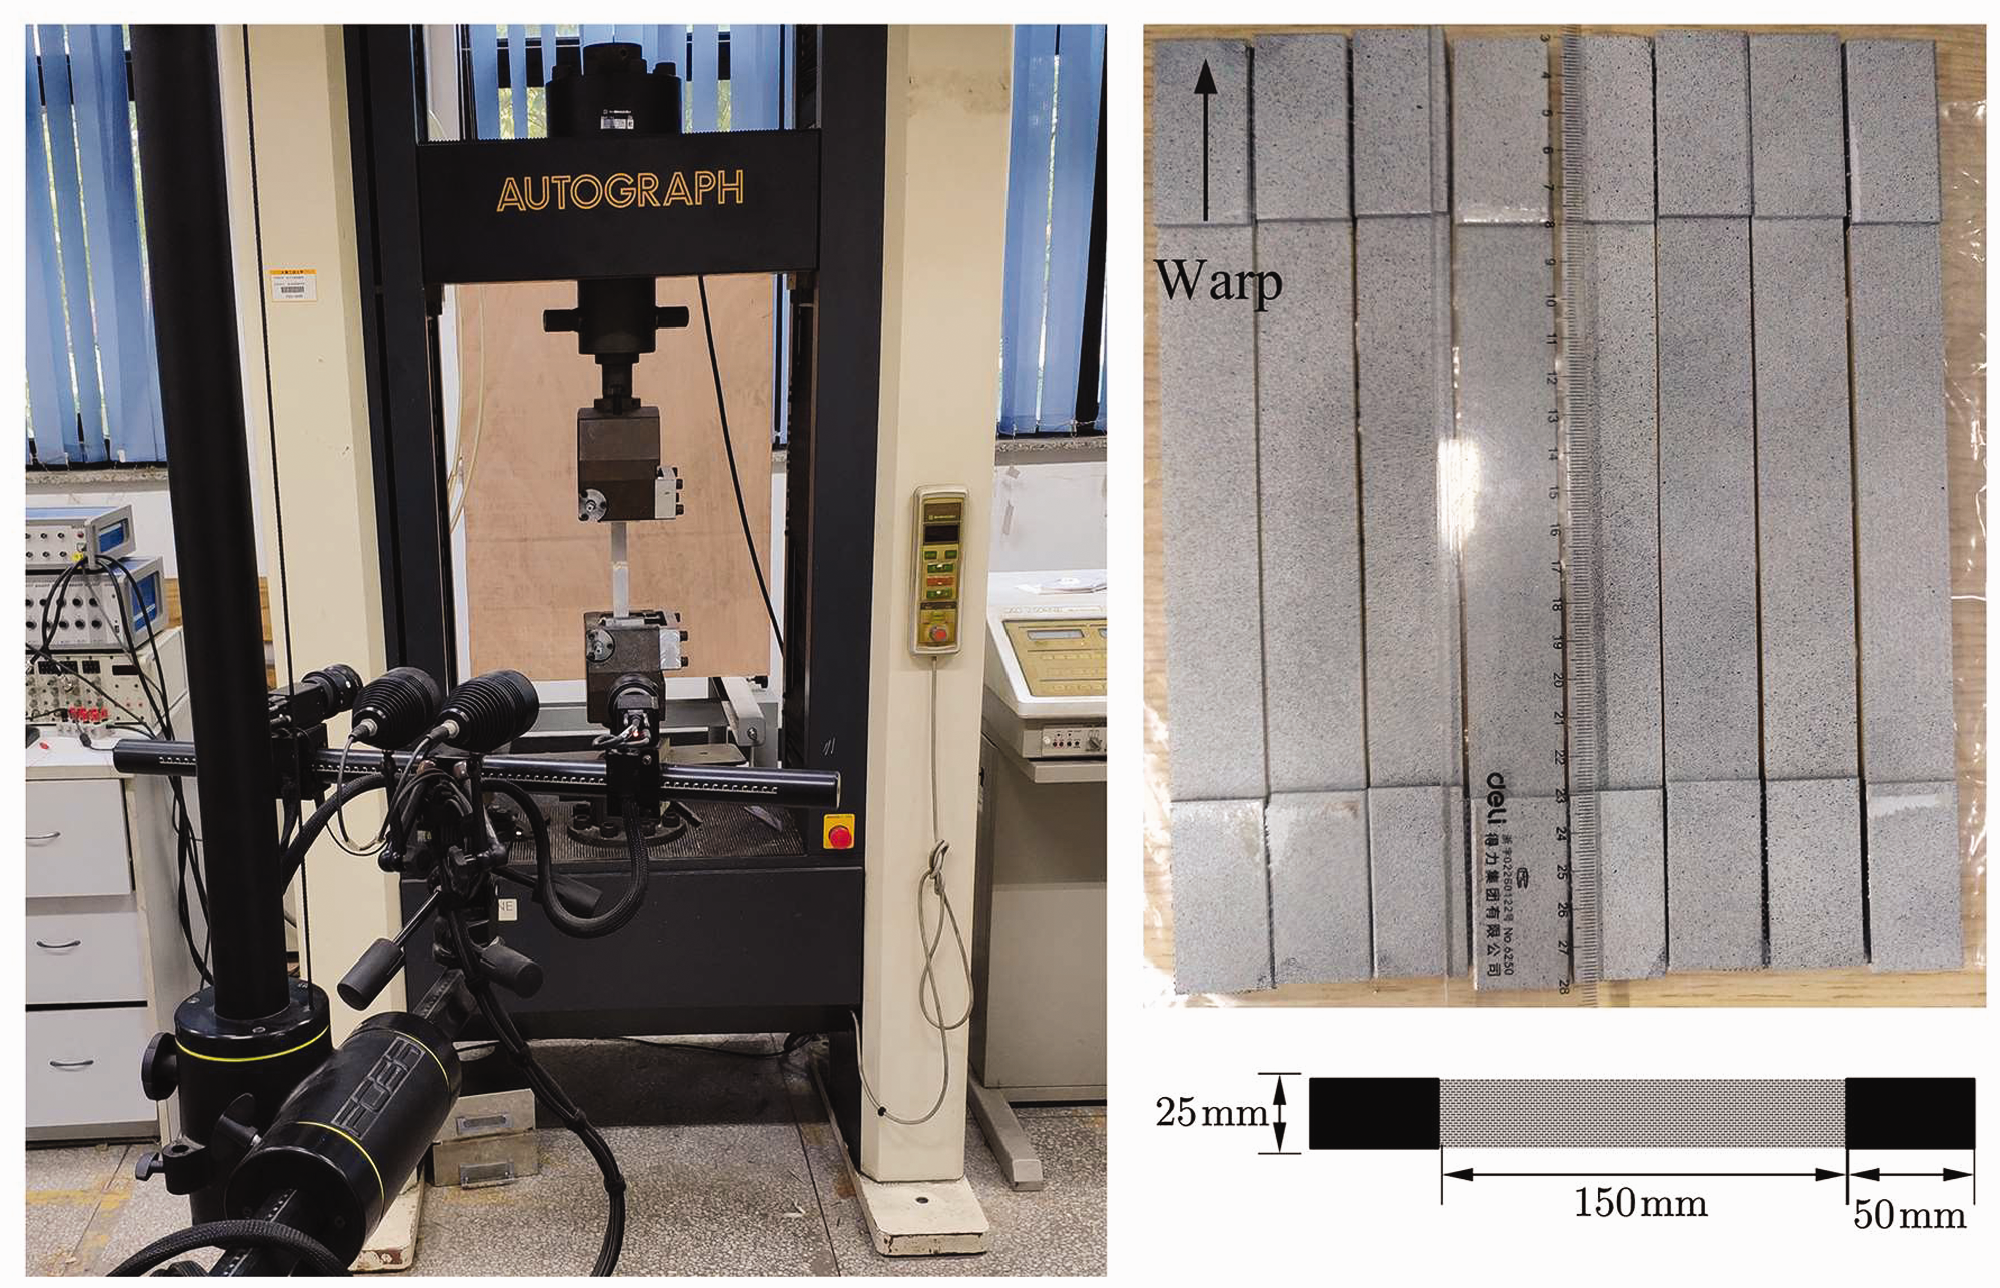
Tensile test equipment with DIC.
Multi-scale damage modelling
Model geometry
Meso-scale unit-cell model
The microscopic images of the warp and weft tows were characterized in the meso-scale, as shown in Figure 8(a) to (c). The results showed that the cross sections of the warp and binder tows were approximately rectangle, and the cross section of inner weft tows was close to hexagon. The warp and weft tows have low shrinkage, so they are assumed to be straight and not buckled. The binder tow is composed of two parts: a tilted part in the interlock region and a straight part in the rest region. Tow cross sections are considered as constant in the model. The intra-tow fiber packing factor 

Simplified RUC model of 3DWC. (a) cross sections of weft tow and binder tow paths, (b) cross sections of weft tow and warp tow paths, (c) cross sections of warp and binder tow and weft tow paths, (d) normal structure, (e) variant structure.
Dimensions of the RUC model.

The tow in the RUC was modeled as a transversely isotropic homogeneous composite, and the matrix was modeled as an isotropic epoxy resin. The Chamis rules [22] were used to calculate the performance of impregnated tow, as listed in equation (2), and subscripts 1, 2, and 3 refer to the local coordinate system of the tows. The intra-tow packing factors 
Properties of material composition [14].

Where
Macro-scale model
As shown in Figure 9, x-axis is along the warp tows, and y-axis is along the weft tows. Because the macro-model is symmetrical, only a 1/2 rectangular specimen with a size of 125 mm × 25 mm needs to be created. The macro-scale model of the variant structure includes the variant region and the normal region, while the macro-scale model of the normal structure only has the normal region. The macro-scale model block was partitioned, and each region was discretized into several C3D8 (eight nodes) brick elements. The equivalent properties of the RUC of the variant structure are assigned to the variant region, and the equivalent properties of the RUC of the normal structure are assigned to the other region. No periodical boundary condition was required in the macro-scale model since it simulates the whole specimen. Longitudinal displacement was applied to one surface in the y-z plane until final failure, and a symmetric boundary conditions were applied to the opposite surface. The damage process was modelled using the same stiffness degradation strategy as the RUC model, and the maximum stress damage criterion was used to define damage due to its simplicity and adequate accuracy. Both the elastic and strength models were built to simulate the tensile behavior of both normal and variant structure specimens, and the results are discussed in the following sections.

Macro-scale model of 3 D woven composite. (a) normal structure, (b) variant structure.
Failure criteria
Under the tensile load, the 3DWC will show different modes of damage. As the load increases, the damage propagate until the failure occurs. In order to simulate the damage process of 3DWC, it is necessary to establish an appropriate progressive damage model (PDM), including damage criteria, material property degradation and stress analysis. The failure analysis requires proper damage initiation criteria to reveal the main failure mechanism. Stress analysis is related to an appropriate constitutive law for both undamaged and damaged materials. Then, a damage evolution model is needed to describe the property degradation after material damage initiation [14]
Damage initiation criteria
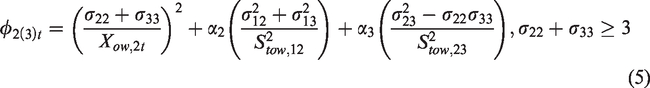
There are three typical damage mechanisms in the 3DWC, namely the transverse matrix cracking, the fiber-matrix shear debonding, and the longitudinal fiber breakage [24]. The 3 D stress failure criterion of Hashin [25] are capable to demonstrate all these failure modes in analysis. The tow in the RUC was modeled as a transversely isotropic homogeneous composites, and the matrix was modeled as an isotropic epoxy resin. Tow tensile failure in the 1 direction. Tow compression failure in the 1 direction. Tow tensile and shear failure in the 2 and 3 directions. Compression and shear failure of tow in the 2 and 3 directions.
where 


The pure matrix damage initial criterion uses von Mises theory [26]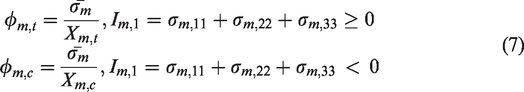
For macro-scale homogenization model, the maximum stress failure criterion is employed, as shown equation (8).
Damage evolution law
When the 3DWCs are subjected to uniaxial tension, the materials (tow or matrix) experience initial damage to the failure with the increase of the external load. The reduction of the stiffness coefficients is controlled by the damage state variables in the damage process. The damage state variable 

fracture energies for meso and macro-scale model.

The damage is irreversible [32] with the following damage evolution law:
Damage model
Continuum damage models were adopted in analyzing the elastic-brittle behavior of fiber-reinforced composites. Usually, damage state variables in scalar or tensor form were introduced to reduce the values of stiffness coefficients as originally proposed by Krajcinovic [33]. Here the constitutive model for anisotropic damage developed by Matzenmiller [34] was used to compute the degradation of coefficients of the stiffness matrix. In the model, the effective stress 
It is assumed that the principal axis of the damage state variable is coincident with the principal axis of the material. Where I is a second-order unit tensor. 

According to the energy equivalence hypothesis is established by Sidoroff [37] in the damaged state and undamaged state, the damage state variable is introduced into the stiffness tensor.

Combination with equation (14), the 
Where
In order to improve the numerical convergence in damage process, the viscous regularization scheme developed by Duvaut [38] is introduced into the constitutive model. The regularized damage variables are related to the un-regularized damage variables by equation (18).
The above PDM is carried out in material constitutive equation by user subroutine UMAT of ABAQUS [39]. Finally, the tangent stiffness which is needed in each analysis increment can be derived as:
Results and discussion
Prediction of representative unit cell effective properties of and damage analysis
The predicted properties of both RUC damage models based on the properties of the resin and the impregnated tow are summarized in Table 5. The equivalent mechanical properties of the RUC are calculated by the homogenization method, which is described in detail in the literature [40]. It can be seen that the RUC are predicted to be orthogonal anisotropic. There is no significant difference in the predicted stiffness and weft strength of both RUCs, but the warp strength of the variant RUC is slightly lower than that of the normal RUC. The reason is when the adding and reducing tow technique is used, the number of effective load-bearing tows per unit in the warp direction of the variant RUC is reduced, while the number of effective load-bearing tows per unit in the weft direction of the variant RUC remains unchanged.
Equivalent properties of meso-scale RUC.

Figure 10 shows the stress–strain curves from both damage models of normal and variant in warp direction. As the external load continues to increase, both RUC damage models deviated from the linear-elastic behavior from about strain 1.0% due to the onset of damage. However, the variant structure RUC exhibits the pseudoplastic behavior before failure due to the variant tow damage. In the two damage models, the binder tow and the weft tow are damaged earlier than the warp tow. It shows that the initial local damages of the binder tow in the longitudinal and transverse directions and that of the weft tow in the transverse direction has slight effect on the composite stiffness. However, once the warp tow longitudinal damage occurs, the composites stiffness rapidly degrades, indicating that the RUC has collapsed structural damage [41]. Because of the variant tow in the variant RUC, the tow damage occurs earlier and propagate faster, resulting in reduced tensile strength.

Stress–strain curves of meso-scale RUC under warp direction loading.
Once the damage onset, the damage evolution is controlled by the dissipation of fracture energy during the damage process. This means that the damage state variable is an irreversible evolution, from 0 to 1, after the damage occurred, and the composites stiffness gradually degenerates until failure. More details of the damage process are given in Figure 11, in which the x-axis is the loading direction (warp tow direction as well). SDV1, SDV2 and SDV3 are the tow longitudinal damage, the tow transverse damage, and the matrix damage, respectively. If damage does not occur, the damage state variable is equal to 0. Else the damage state variable is equal to 1, which means that the element is failure. It can be seen that the longitudinal and transverse damage of the binder tow occurred at the weaving point, and then the resin between the adjacent tows is damaged. As the external load continues to increase, the warp tows are damaged. It can be seen from the stress-strain curve that RUC still has good load-bearing capacity before warp tow damage. As the strain increased, the damage quickly propagated in the y direction (perpendicular to the loading direction). Meanwhile, the damage continues to propagate to connect the adjacent area, which lead to the failure of the composite material. Due to the introduction of tows in the variant structure RUC, a resin rich region will be formed, and one end of the tow will lack weaving constraint, which is prone to debonding and pulling [42]

Damage propagation process of RUC. (a) normal structure, (b) variant structure.
Prediction of macro-scale model strength and damage analysis
The macroscopic stress–strain curves of two 3DWC models under uniaxial tension in the warp direction are comparison with the experimental result in Figure 12. The stress-strain curves show linear characteristic. The difference in stiffness between the two types of specimens is not significant, referred by the initial slope (the range of strain from 0.05% to 0.25%) of the stress-strain curve, and no damage comes up at this time. As the load continues, the decrease of the bearing capacity of the specimen are caused by the continuous damage. The slope of the curve has a downward trend at the averaged strain level of approximately 1.5%, which result in a 9.8% and 8.6% decrease in modulus of normal structure and variant structure, respectively. Finally, the curve suddenly drops, which is determined by the brittleness of the composite material. Moreover, it could be noted that the simulation curves were consistent with the experimental in the whole process, verifying the rationality and validity of the numerical models. The tensile modulus and strength of the two structural specimens are shown in the Table 6. The maximum variation of modulus and strength between the simulation and experiment were 3.9% and 2.8%, respectively, proving the validity of the model. It could be noticed that the variant structure mainly affects the load-bearing capacity of the composite material, but it has a slight effect on the modulus. The reason is that the number of effective load-bearing tows per unit of the variant structure is less than that of the normal structure.

Stress–strain curves of macro-scale specimen under warp direction loading. (a) normal structure, (b) variant structure.
Tensile properties obtained from macro-scale model and experiments.

The percentages for simulation prediction indicate the absolute deviation compared with the mean experiment value.
The damage contour plots of two macro-scale models are shown in Figure 13. The damage of the normal structure model is uniformly distributed, while the damage of the variant structure model firstly occurs in the variant region, and then gradually propagates to the surrounding region. The propagation direction is perpendicular to the loading direction, and finally the damage occupies throughout weft direction of the specimen. Comparatively, damage of the variant structure specimen occurred earlier than the normal structure specimen, leading to reduced strength. The results show that the introduction of the variant structure tends to cause stress concentration and earlier damage in the variant region, which reduces the effective bearing capacity of the specimen.

Damage propagation process of macro-scale models. (a) normal structure, (b) variant structure.
The longitudinal strain distribution from the macro-scale model and the experimental DIC results at similar load levels are shown in Figure 14. The strain distribution maps of DIC were obtained at the averaged strain level of approximately 1.0%, 2.0%, and at the last frame before fracture. The meso-strain distribution in 3DWC is periodic due to the periodic geometry and the macro-strain is homogeneity. The low strain is detected over the location of the weaving point and the localized high strain region is observed near the weaving point within the resin rich region [43]. As can be seen, the strain distribution of the normal structure specimen is uniform. However, for variant structure specimen, the higher strain regions centered on variation region which have lower stiffness than the surrounding normal region [13], and the strain concentration zones located at the variant region could also be found in the macro-scale model. One possible explanation is that resin rich channels are formed in the variant region due to the tow reduction. Besides, many stripes can be observed in longitudinal strain of DIC image with the increasing strain. After the fabric was molded, some local resin rich regions may emerge in the gaps of two adjacent weft tows, where the stripes were mainly concentrated. The predicted strain distribution also showed similar trend to the DIC results. Compared with DIC image at different strain levels, the strain stripes caused by the non-uniformity of the material, cannot be reflected in the macro-scale model due to the idealized model geometry. From the above analysis, it can be seen that the strength prediction and damage propagation analysis using the macro-scale homogenization model are in good agreement with the experimental results.

Comparison of strain contours obtained by DIC and simulations. (a) normal structure, (b) variant structure.
Conclusions
The main objective of this study was to investigate the effect of variant structure on the behavior of the 3DWC. The 3DWC specimens with variant structure were prepared by adding and reducing tow technique and subjected to tensile test, and the full field strain distribution of specimens were obtained by DIC. Based on continuous damage mechanics, a meso-scale unit cell model and a macro-scale model were developed to simulate the elastic and damage behavior of 3DWC specimens with normal and variant structures under tensile loading. Hashin failure and maximum strength criteria were applied to the RUC model and homogenization models, respectively. Based on the experimental and simulation results the contributions of this study are summarized: The variant structure is introduced into 3DWC by adding-reducing tow technique, which eliminates the influence of cross-section changes of the specimen on the test results. The variant structure has slight effect on the RUC stiffness and strength in weft direction, but it will reduce the strength in warp direction. Both the matrix and tow damage for the variant structure model initiate earlier than the normal structure, which causes higher strain concentration in the variant structure region. The simulated stress–strain curves were in good agreement with the experimental ones. The maximum variation of tensile modulus and strength between the experimental and simulation results was 3.9%. The tensile behavior of variant structure specimen was simulated by macro-scale model and a similar strain distribution was observed to the DIC experimental results. The meso-scale model proposed in this work can be applied in improving the adding-reducing tow technique to reduce fiber damage, and the macro-scale model is beneficial to reveal the damage behavior of larger 3DWC component with variant structure.
Footnotes
Declaration of conflicting interests
The author(s) declared no potential conflicts of interest with respect to the research, authorship, and/or publication of this article.
Funding
The author(s) disclosed receipt of the following financial support for the research, authorship, and/or publication of this article: The authors thank the support of the China Aviation Science Foundation.