
Abstract
In this article, thermal resistance test and water vapor resistance test were experimented to obtain data of heat and humidity performance. Canonical correlation analysis was used on determining influence of basic fabric parameters on heat and humidity performance. Thermal resistance model and water vapor resistance model were established with a three-layered feedforward-type neural network. For the generalization of the network and the difficulty of determining the optimal network structure, trainbr was chosen as training algorithm to find the relationship between input factors and output data. After training and verification, the number of hidden layer neurons in the thermal resistance model was 12, and the error reached 10−3. In the water vapor resistance model, the number of hidden layer neurons was 10, and the error reached 10−3.
Introduction
Knitted fabrics were used in clothing fields such as underclothing, sports-clothing early. With knitting technology developed, knitting fabrics were gradually used in coat. To keep the style of the garment, knitted double jersey was widely used in clothing. Based on the wide application of knitted double jersey, performance was studied to produce better product. Park and Hwang 1 studied mechanical properties of double weft-knitted fabrics and to sum up the style evaluation method. Besides, many scholars explored wearing comfort of knitted fabric. Fukazawa et al. 2 summarized the effect of air and vapor permeability of material on heat and mass transfer in clothing systems. Jeong and Hong 3 found out an evaluation scale that could predict wear comfort and to investigate the effect of the skin-contacting fiber type on the subjective sensation and microclimate. Tyagi and Sharma 4 evaluated the thermal comfort characteristics made from polyester-cotton MVS yarns. Wilbik-Halgas et al. 5 evaluated the surface porosity of knitted fabrics by establishing the size of clearances created as an effect of flight channels in the plain double-layered and lining knitted fabrics on the basis of a computer image analysis. Huang and Qian 6 provided a new technique to accurately and precisely characterize the water vapor transport properties of fabrics. Huang found out a new apparatus. This test method offered short test time, good repeatability, high sensitivity, and less cost. It is very useful for routinely testing the water vapor permeability of fabrics for quality control of the textile plants. 7 Xu et al. 8 revealed that double-jersey fabrics using different fiber fineness on the two sides has good one-way moisture transport ability, and the greater the difference of fiber fineness between the two sides, the more significant the transport speed and ability. Wu and Chen 9 developed the heat and humidity permeability testing device of textiles successfully by sensing technology, computer measurement technology, and simulating human skin perspiring and microclimate between sweating skin and tested fabric through disk part with inner heat and humidity source. Nofitoska investigated the effect of small variations in woven fabric structure and finishing on fabric water vapor permeability and air permeability properties. It was found that small changes in fabric structure affect water vapor permeability and air permeability properties, while the effects vary depending on the type and scale of variation. 10 Prakash analyzed the thermal properties of 100% cotton, 50/50 cotton/bamboo, and 100% bamboo single-jersey fabrics with differing yarn linear density. It was found that air permeability and water vapor permeability also increase with increase in bamboo fiber content, while both thermal conductivity and thermal resistance show a decreasing trend. 11 Boguslawska-Baczek and Hes presented the fast instrument—Permetest—which provides reliable measurement of the water vapor permeability of fabrics in a dry and wet state. The main contribution of the measurement was the determination of the exact ratio between the level of heat flux density of the heat flow penetrating the wet fabric, having a cooling effect, and that of the heat flux density of the heat flow caused by moisture evaporation from the fabric surface, also having a cooling effect. 12 Raja studied the thermal properties of single-jersey knitted fabrics manufactured using ring, compact, and ring/compact folded yarns. They observed that yarn twist and traveler weight had affected different thermal properties of single-jersey folded yarn fabrics. 13 Rajwin and Prakash studied the influence of plasma treatment on the thermal comfort properties of cotton woven fabric. They found that the air permeability of the fabric had a linear relationship with the distance of the sample and better air permeability achieved in air plasma. 14 Kostajnsek and Dimitrovski 15 established the influence of multilayer cotton fabric constructions on the properties connected with porosity, that is, thermal resistance, water vapor resistance, UV-light permeability, and air permeability.
Now scholars usually use the thermal resistance value, the thermal retention rate, the CLO value, and the heat transfer coefficient to characterize the thermal properties. Thermal resistance refers to the ratio of the temperature difference between the two ends of the object to the power of the heat source when heat is transmitted over the object. It is an important indicator to measure the thermal comfort. The greater the thermal resistance, the better the thermal insulation performance.16,17 The thermal resistance index can provide the effective guidance for fabric production. The fabrics in different thermal resistance level can be used in different seasons accordingly. The heat retention rate is the percentage of the difference between the amount of heat dissipated when there is no sample and the amount of heat dissipated when there is a sample, and the amount of heat dissipated when there is no sample. The CLO value is defined as follows: in an environment where the room temperature is 20°C or 21°C, the relative humidity does not exceed 50%, and the air flow rate does not exceed 10 cm/s (equivalent to the normal air flow rate of the ventilation equipment), the thermal insulation value of the clothing is 1CLO when a person sits or engages in mild mental work keeping comfortable. The heat transfer coefficient refers to the heat of the air on both sides of the enclosure under the condition of stable heat transfer, which is 1 degree (K, °C), and the heat transferred by 1 m2 in 1 h. The unit is watt/square meter degree (W/m2 K, where K can be replaced by °C).
At present, it is convenient to use artificial neural network (ANN) to study comfort performance of fabrics. Experts can estimate the performance of the fabric to some extent by the relationship between the performance index and the basic parameters of the fabric. This method can have a clear performance analysis of the product before development and production. Now many scholars are using ANN as a means to study the relationship between fabric properties. Selsabil predicted compression and surface properties of knits using fuzzy logic and researched the model and the relationship between manufacturing parameters, especially finishing treatments and instrumental tactile properties measured by the Kawabata Evaluation System. 18 Alsaid et al. 19 studied that the tensile properties of cotton/spandex core-spun yarns are predicted using ANN and regression models. They researched the relationship between the independent variables and the dependent variables. Evrim Kanat and Özdil 20 found that ANN could be used for predicting thermal resistance of wetted fabrics successfully. They set two models to predict. The first model could be recommended to estimate the thermal resistance of the fabrics. The second model could be recommended to estimate the changing thermal resistance of the fabrics. We can look for the relationship between basic fabric parameters and heat and moisture properties by ANN, estimating the hot and humid index by pre-setting basic fabric parameters before production.
The heat and moisture transfer of fabrics is a complex process. Thermal and wet comfort performance is aroused by the interactions among air, water, fiber, and its own composition. It is difficult to describe with certain mathematical expressions. At present, there are a variety of mathematical methods to judge the performance of fabrics such as gray theory 21 and Euclid approach degree. 22 Regression analysis, error analysis, and other methods are often used for the investigation of factors affecting the performance. The stepwise regression analysis method determines the importance of the influencing factors by the degree of significance. 23 To explore the degree of influence of various fabric parameters on various performance indicators, typical correlation analysis methods can be used for exploration.
In the present article, a mathematical relationship between the basic parameters of knitted double jersey and the thermal and wet comfort performance is analyzed. The significant factors affecting the performance of the fabrics are determined to predict the heat and humidity comfort. With the help of mathematical methods, a predictive model of thermal and wet comfort performance can be established by using the basic parameters of the fabrics. According to the input data and the target data, an ANN model can be established. It includes three parts: training, testing, and verification.
Experimental
Basic specification parameters of fabric sample
Through the market research, knitted double jerseys are commonly applied for garment production upon different thermal and wet comfort properties. Knitted double jerseys are double-sided structure. In this study, 26 knitted double-jersey samples were selected, twenty-three fabrics for the training section and three fabrics for the test section. The weight of these fabrics was mainly distributed from 140 to 400 g/m2. The raw fiber mainly involves three types of blending: polyester, nylon, and wool; polyester and wool; and polyester and cotton because they are the most commonly used raw materials for knitted double jersey. Among them, wool ingredients are usually used for knitted double jersey in the medium to high level. Specific fabric parameters are shown in Table 1.
Fabric specification parameters.

The fabric samples are initially divided into four categories according to the raw materials, weight, and thickness of the fabric samples. They facilitate the subsequent analysis and comparison of the heat and moisture properties. The first group of fabrics is wool fabrics 1#, 3#, 5#, 7#, and 26#. They have the weight below 200 g/m2 and the thickness of 0.600 mm or less. The second group of wool fabrics is 2#, 4#, 8#, and 9#, which having the thickness between 0.600 and 0.800 mm. The third group of fabrics is raw material completely such as 11#, 12#, 14#, 23#, and 25#, with relatively large surface density and thickness. The fourth group of fabrics contains cotton fiber raw materials such as cotton, viscose: 6#, 10#, 13#, 15#, 16#, and 24#. The fifth group of fabrics consists of wool/cotton/polyester: 17#–22#.
Thermal resistance and water vapor resistance test
According to the GB/T 11048-2008 “Textile production Physiological comfort Determination of thermal resistance and water vapor resistance under the steady state conditions,” the YG606G Sweating Guarded Hotplate is used for testing as shown in Figure 1. The size of the test sample is 50 cm × 50 cm. First, the machine was preheated for 45 min, and then, the empty plate experiment was performed. When the status showed “stable,” the sample test can be performed.

The YG606G Sweating Guarded Hotplate.
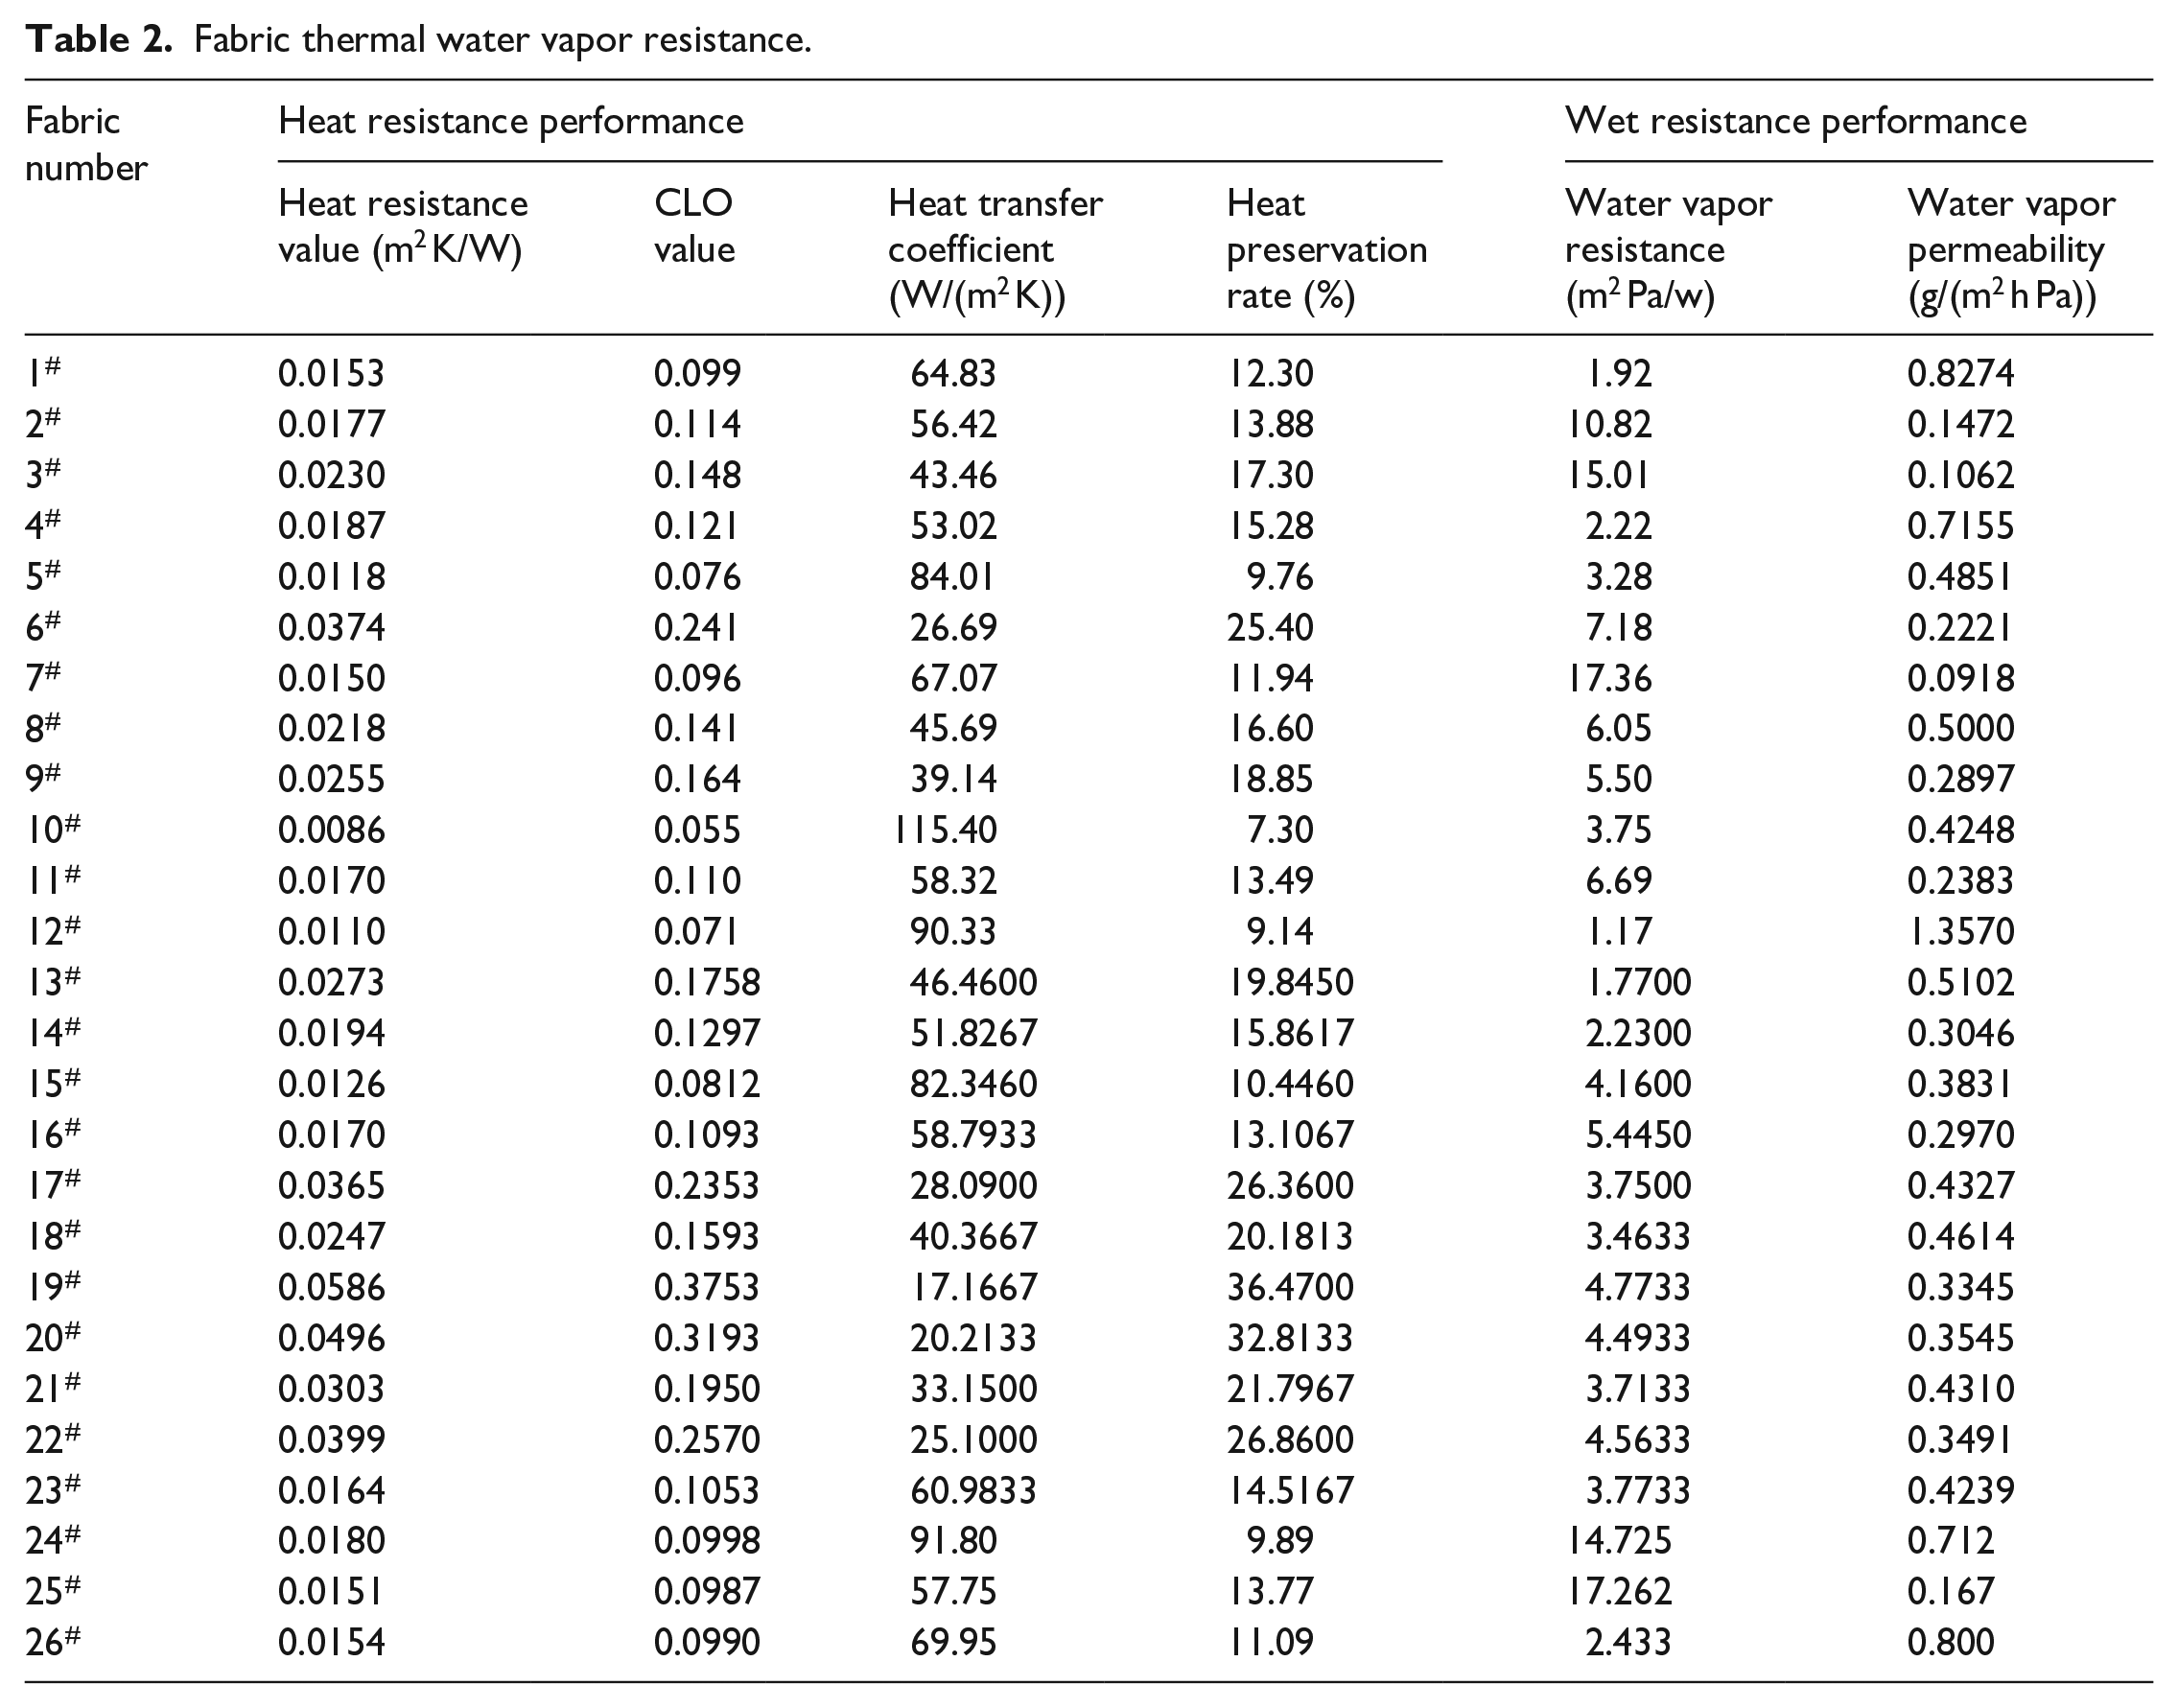
With the same standard equipment and instruments, the fabric was tested for water vapor resistance. Before test, distilled water was added to the sink. Followed by “water” operation, the heating plate was exactly in contact with the water surface, distilled water can infiltrate the multiwell plate, and the membrane was covered on it. The water vapor was emitted toward the fabric sample. The lower surface of the membrane is 35°C. The upper surface of the sample is a stable environment. Temperature is 35°C, and relative humidity is 40%. Figure 2 shows the principle of water vapor resistance test. Obtained from the test are thermal resistance value, CLO value, heat transfer coefficient, heat preservation rate, water vapor resistance, and water vapor permeability, as shown in Table 2. The data of the fabric test can be used as the target data for building the model.

Water vapor resistance test schematic.
Fabric thermal water vapor resistance.
ANN model
Data standardization
The proportion of raw materials was represented by the moisture regain rate of the raw materials because the proportion of raw materials has a great influence on the degree of moisture absorption and more directly affects the water vapor permeation process. Before the model was established, the proportion of the raw materials in the fabric sample was converted. The moisture regain was calculated by formula (1)

where P1 is the ratio of the first raw fiber material, W1 is the moisture regain of the first raw fiber material, P2 is the ratio of the second raw fiber material, W2 is the moisture regain of the second raw fiber material, Pn is the proportion of the nth raw fiber material, and W n is the moisture regain rate of the nth raw fiber materials.
The input data were normalized to map it between 0 and 1, reducing the complexity in the model. The data were processed using equation (2)

where x′ is the normalized data, x is the original data, xmax is the data maximum, and xmin is the data minimum.
Establishment of thermal resistance model
Training process is shown in Figure 3. First, the data are set as input vector and target vector. They are normalized. Then, the number of hidden layer neurons is determined and a training model is established. When the training error reaches requirement, training process will be stopped.

Training process to the model.
These standard processed data are used as input data. And the neural network toolbox is used to establish a three-layer neural network model. Twenty-three fabric samples are used as training samples. The number of input points of the model must be considered about various factors. Because there are seven input parameters, the number of nodes in the input layer of the ANN is 7. They are first and second yarn linear densities, raw material moisture regain, lateral density, vertical density, areal density, and thickness. Four nodes are kept in the output layer of the ANN to predict thermal conductivity of fabrics. They are heat resistance value, CLO value, heat transfer coefficient, and heat preservation rate. As studied by Abhijit, 24 only one hidden layer was used in this investigation. It is capable of handling nonlinear relationship between inputs and outputs. The number of hidden layers and the number of nodes in each hidden layer are important parameters. There is one hidden layer in the ANN model. In the hidden layer, the number of neurons is basically between 6 and 24. It is determined by the number of input factors. The model output error after training is used to judge whether the thermal resistance model is accurate. Figure 4 gives three-layered ANN schematic for thermal resistance model.

Thermal resistance model schematic.
Bayesian regularization backpropagation is the modification of Levenberg–Marquardt algorithm. Trainbr is selected as the training function. It reduces the difficulty of determining the optimal network structure. Besides, it improves the generalization ability to the model. The Learngdm is chosen as the learning function. The transfer function of hidden layer neurons and output layer neurons is the Tansig. There are 12 neurons in the hidden layer. It is giving the best prediction performance. If the error does not meet the requirements, the network will readjust the weight until the error is within the requirement.
Establishment of water vapor resistance model
In the water vapor resistance model, there are seven input nodes and two output nodes to predict the value of the water vapor resistance and humidity permeability. The original data of samples are standardized first. Then, the data are imported into MATLAB to establish the water vapor resistance model by using the neural network toolbox. Figure 5 gives three-layered ANN schematic for the water vapor model. The structure of neural network model consists of three layers as an input layer, hidden layer, and output layer. There are 10 neurons in the hidden layer. When the number of neurons is 10, the output data are closest to the target data. The moisture model is trained by trainbr. Learning parameter is Learngdm, and the transfer function of hidden layer neurons and output layer neurons is the Tansig. The excitation function Tansig can reduce the error of the model output. The training samples are set with the minimum target error as 10−4. After training, the output errors of the training samples are between 10−3 and 10−4.
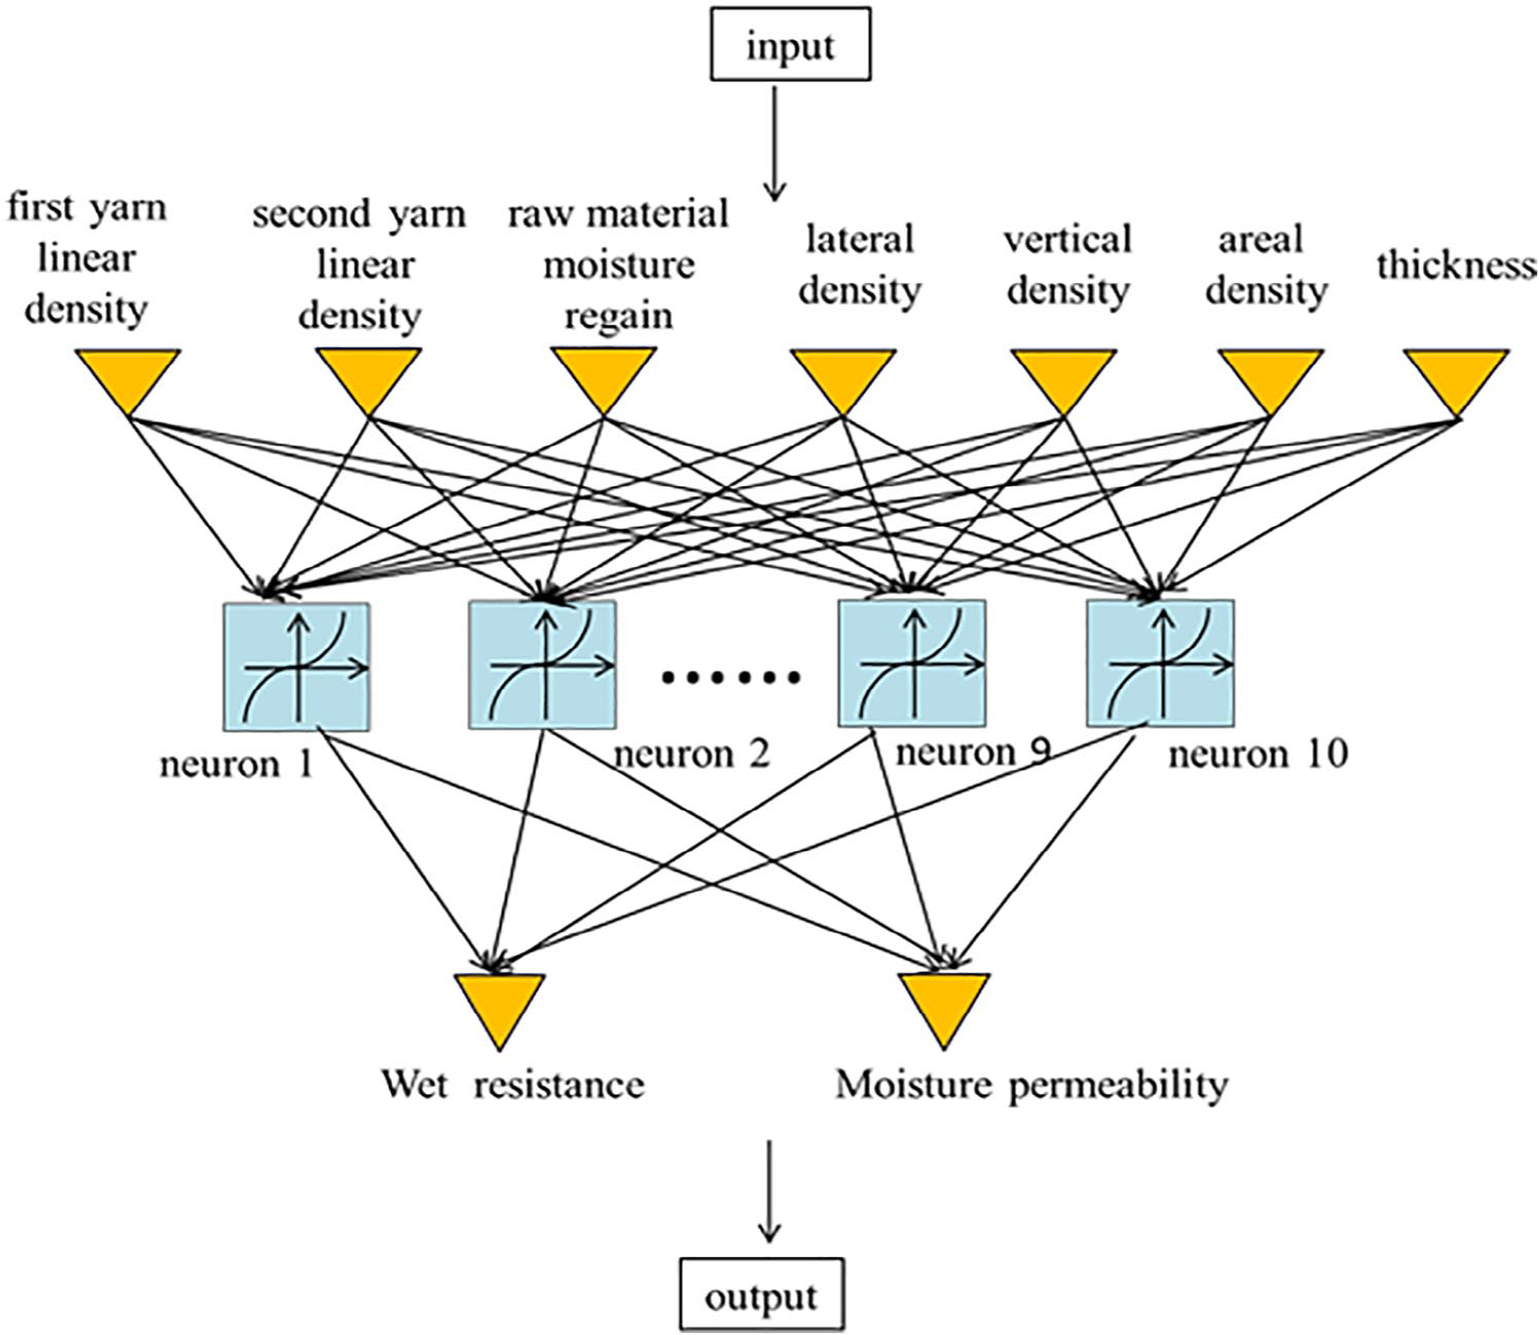
Water vapor resistance model schematic.
The trainbr function can satisfy the relatively complex correspondence in the samples. Because the output and test data are rational number, the excitation function mainly is considered. The excitation function is chosen as Tansig. It can map any value to meet the requirements of the output. After the model is trained to obtain the sample output results, the output error range is between 10−3 and 10−4.
Results and discussions
Canonical correlation analysis of thermal resistance
Canonical correlation analysis is a multivariate statistical analysis method. It uses the correlation between pairs of integrated variables to reflect the overall correlation between the two sets of indicators. Its basic principle is that two integrated variables U1 and V1 are extracted from the two sets of variables, respectively (linear combination of each variable in the two variable groups, respectively). They are used to reflect the overall correlation between the two sets of indicators.
The basic parameters of the fabric, that is, linear density of the first yarn (x1), the second yarn linear density (x2), the moisture regain (x3), the transverse density (x4), the vertical density (x5), the fabric weight (x6), and the thickness (x7), were set to x1–x7 as independent variables. Four performance indexes were set to y1–y4 as the dependent variables. SAS software was used to perform typical correlation analysis on the data. After running, the correlation coefficients of the two groups of variables are shown in Figure 6(a) to (d). Correlation analysis showed the correlation coefficient between fabric basic parameters and thermal resistance, CLO value, heat transfer coefficient, and heat preservation rate. It was obtained to determine the rationality of the input factors of the thermal resistance model.

Correlation between different thermal performance indexes and basic fabric parameters: (a) thermal resistance, (b) CLO value, (c) heat transfer coefficient, and (d) heat insulation rate.
Canonical correlation analysis of water vapor resistance
SAS software is also used to analyze the typical correlation of the water vapor resistance index. The seven basic parameters of the fabric, that is, the first yarn linear density (x1), the second yarn linear density (x2), moisture regain of raw fiber (x3), transverse density (x4), vertical density (x5), fiber weight (x6), and thickness (x7), are set to x1–x7, and the water vapor resistance and moisture permeability are variables y1 and y2, respectively. The correlation coefficients between the two groups of variables are obtained through the SAS software analysis. The influence of each factor on the water vapor resistance and the moisture permeability is reflected by the magnitude of the correlation coefficient, as shown in Figure 7.

Correlation between different wet performance indicators and basic fabric parameters.
In Figure 7, for the variable y1, the absolute values to the correlation coefficient of variables x3, x4, and x7 are larger. It explains that the fiber moisture regain, transverse density, and thickness have important influence. In addition, their values are negative number. So, there is a negative correlation between the three parameters and the water vapor resistance. The three parameters mainly reflect the tightness of the fabric structure. The tighter the fabric structure, the smaller the fabric porosity, and less moisture-permeable effect.
For variable y2, which is moisture permeability, the influence of the x7 is more significant. It is revealed that thickness of fabric played an important role in moisture permeability. As a result, the influence of x2 and x3 (the second yarn linear density and raw material specifications) on the moisture permeability is relatively obvious.
Through the typical analysis of the water vapor resistance and the moisture permeability, it is found that the moisture permeability of the fabric is mainly affected by the tightness of the fabric structure. This is because the tighter fabric structure provides smaller voids so that moisture is not easily discharged. The moisture regain rate of raw fiber is generally more significant in high-humidity environments, and the influence on the moisture permeability of fabrics ambient room conditions is relatively small. The absolute values of the basic parameters of fabric and moisture resistance and moisture permeability are all around 0.4. It shows that they are related. It is feasible to use basic parameters as input factors in the water vapor resistance model.
Verification of thermal resistance and water vapor resistance models
We got thermal resistance model and vapor resistance model by training data. Three knitted double jerseys are selected additionally for testing the thermal resistance and water vapor resistance models. Four index values and errors of the model output are obtained. The accuracy of the model is analyzed according to the output error. Predicted and measured values are shown in Table 3. The error of testing data is shown in Figure 8. Because the mean square error (MSE) precision of different fabrics is different and difficult to express, the ratio of the difference between the predicted data and the measured data to the actual test data indicates the predicted error, as shown in Figure 8. In the process of testing, predicting data are basically within 2% of the error with the actual data.
Predicted and measured values of test samples.

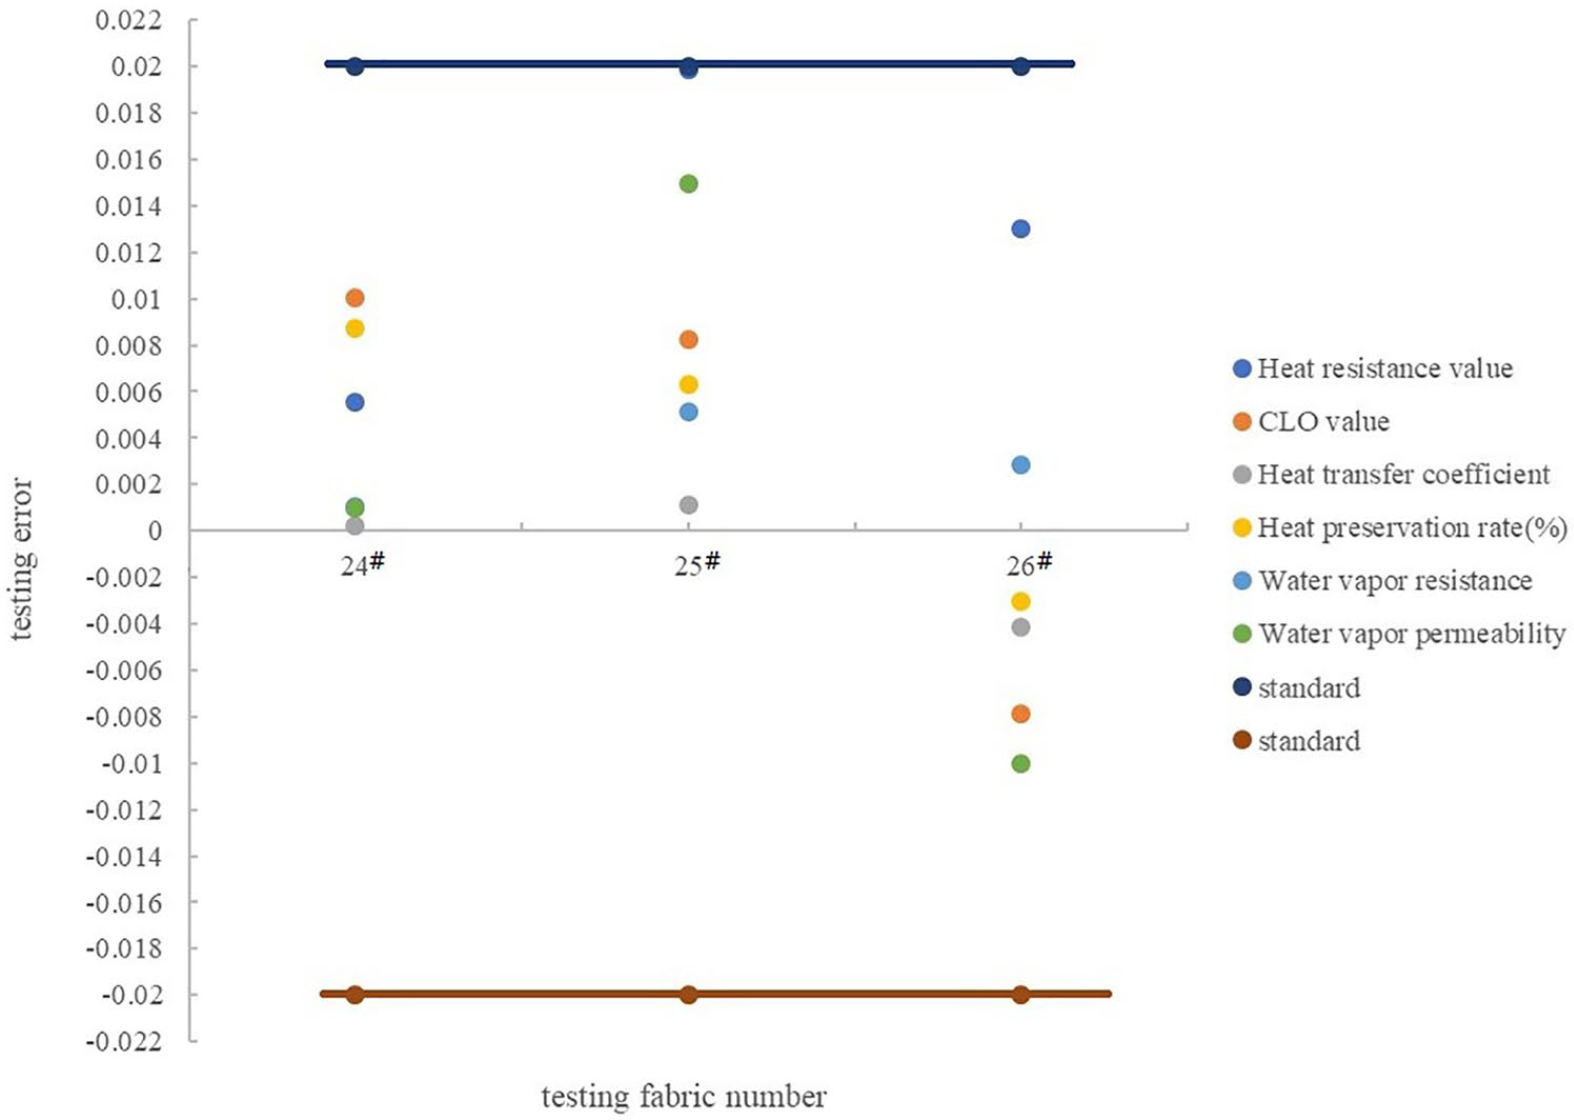
Testing error.
Conclusion
Through canonical correlation analysis, the input factors were determined. Basic parameters of fabric were input factors, and the performance indices were output factors. The thermal-wet model had three layers. Trainbr was chosen as the training algorithm of models. It can modify the Levenberg–Marquardt algorithm to make the generalization of the network better. At the same time, the difficulty of determining the optimal network structure is reduced. In the thermal index part of the thermal-wet model, when the number of hidden layer neurons was 12, the error of the model reached the set requirement. In the wet index part of the thermal-wet model, when the number of hidden layer neurons was 10, the error of the model could reach the order of 10−3. In the process of testing, predicting data is basically within 2% of the error with the actual data.
Footnotes
Declaration of conflicting interests
The author(s) declared no potential conflicts of interest with respect to the research, authorship, and/or publication of this article.
Funding
The authors disclosed receipt of the following financial support for the research, authorship, and/or publication of this article: National Natural Science Foundation of China (No. 61772238), Knitting Technology Service Platform of Wuxi city (WX03-07D0304-021700-06) and National Science Foundation of China (No. 61902150).