
Abstract
The aim of this article was to provide an effective measurement method of the warp dynamic load capacity based on a warp fatigue life tester for sized yarns. Five parameters which affected the fatigue life of warp, respectively, namely, load frequency, warp speed, pre-tension weight, heald frame stroke, and static tension of the warp fatigue life tester, were studied. First, the influences of the five parameters on warp fatigue life were analyzed through single-factor experiments, and then, the Box–Behnken design based on the response surface methodology was adopted to optimize warp fatigue life tester parameters. The results showed that the optimum parameter conditions of the warp fatigue life tester for warp fatigue life were as follows: when heald frame stroke at 77.16 mm, load frequency of 205.49 times/min, and static tension as 6.96 cN, the optimal warp fatigue life was 1394.05 times. The theoretical and experimental values were in reasonable agreement, and the relative error was less than 1%. Verification and repeated trial results showed that the optimal parameters had good reproducibility, and the warp fatigue life tester with the optimal parameters provided an effective and reliable evaluation to the warp frictional, stretching, and buckling effects.
Introduction
Warps are subjected to various tensile strains and frictions during weaving. The tensile strains mainly derive from the warp tensions and the motions of shedding and beating-up. The frictional effects mainly result from the relative movement between warps and back beam, drop wires, heddles, and reeds. The capacity of warp sustaining various dynamic loads is characterized by the warp fatigue life.
The warp fatigue life is defined as the number of weaving cycles the warp can withstand on the loom, which directly reflects the weaving performances of warps. Techniques that permit the prediction of weaving performances for warps before they are actually woven in the loom would be helpful. An ideal method of estimating the weaving performances of warps is to run a certain length of warp on a loom and record the number of shedding and beating-up. However, this method is operation complex and time consuming. In order to find an expedient laboratory method to test the fatigue properties of the warps, many studies1–6 have reported on the yarn abrasion tester and measurement methods. A variety of abrasion mechanisms, including abrasion around rods and against three or four pins, an agate knife-edge, and emery paper, yarn-against-yarn abrasion, and abrasion in model loom simulators, were used. Faasen and Harten 7 underlined the importance of protection from abrasion imparted to the yarn and the yarns were rubbed against the metal pins by the reciprocating motion of the metal plates on which the metal pins were mounted in the abrasion tester. Brorens et al. 8 studied the failure behavior of yarns under abrasive forces and experimented with an abrasion tester consisting of three pins, which were oscillated to and fro to wear the yarn specimen abrasively. Behera and Pakhira 9 discussed a laboratory evaluation of the performance of polyester-fiber multifilament sized yarn, and the splitting of yarns was measured on a Reutlingen Web Tester which simulated major stress in weaving but excluding beat-up and yarn entanglements. Maatoug et al. 10 found that the performance of sized cotton warp was improved with the improvement of abrasion resistance, and the simulating apparatus used to test the abrasion of the stationary warps was relatively simple. Kim et al. 11 developed a weaving simulator which indicated such shedding and beat-up motion of warps and investigated the relationship between warp tension, weft thickness, weft density, shedding height, and the beat-up force which was a crucial one affecting fabric quality. Ishtiaque et al. 12 studied the weavability of polyester/viscose spun yarns on the shedding device attaching to a constant tension transport (CTT) instrument. Budd 13 developed a fatigue tester for yarns and cords based on repeated flexing or bending of the cord, while it was maintained under a static load. Slodowy 14 reported a multistage generator of tension and abrasion. In contrast to the conventional tensile or abrasion tester, the cascade generator provided a complex test in which the quality of the yarn was tested in an environment of accessory loads. However, the above mentioned evaluation methods mainly focused on one pure mechanical property, such as tension and abrasion, and thus, they failed to reflect the capacity of the motion warp under multiple dynamic loads.
Therefore, a novel evaluation instrument, that is, warp fatigue life tester (WFLT), was developed to investigate the fatigue fracture of moving warp under a variety of external forces. Warp fatigue life was introduced as an index to measure the times of dynamic load cycles. Meanwhile, this article also analyzed five factors which affected warp fatigue life by using single-factor experiments, and the optimal factor level was investigated based on the response surface methodology (RSM) analysis.
Experiment
Sample preparation
Ring spun cotton yarns (14.5 tex) collected from Junda Sizing Technology Co. Ltd (Wuxi, China) were used in the experiments. The yarns were sized with compound–modified starches and polyvinyl alcohol at a ratio of 1:2 on a sizing machine (Karl Mayer Ltd, Germany). The sizing additives were SD propylene paste, JD-011 high-performance sizing, and SFO-301 high-efficiency sizing lubricant. All yarns were conditioned at 20°C and 65% relative humidity (RH) for 24 h. Yarns of about 2-m length were prepared for the experiment test.
Experimental instrument
Schematic diagram of the WFLT is shown in Figure 1. The WFLT consists of a crank slider mechanism and a crank rocker mechanism. A crank slider mechanism driven by an asynchronous motor controls the reciprocating movement of the heald frame in the fixed guide rail. A crank rocker mechanism driven by another asynchronous motor controls the back and forth motion of the reed. Two motors controlled by a frequency converter could make the heald frame and reed move in synchronization. The test yarn is driven by four guide rollers of all the main driving wheels and moves circularly at a certain speed. During the test, the heald frame and the reed reciprocate once, and they produce a tensile, friction, and buckling effect on the yarn. The internal counter of the tester recorded the fatigue life once. The control panel could set the speed parameters of the instrument, and the control button could control the start and stop of the tester.

Schematic diagram of the testing device. (1) Yarn; (2) Guide rollers; (3) Static tension regulator; (4) Splitting device; (5) Dropper and induction device; (6) Guide shaft; (7) Heald and heald frame; (8) Reed; (9) Pre-tension device; (10) Control panel; (11) Control button.
In order to reflect cyclic stresses between warps and machine parts flexing during the weaving process, standard components with less than actual rates of shedding and beating-up used on the commercial looms were incorporated in the measuring device.
One end of the warp was fixed, and the other end passed through the dropper and then through the heddle eye and the reed. Finally, the two ends were knotted by hand. The heddle eye was mounted on the heddle. The heddle eye during heald frame moving imparted flex abrasion and cyclic stresses to yarn. The reeds during swinging from side to side imparted only flex abrasion to yarn. Five parameters of the tester, that is, load frequency, warp speed, pre-tension weight, heald frame stroke, and static tension, were set. The number of cycles required to break yarn in trials was the index of fatigue life. Fifty warps were tested for each sample, and the average value of the indices for fatigue life was reported.
Experimental design
Single-factor experiments were carried out to study the effects of the five factors on the warp fatigue life in order to determine the significant factors and their ranges. The Box–Behnken Design15,16 (BBD) based on the RSM is a statistical tool that uses quantitative data to optimize operating conditions. To systematically evaluate the main and interaction variables that affected the warp fatigue life, the Box–Behnken statistical design was employed to optimize the factors and Design-Expert 8.0.6 software was introduced for experimental design analysis and data processing.
The RSM17–19 is a collection of statistical and mathematical techniques useful for developing, improving, and optimizing processes. It also has important applications in the design, development, and formulation of new product design, as well as in the improvement of existing product designs. In the method, lots of experimental data are needed to build multivariate equations. By making mathematical models and designing charts of the relation between the response value and factors, the experiments for optimizing parameters can be conducted, and the interaction among all the factors can be analyzed.
It should be noticed that the RSM include planning of experiments and statistical methods to make experimental model as follows by equation (1)

This statistical model may be further expressed as a second-order polynomial (quadratic model) which is popular for the most fitted data as follows by equation (2)

where b0, bi, bii, and bij are constant coefficient, linear coefficients, quadratic coefficients, and interaction coefficients, respectively, while xi and xj are coded values of variables.
The second-order polynomial response equation (3) was employed to correlate the dependent and independent variables

In this equation, b0 is an independent term according to the mean value of the experimental plan, bi are regression coefficients that explain the influence of the variables in their linear form, and bij are regression coefficients of the interaction terms between variables.
Analysis of variance (ANOVA) was performed to evaluate the statistical significance of model terms. In this study, ANOVA was used to analyze the data to investigate the interactions between the independent variables and the response. The ANOVA combined with the application of F test as well as the coefficient of determination (R2, Adjusted-R)2 was also utilized to evaluate the fitting quality of the polynomial model. R2 and adjusted-R2 were obtained by equations (4) and (5), respectively
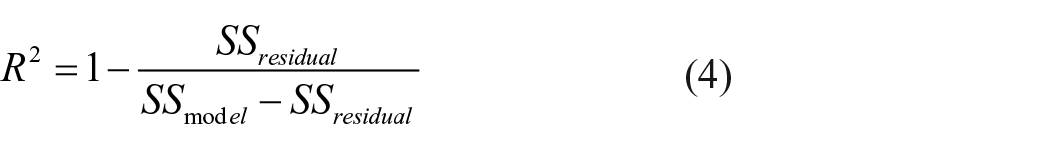

In equations (4) and (5), SS is the sum of squares, and DF is the degrees of freedom.
In order to verify the reliability of the experiment results, the experiments were carried out and relative error was obtained.
Results and discussion
Load frequency
Load frequency was the motion frequency of the heald frame and the reed on the WFLT and also represented wear frequency. The load frequency had the similar effect on the warp as the loom speed did. A higher load frequency was expected to have a closer reflection of the real weaving situation of loom. However, a high speed of loom affected the stability of the machine and the end breakage rate of warp, while a low speed of loom influenced the weaving efficiency. 20 Thus, the single factor experiment was conducted to determine whether it was significant and selected the appropriate load frequency, and the other parameters were kept constant (warp speed 5 cm/min, pre-tension weight 30 g, heald frame stroke 80 mm, and static tension 10 cN). The effect of load frequency (60, 120, 180, 240, and 300 times/min) on the fatigue life of warp was shown in Figure 2.

Effect of load frequency on fatigue life.
As can be seen from Figure 2, the fatigue life of warp first rose as the load frequency increased from 60 to 240 times/min. When the load frequency exceeded 180 times/min, the fatigue life of the warp significantly increased from 1238 to 1447 times. The improvement of fatigue life resulting from the increase of load frequency was greatest at the load frequency of 240 times/min. An increasing load frequency appeared to give the warp a higher fatigue life, and with higher frequency of load, the fatigue life curve became steeper. The reason was mainly due to that during warp fatigue, the internal structure of warp changed with the increase in the deformation speed of warp elongation. 8 Because of a low-load frequency, the surface slurry was slowly worn off, and the elongation deformation of warp during fatigue began later. Owing to the slow speed of elongation deformation and delaying inter-fiber slippage, the components could sufficiently rubbed against the warp. 21 Consequently, warp with slow elongation would be broken first because of its brittleness. This was also explained by that a considerably short fatigue life was due to a slow plastic deformation of the warp. In addition, the ANOVA was carried out to analyze the significance of the means, and the means of the load frequency showed significant difference as indicated by the p value < 0.001.
As observed, the fatigue life of warp second descended as the load frequency increased from 240 to 300 times/min. This was mainly because that overload frequency caused the stability of the moving parts descending. Excess bounce of heavy hammer led to test error, and the fatigue life of the warp was also prone to decline, while appropriately high-load frequency intensified the fatigue life of the warp.
Warp speed
By setting other parameters at constant values, that is, load frequency of 240 times/min, pre-tension weight as 30 g, heald frame stroke of 80 mm, and static tension at 10 cN, the effect of warp speed (1, 5, 10, 15, and 20 cm/min) on the fatigue life of warp was depicted in Figure 3.

Effect of warp speed on fatigue life.
As shown in Figure 3, the fatigue life of warp changed slightly with the increase in warp speed from 1 to 20 cm/min. Similarly, the warp speed had no significant effect on the fatigue life according to the ANOVA results. This was ascribed to the fact that the warp speed did not have extra friction action.
The warp speed only reflected that the WFLT was used to test the fatigue life under the motion state of the warp. A traditional abrasion tester was used to test the abrasion resistance of static warp. However, it was different from the state in which the warp was woven.
Pre-tension weight
The pre-tension weight was designed to endow the warp some tension. The heavier the weight, the greater the tension; the greater the load, the lower the fatigue life. Pre-tension weight was used to achieve almost the same peak tension as the warp on the loom. Peak tension referred to the dynamic tension of warp, 22 which was always changing both on the loom and on the WFLT. The peak tension of warp on the WFLT was obtained by randomly extracting the mean value of the peak tensions of 50 cycles in the process of experiment. The two peak tensions were compared in order to have a better reflection of the real weaving environment. Under the condition of the load frequency 240 times/min, heald frame stroke 80 mm, static tension 10 cN, and warp speed 5 cm/min, the influence of different pre-tension weight 10, 15, 20, 25, and 30 g on the fatigue life of warp was investigated. In the meanwhile, the mean values of the peak tensions were recorded. For the warp (14.5 tex), different pre-tension weights corresponding to different peak tensions of warp were shown in Table 1.
The relation between pre-tension weight and peak tension.

When pre-tension weight was 30 g, the peak tension of warp on the WFLT was almost the same as that on the loom. Therefore, the pre-tension weight could be used to adjust the warp tension on the WFLT to achieve the same effect as the warp on the loom in terms of weaving tension.
Heald frame stroke
Different types of looms had different shedding heights. The improper shedding heights caused serious consequences. For example, a shallower shedding height affected the flying speed of the weft and eventually led to unclear shedding; a deeper shedding height was easy to cause the excessive fluctuation of the warp tension at the heald wire and finally caused end breakage. 23 The heald frame stroke was mainly determined by the shedding height. The reason was that the heald frame stroke on the WFLT had the similar mechanism identical to the shedding height of loom, and the function was to ensure the warp to sustain a certain buckling, abrasion, and stretching during the test of fatigue life. The load frequency, pre-tension weight, static tension, and warp speed were 240 times/min, 30 g, 10 cN, and 5 cm/min, respectively. The fatigue life of warp was measured when the heald frame stroke was 60, 70, 80, 90, and 100 mm. The effect of heald frame stroke on the fatigue life of warp was displayed in Figure 4 below.

Effect of heald frame stroke on fatigue life.
As shown in Figure 4, the fatigue life of warp first increased from 1292 to 1446 times with the increase in the heald frame stroke from 60 to 80 mm. And it reached the maximum until the heald frame stroke was 80 mm. It was ascribed to the fact that warps tended to extend before complete failure occurred, which was associated mainly with the reciprocating motion of the heald frame. Due to the higher warp extension caused by a proper stroke of heald frame, the overall stress reduced, which subsequently led to higher energy-to-break the warp and thus recorded more average number of fatigue cycles. And it was well known that the shedding height was directly proportional to the square of warp elongation. The lower fatigue life of warp was attributed to a slight stretching of warp caused by a lower stroke of heald frame. As previously stated, a lower plastic deformation meant a shorter fatigue life of warp. 21
However, when the heald frame stroke was over 80 mm, the fatigue life started to decline steeply. This was ascribed to the fact that fatigue life decreased rapidly with a suddenly increasing tension. 8 Moreover, based on the ANOVA results, heald frame stroke had the significant effect on the fatigue life by the p value < 0.001.
It was consistent with the study that the shedding height on a loom should maintain a suitable value; a shallower or deeper shedding height was not conducive to the improvement of the weaving efficiency.
Static tension
Warp tension was divided into static tension and dynamic tension. In order to ensure the continuity of the weaving process, the let-off mechanism must endow the warp with certain static tension. It was essential to set an appropriate static tension. A higher static tension caused the warp broken due to the excessive tensile strength; a lower static tension brought about woven defects and eventually affected fabric quality. 24 For example, the fabric was not tight enough due to a lower tension and so on. The warp on the WFLT was tensioned by the static tension regulator. The fatigue life of warp was tested under the condition of the load frequency 240 times/min, pre-tension weight 30 g, heald frame stroke 80 mm, and warp speed 5 cm/min by changing static tension. The effect of static tension (0, 5, 10, 15, and 20 cN) on the fatigue life of warp was shown in Figure 5.
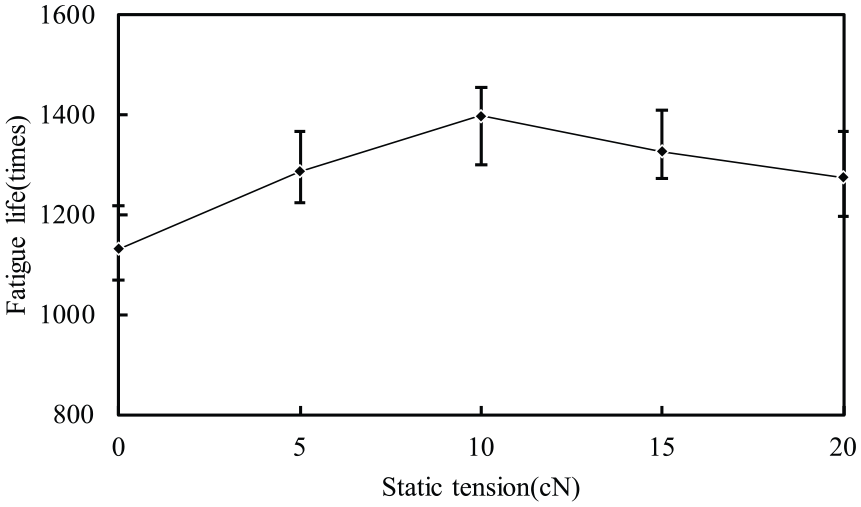
Effect of static tension on fatigue life.
It can be observed that, with an increase in the static tension from 0 to 10 cN, the fatigue life of warp increased from 1133 to 1398 times. It meant that the fatigue life of the warp was even shorter under the condition of a lower static tension. The reason was that the warp was prone to stress relaxation after a short time load; hence, it had a poor capacity of long duration.8,22 The fatigue life was effectively improved with an appropriate increase in static tension. However, when the static tension was over 10 cN, the observed lower fatigue life was attributed to the force in the warp increasing more rapidly with higher static tension. 25 Such breaks were caused by excessive tension rather than fatigue. Similarly, the ANOVA was carried out, and the means of the static tension showed significant difference as indicated by the p value < 0.001.
The goal of the single-factor experiment was to determine the significant factor and the level of the significant factor. Since warp speed had little effect on response value fatigue life based on the results of ANOVA, it was not a significant factor. According to the peak tension of warp, 30 g was the optimum setting for pre-tension weight. The ANOVA was carried out, and the means showed significant difference as indicated by the p value < 0.001. Therefore, the significant factors on fatigue life determined by single-factor experiment were heald frame stroke, load frequency, and static tension. The optimum settings of significant factors were affected by 70–90 mm of heald frame stroke, 240–300 times/min of load frequency, and 5–15 cN of static tension according to inflection points in each figure.
BBD and analysis
From the above analysis, the three factors having a significant impact on fatigue life were heald frame stroke, load frequency, and static tension.
A sequence of Box–Behnken experiments were performed that would yield the most information about the factors and their interactions in as less experiments as possible (17 runs). 26 The number of required experiments can be calculated using equation (6)

where N, f, and C0 denote the numbers of experiments, variables, and central points, respectively.
A three-factor and three-level factorial Box–Behnken experimental design was carried out around the optimum to locate optimum levels of heald frame stroke(X1), load frequency(X2), and static tension(X3). Factors and levels of the BBD experiment were shown in Table 2, and the design table and results of the BBD experiment were shown in Table 3.
Factors and levels of BBD experiment.

BBD: Box–Behnken design.
Design table and results of BBD experiment.

BBD: Box–Behnken design.
A quadratic multinomial regression equation was utilized to evaluate the relationship between response value fatigue life and heald frame stroke, load frequency, and static tension. The quadratic multinomial regression equation generated by Design-Expert was described in equation (7) in terms of coded factors
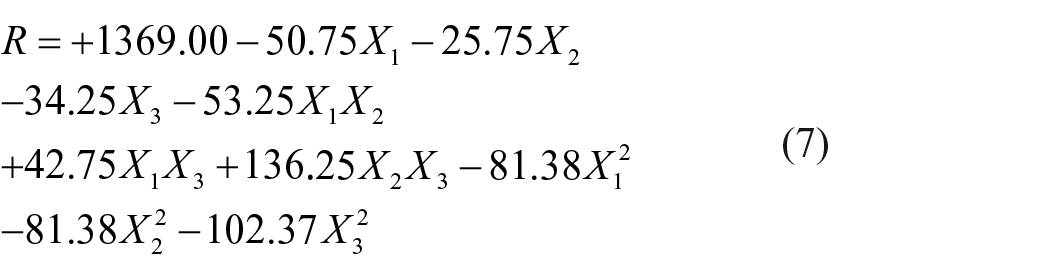
The equation represented the quantitative effect of the factors and their interactions on the response values. The levels of X1, X2, and X3 were substituted in the equation to obtain the theoretical value of R. The model equation was tested for significance, and its variance was analyzed. The p value of the equation was less than 0.05, which indicated a significant effect of independent factors on the response value. Hence, it assured that the current model provided a satisfactory fit to the data. ANOVA results for the response surface quadratic model and regression coefficients were shown in Table 4.
Analysis of variance for the response surface quadratic model and regression coefficients.

R2 = 0.9755, R2 (Adj) = 0.9720.
Significant at 95% confidence degree (p < 0.0001).
As can be seen from Table 4, the correlation coefficient R2 (Adj) of the regression model was equal to 0.9720. It indicated that the model was well fitted. The p value of the regression model was less than 0.0001. It implied the model was significant. The p value of the regression model’s lack of fit was equal to 0.9871, which was obviously greater than 0.05. It signified that the regression equation did not lose its fit and the model stability can be well predicted. The p value of all three factors was less than 0.05, which meant that all three factors were significant factors. According to F value, the order of the three factors which affected fatigue life was heald frame stroke, static tension, and load frequency.
In addition, a series of three-dimensional (3D) and two-dimensional (2D) frameworks for affecting fatigue life were further depicted to study the interaction and quadratic effects of the three factors on the response value. The 3D response surface and contour illustrations for fatigue life were presented in Figure 6, respectively.

The response surface and contour illustrations for fatigue life: (a) Effects of heald frame stroke and load frequency on fatigue life, (b) effects of heald frame stroke and static tension on fatigue life, and (c) effects of load frequency and static tension on fatigue life.
Figure 6(a) to (c) showed the graphical correlations among heald frame stroke (X1), load frequency (X2), and static tension (X3). According to the graphics, Figure 6(c) had the steepest gradient and an inclination trend to a maximum, followed by the Figure 6(a) and (b). It showed that the interaction between load frequency (X2) and static tension (X3) had the most significant effect on fatigue life (R), followed by heald frame stroke (X1) and load frequency (X2) as well as heald frame stroke (X1) and static tension (X3). The reason was that the interaction between load frequency (X2) and static tension (X3) during warp fatigue gave rise to the strain stress for warps. Similarly, the shape of the contour plot also reflected the significance of the interaction. The elliptic contour indicates that the interaction of two factors had a significant effect on the response value, while the circle had the opposite effect. As observed, the interaction between load frequency (X2) and static tension (X3) had the most significant effect on fatigue life (R), followed by heald frame stroke (X1) and load frequency (X2) as well as heald frame stroke (X1) and static tension (X3). It was consistent with the result of ANOVA.
When the static tension (X3) was fixed, the load frequency (X2) increased from 180 to 300 times/min, and the fatigue life (R) had a trend of increasing first and then decreasing to some extent. Figure 6(c) showed that a lower fatigue life (R) could be obtained when load frequency (X2) ranged from 210 to 300 times/min and the static tension (X3) was fixed, which was attributed to the mean warp tension increasing with an increase in load frequency. In addition, a higher warp tension meant an increase in weaving breaks. This coincided well with a previous study, 8 in which the yarn abrasion resistance decreased rapidly with an increasing tension. At the same time, the variance analysis of the response surface model also showed that the heald frame stroke (X1) had the most significant effect on the fatigue life (R), followed by the static tension (X3) and the load frequency (X2). It was mainly due to the fact that the reciprocating motion of the heald frame had a significant tensile, buckling, and friction effects on the warp. Therefore, the heald frame stroke affected the warp fatigue life to the maximum extent.
As shown in the Figure 6(b), the fatigue life (R) also had an increasing trend first and then an decreasing trend as heald frame stroke (X1) increased from 70 to 90 mm. In addition, a lower fatigue life (R) could be obtained between 80 and 90 mm, when load frequency (X2) and static tension (X3) were kept constant. This was mainly due to the fact that an excessive fluctuation of the warp tension was caused by an increasing shedding height and finally caused the warp to break. 27 The fatigue life (R) also tended to increase first and then decrease, when the static tension (X3) level ranged from 5 to 15 cN. As can also be seen in the Figure 6(b), the interaction between heald frame stroke (X1) and static tension (X3) had an obvious influence on the fatigue life (R). However, according to Figure 6(a) and (c), the interaction between load frequency (X2) and static tension (X3) had the most significant effect on fatigue life (R). In summary, a lower heald frame stroke was favorable to improve the fatigue life. The static tension should be also controlled in a proper scope. A higher or lower static tension was not conductive in improving the warp fatigue life.
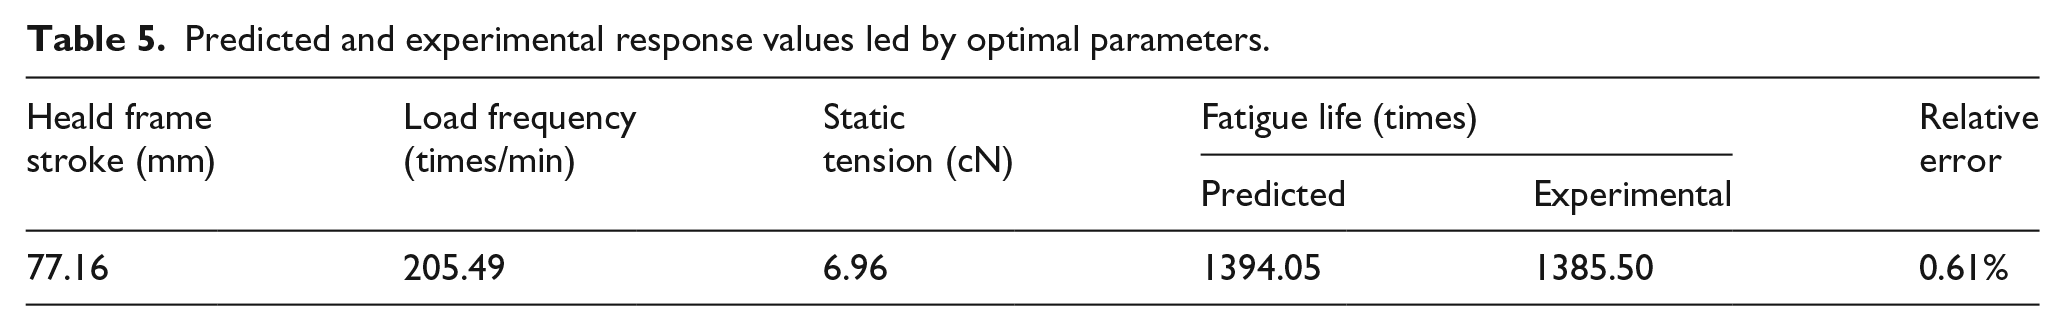
Through Design-Expert 8.0.6 statistical analysis software to solve the regression equation, the optimal parameters of WFLT taking fatigue life as the response value were proposed: heald frame stroke 77.16 mm, load frequency 205.49 times/min, static tension 6.96 cN, and fatigue life 1394.05 times. For the convenience of calculation, the optimal parameters of WFLT were determined to be 77 mm of heald frame stroke, 205 times/min of load frequency, and 7 cN of static tension. According to determined optimal parameters for actual experiments, 50 repeated experiments were conducted, the average observed value of fatigue life was 1385.5 times, and the coefficient of variation (CV) value of test data was 12.52%, which confirmed the stability and reliability of the experimental results from the WFLT. To verify the validity of the optimization results, predicted and experimental response values led by optimal parameters after optimization with the response surface method were shown in Table 5. The theoretical (predicted) and the observed values were in reasonably good agreement, and the relative error was less than 1%, indicating that the optimization results proved the validity of the model.
Predicted and experimental response values led by optimal parameters.
Conclusion
A newly developed WFLT was reported in this article. The warp fatigue life measured by the WFLT could be used to evaluate the performance of sized yarns. Five parameters of the WFLT were investigated based on the RSM. It was found that heald frame stroke, load frequency, and static tension showed significant effects on the warp fatigue life by using single-factor experiments. Taking cotton yarn (14.5 tex) as an example, the response surface analysis method was used to determine the optimal factor levels. When heald frame stroke, load frequency, and static tension were 77.16 mm, 205.49 times/min, and 6.96 cN, respectively, the experimental warp fatigue life was 1385.50 times. Through 50 repeated experiments, we found that the relative error of the theoretical and experimental values was less than 1, which indicated the testing results were in reasonable agreement. In the meanwhile, the measurement method proposed in this article was significantly applied to obtain the fatigue life of the different sort of yarns, including count and material. Therefore, the WFLT could reflect the fatigue life and failure process of warp effectively and be used to evaluate the fatigue fracture characteristics of warp under the dynamic load reliably.
Footnotes
Declaration of conflicting interests
The author(s) declared no potential conflicts of interest with respect to the research, authorship, and/or publication of this article.
Funding
The author(s) disclosed receipt of the following financial support for the research, authorship, and/or publication of this article: This study was funded by the Postgraduate Research & Practice Innovation Program of Jiangsu Province (No.KYCX18_1831) and Postdoctoral Research Grant Project of Jiangsu Province (No. 2019K108).