
Abstract
The most important parameters characterizing thermal comfort of garments are thermal resistance and water vapour permeability. Contrary to common garments, protective and sport garments (dresses) are often used in wet state (due to the absorbed sweat), which affects their comfort properties. That is why testing of both mentioned parameters in recent became important, along with the determination of the drying rate and drying time of sport dresses and underwear. However, current method of the drying rate mostly does not enable reliable measurement of this parameter, mostly due to non-isothermal conditions during the measurement and unknown velocity of the drying rate. In the article, a new method and instrument determination of the isothermal drying rate and drying time of sport dresses and underwear are presented, which is executed under at constant velocity of the parallel air flow. The reliability of the instrument and related method was verified by determination of the drying rate of selected woven fabrics.
Introduction
In last decades, importance of functional clothing involving sport, outdoor and other protective garments is increasing, and lot of attention is paid to testing of their sensorial and, namely, thermophysiological comfort. Besides testing of their thermal and water vapour resistance, also testing of hydrostatic resistance of outdoor clothing became an essential parameter of their quality. Moreover, in last years, also testing of thermophysiological comfort of these products under real conditions of their use, namely, in wet state (caused by the absorbed sweat and rain), appears in the offer of testing laboratories, as well as determination of the drying rate of functional underwear and sport dresses.
Unfortunately, the existing methods of the drying rate evaluation do not always provide satisfactory instruction on how to test the drying rate objectively. The important parameter, the drying air velocity, is often omitted. Generally, it is difficult to test the drying rate correctly mainly due to the inconsistencies in the available standards and methodologies.
The article starts with a survey of all important methods and instruments used for the evaluation of the drying rate of textiles. Theory of drying and recording of drying curves is also mentioned. In the practical part, the new method for measurement of the drying rate is introduced and compared with the one of the newest methodologies based on the measurement of temperature of dried textile. In the next chapter, a prototype of a new instrument simulating real conditions of the fabric drying and for measurement of drying time is also introduced, which enables to run the fabric drying at various velocities of a laminar flow blowing along the surface of the tested sample.
Comparison of the most used methodologies
There are several standardized methods enabling the determination of the drying rate of wetted textile fabrics and the measurement of their drying time (Table 1). The available methodologies include the following:
AATCC Test Method 195-2009: Liquid Moisture Management Properties of Textile Fabrics; 1
AATCC Test Method 199-2011: Drying Time of textiles: Moisture analyser Method; 2
TNI CEN/TR 16422: Classification of thermoregulatory properties; 3
ISO 17616: Textiles: Determination of moisture drying rate; 4
JIS L 1096-1999 – Drying speed; 5
AATCC TM 201-2014: Drying Rate of Fabrics: Heated Plate Method. 6
Overview of test method for drying rate.

AATCC: American Association of Textile Chemists and Colorists; TM: Test Method.
The standard AATCC Test Method 195-2009: Liquid Moisture Management Properties of Textile Fabrics is determined for measurement, assessment and classification of the level of liquid moisture in knit, woven and non-woven fabrics. Results obtained as means of the method are based on the water resistance, water repellence and absorption of water with respect to textile structure including geometrical and inner structure and capillarity of single fibres. The sample is placed between the two horizontal (upper and lower) electrical sensors; each of them comprises seven concentric circles of needles. A predetermined quantity of the test solution is applied to the centre of the upper side of the test fabric. The solution is spread to three directions – radially across the upper surface, through the sample to the underside and further radially across its lower surface. The individual changes of the electrical resistance of the test samples are recorded during the measurement. In the following step, the changes of liquid moisture in the textile are counted from changes in electrical resistance, and the properties of the dynamic transfer of liquid moisture in multiple directions are determined. The aggregation of the individual measured values is then used for evaluation and classification of moisture management properties. 1
In 2008, unofficial techniques for determining drying properties were published. Subsequently, the new AATCC Test Method 199-2011 was issued: Drying Time of Textiles: Moisture Analyser Method. 2
The textile sample is moistened and then dried at a given temperature until it reaches the drying end point. The end point of drying is the state where the weight of the fabric is about 4% higher than its weight in the dried state. 2 Time needed for reaching this state is called as the drying time. When the sample is moistened, it is immersed in deionized water for 1 min. Then, the sample is suspended vertically for 5 min and left freely to dry. After then, the sample is again weighed. 2 The method can be used only for materials that can be labelled as absorbable. 7 The instrument moisture analyser is used for realization of the test. The instrument does not allow the real conditions to be simulated, it means, the presence of the air flow and heating, which helps to speed up drying, and it corresponds to better usage of functional textiles on the body of wearer. 2
Another method called BPI is described in the standard TNI CEN/TR 16422: Buffering capacity of liquid sweat and sweat transport – transfer of liquid sweat and balancing of liquid sweat. 3 The equipment for measurement of evaporation and thermal resistance, so-called small skin model, is used in the method. During the measurement, both the air flow and the heating of the material during the drying process simulating the drying effect on the wearer’s skin are applied. The testing is carried out using the device described in ISO 11092. The principle is based on the heated plate simulating the effect of sweating. 8 The temperature of the plate is set at 35°C, and relative humidity of the ambient air is set at 40%. The advantage of the method lies in its speed and not too big ambitiousness. However, it has no explanatory power concerning the course of drying and determination of the time, when the fabric is fully dry.
The standard in which the moisture drying rate in textile material is described is ISO 17616: Textiles: Determination of moisture drying rate. 4 It can be applied for determination of drying characteristics after wetting by sweat. It can be used for simulating such situation as light sport activity or standard life situation like walking and light manual work.
The same principle described in the standard 4 can be found in the Japanese JIS L 1096-1999 – Drying speed. 5
The methodology specified in AATCC Test Method 201-2014: Drying Rate of Fabrics: Heated Plate Method 6 is based on the measurement of the fabric temperature. The measured fabric is placed on a hot plate which is kept at the temperature 37 ± 1°C, and the sample is wetted by 0.2 mL of water. The plate with the sample is blown by a ventilator set at flow velocity 1.5 ± 0.5 m.s−1. The infrared thermometer is placed above the sample in the distance 1.0 ± 0.1 cm. The sample lies on the drop of water. The moment when the sample is in the first contact with water is taken as initial time. But also here, it is not possible from the course temperatures to determine unambiguously the finish of drying. Furthermore, constant drying conditions are not carried out, and the flow is not exactly defined (it is not laminar, and its velocity will be different at each place). 6
In this article, a new type of the instrument is presented, which enables the recording of the drying curves under the defined conditions of the measurement–temperature and air flow rate. Defined conditions of the measurements were temperature of the sample and the air at 21°C and the air relative humidity of 50%. The measurement was carried out at three defined air flow velocities reaching 2, 3 and 4 m.s−1.
Drying
Drying is a process during which liquid (water) is removed from the wetted fabric. First, water evaporates from the free level on the fabric surface and transferred away by the convection flow and lateral gradient of humidity inside the fabrics created, which drives water from inside the fabric to its surface (internal diffusion). 8
The wet material is, therefore, a mixture of absolute dry solids and water. 9 The dimensionless fraction of moisture in the fabric WW is expressed by equation (1)

where mw is mass of water (kg) and mF is mass of dry fabric (kg). 10
Moisture can have a very loosely bound form, which can be removed under certain conditions and so-called equilibrium moisture, which remains in the material after drying and is in equilibrium with the water content in the air. The equilibrium moisture value depends on the characteristics of the drying air (relative humidity and temperature) and the dried material. Very loosely bound moisture can be removed from textile materials to some extent by mechanical methods (such as centrifugal extraction, squeezing or vacuum extraction). This moisture is located between the yarns comprising the fabric. Water droplets trapped within the fibres by secondary forces such as hydrogen bonding are not removable by mechanical means and must be vaporized; in order to be removed from the material during the drying process, thermal energy is used. 10
Industrial drying systems and some testing instruments use the non-isothermal drying where along with mass transfer convection heat transfer also takes place. The speed of this process expresses the intensity of moisture mass flow (drying rate) m* (kg.m−2.s−1)

where mw (kg) represents the mass of water, S (m2) the area and τ (s) the time. Here, the difference of water vapour concentration or difference of water vapour partial pressures serves as the driving force. 9
At the beginning of the process, the moist material is brought in contact with an air stream having the same or higher temperature than the temperature of the material and exhibiting lower concentration of moisture than the moisture concentration on the surface of the dried material. 9
The drying process can be divided into three parts:
Initial drying period – the material starts to warm up to the temperature of the wet thermometer. This phase takes place for a very short time.
Period of constant drying rate of the material – the period of evaporation of unbound (very loosely bound) moisture in the material. During this period, that fabric temperature is (theoretically) also constant, and the moisture (mass) of the material linearly decreases. This is the most important phase of the drying process characterizing the wearing (thermophysiological) comfort of a person wearing a dress (underwear) during high physical activities, especially when the dress consists of synthetic, mostly hydrophobic, fibres. Here, the level of the drying rate can be easily determined by means of the convection mass transfer coefficient ß, depending on the dimensionless numbers Sherwood and Schmidt. 11
The period of decreasing drying rate – the period of evaporation of moisture from the inside of the material. This part of the drying procedure sometimes takes longer time when drying fabric contains natural fibres. The process of heat and mass transfer stops when the material cannot be further dried under the given environment conditions. 9
Günther et al. 12 and Brunello et al. 13 studied the course of drying of a fixed cellulose layer under different operational conditions. It was verified that the initial moisture content of samples has no effect on the initial drying rate. Brunello et al. 13 also analysed and proposed a set of equations which correlate the effects of temperature and speeds with the initial drying rate. Their works were followed by Sousa et al., 14 who analysed the effect of some variables of the convective and conductive–convective drying process of natural textile fabrics. They used two types of drying equipment in their analysis. The principle of the first technique lies in the usage of the drying chamber, which is adapted from the drying module of a general chemical laboratory. Cotton samples are placed inside the drying chamber and are exposed to convective flow of hot air. The second instrument consists of a metal box heated by thermostatic bath on which the hob is placed. The textile samples are put on the hob, and the system is exposed to forced convection of the ambient air by means of the use of an adjustable fan.
The influence of the initial moisture content of the fabric, drying (by hot air flow and heated area), temperature and air flow speed in the behaviour of curves during operating conditions are observed. The details about the experimental equipment and construction of drying curves can be found in the study. 15
The generalized drying curves of cotton fabrics in the zone of the falling drying rate under convective and conductive/convective drying based of Page’s equation (3) were published by Motta Lima 16
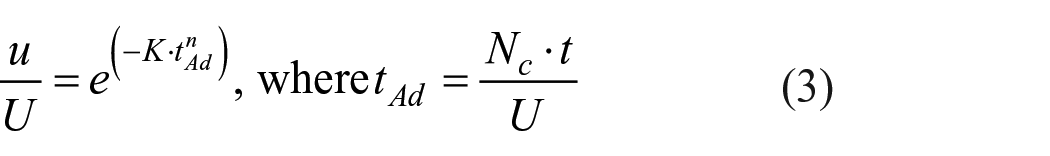
Here, t is the drying time (min), tAd (–) is a dimensionless form of drying time, K and n (–) are drying constants, U (–) denotes the initial moisture content of dry fabric, u (–) represents the moisture content of the dried fabric and Nc means the drying constant (1/min). Krasnikov 17 and Ciesielczyk 18 discussed the methods of generalized drying curves based on the regularity of moisture transfer during drying processes. Based on this, Ciesielczyk 18 proposed a universal drying curve relating the same dimensionless moisture u/U with the first period of the constant drying rate (NC) and tAd as the dimensionless time. On other hand, the drying constant Nc is not specified closer; therefore, this equation is not possible to apply for drying realized under different conditions and structures of the textile materials except for those mentioned in the study. From the point of view of the thermophysiological comfort, the linear part of the drying curve is more important. This is connected with the second period, the constant drying rate of the material, when very loosely bound moisture is evaporated, which affects significantly perception of heat and moisture during wearing of given clothing. Therefore, our study is oriented only to the linear part of the drying curve.
In a study presented by Laing et al., 19 two methods of drying time were evaluated. The first method – line drying time was established by placing a wet fabric specimen in a holder on a Mettler Toledo AT400 balance fitted with a glass draught shield to prevent air movement around the specimen and recording the mass of the fabric at 5-min interval during drying. The principle of the second method lies in the placement of wetted sample faced side up under angle 90° to the air flow speed 1 ± 0.05 m.s−1 in all areas on the heated plate of equipment used for measurement of thermal resistance according to the standard ISO 11092. 4 Stable state and the end of the measurement are defined when temperature reached the constant value 35 ± 0.1°C. This way of measurement respects real conditions, but still, it does not detect the whole drying process. 19
New method and instrument
The new instrument was proposed and created for recording of the course of drying. 20 It is based on the monitoring of the course of moisture weight loss in a fabric under the different laminar flows. The design of this instrument was to some extent inspired by the design of the commercial PERMETEST water vapour permeability tester (Skin model), 21 where also air flow parallel to the sample is used, and similar air velocities (1 and 2 m.s−1) are adjustable. In this instrument, the fabric drying characteristics can also be recorded, being expressed in the form of cooling flow time course, not as the decrease of the fabric mass in the course of time. Unfortunately, the current sample geometry in the PERMETEST instrument does not allow the simple conversion of the cooling flow time course into the mass decrease (evaporation rate) as the function of time; therefore, it was necessary to create a completely new instrument with built-in scales.
The new instrument consists of two main parts (see Figure 1). The first part is the so-called channel. In the channel, different speeds of laminar flow can be adjusted, which is blown over the tested fabric. The second part is the measuring unit on which tested fabric is placed horizontally. The measuring unit consists of an analytical scale (a), aluminium ribs (b) and plate (c). Aluminium ribs are firmly connected with plate (c) and are blown by other three added axial ventilators (d) that provide isothermal drying conditions. The measured sample is fixed to the plate (c) by the clamping frame (e).

Instrument: analytical scale (a), aluminium ribs (b), plate (c), three axial ventilators (d) and clamping frame with sample (e).
The whole tested sample extends into the channel. The instrument is connected with PC. Every 3 min, the ventilator is stopped for 10 s and the current weight of sample is recorded. In the same time, it is possible to measure the temperature of sample by means of a contactless thermometer with respect to the standard AATCC Test Method 201-2011: Drying Rate of Fabrics: Heated Plate Method. 6 The sample temperature is measured by a sensor placed under the sample, in the middle of the evaporation zone. The real instrument is shown in Figure 2. The air flow velocity can be adjusted from 1 to 10 m.s−1 by changing the supply voltage of the main ventilator. As the air flow velocity influences the mass transfer coefficient α (W.m−2.K−1) (depending on the dimensionless numbers Nusselt, Reynolds and Prandtl) and, thus, the drying rate significantly, 9 the air velocity values were checked before each measurement in the channel using an anemometer (at the upper part of the channel is an opening with a cover through which the anemometer can be inserted into the measuring channel).

Instrument for measuring the time course of drying.
Experiment
Tested samples
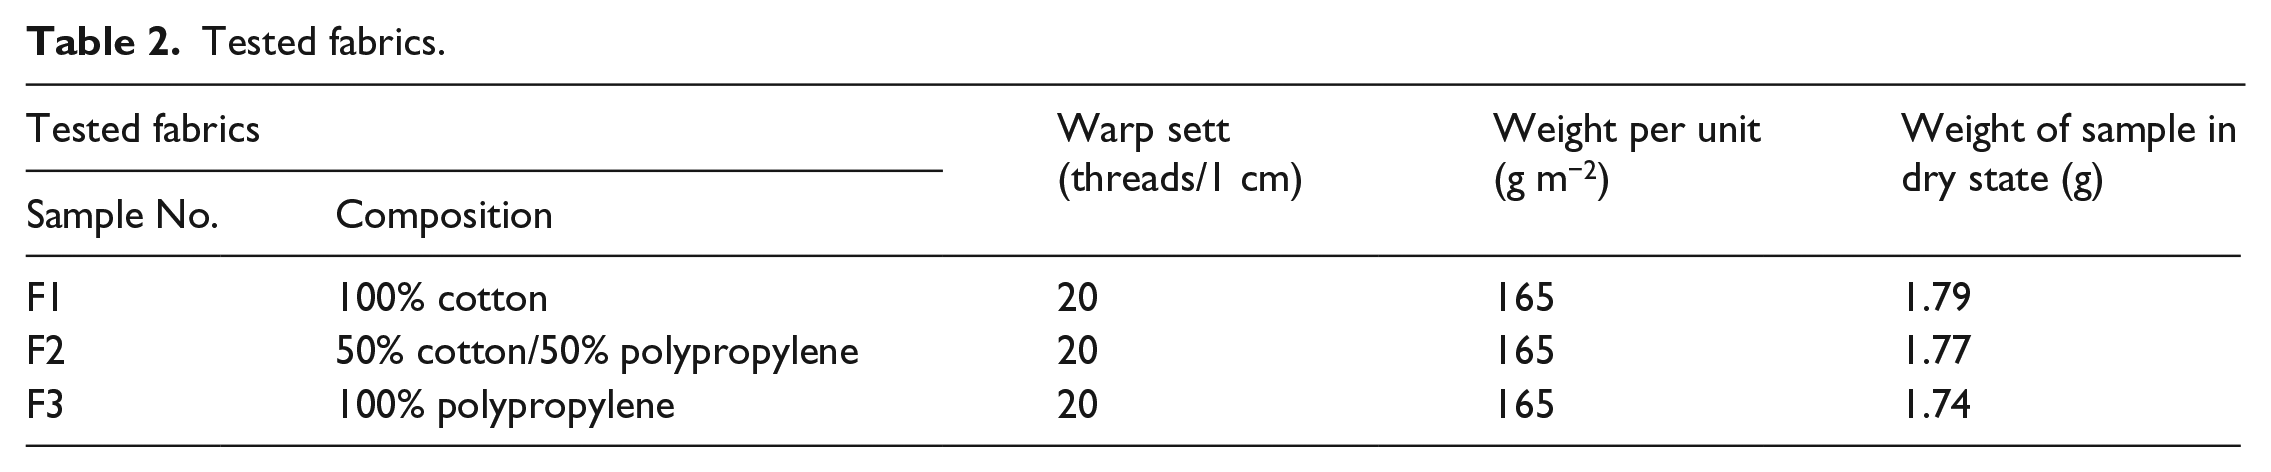
All the measurements were executed on three types of fabrics with plain weave. Other parameters are presented in Table 2. Structures of the tested of fabrics are shown on Figure 3.
Tested fabrics.

(a) 100% cotton, (b) 50% cotton/50% polypropylene and (c) 100% polypropylene.
The course of the experiment and discussion
Several experiments were carried out to verify the new methodology and the new instrument prototype. The first of them was used for verification of the reproducibility and functionality of the new measuring method, the second experiment simulated the temperature recording during sample drying and the third method was based on ISO 17617, 4 method B.
The first experiment was executed at the ambient temperature 21°C and relative humidity 50%. The sample size was 11 × 8 cm.
Before our measurements, all samples were air-conditioned in laboratory for 24 h. Then, samples were weighted on the analytical scales in the air-conditioned state (wac). The air-conditioned weight of the sample wac is understood as a reference value which is used for determination of water amount in the sample after immersion and during drying. In the next step, the samples were dipped into distilled water in temperature 21°C for 60 min. Every sample was subsequently taken out and put on the absorbent paper for 1 min and then placed on the plate of the instrument. Testing was begun at the moment when the ventilator was switched on. The measurement was realized at three air flow velocities 2, 3 and 4 m.s−1. Verification of reproducibility was based on the repeated measurements. Each sample was measured three times.
The end of the drying test was derived from the accuracy of the scales. Its accuracy is ±0.05 g, and therefore, the time when the sample humidity decreased to the level of 0.05 g was considered the end of the test (see Figures 4 to 6, red dotted line).

Drying curves at the laminar flow velocity 2 m.s−1.

Drying curves at the laminar flow velocity 3 m.s−1.

Drying curves at the laminar flow velocity 4 m.s−1.
The results of single measurements for different velocities of air flow for sample F1 (100% cotton) are presented in Figures 4 to 6. It is possible to see that the curves are similar. The differences are given only by the initial amount of water in the samples.
When the durations of drying are compared, the shortest time for drying fabric from 100% cotton was reached under the condition of the highest speed of air flow (4 m.s−1) – about 51 min – and the longest time was detected for speed of air flow 2 m.s−1 – about 69 min. These results thus met the expectation.
The repeatability of the measurements was verified by comparison of regression lines. In these tests, only linear parts of curves in Figures 4 to 6 were chosen. The comparison of regression lines can follow the next principles:
Regression lines have the same size of intercept,
Regression lines have the same size of slope,
Regression lines are identical.
In our situation, only points (b) and (c) can be used as they required the same course of drying. In the situation when the same amount of water is put on the sample, repeatability can be verified by means of test (c), and in the situation when the different amount of water is on the sample, the same size of slope is required.
For the mentioned test, the constant variance is required. Bartlett’s test was used to confirmed that at all realized experiments, the variance can be considered as constant at the significance level α = 0.05. The following test showed that resulting regression lines have the same size of slope at the experiments with the laminar flow velocity of 2 and 3 m.s−1 (Figures 4 and 5) under the condition of laminar flow velocity of 4 m.s−1; the regression lines are identical at the significance level α = 0.05. The first-presented results proved that the measurement repeatability achieved by means of this instrument is acceptable. Next study will follow.
In Figures 4 to 6, the average course of drying curves (full lines) for different speeds of air flow for single materials is compared. The results show that increase in speed of air flow leads to decrease in time of drying about minimally 20% for all types of tested samples F1, F2 and F3 (see Table 3).
Dring time.

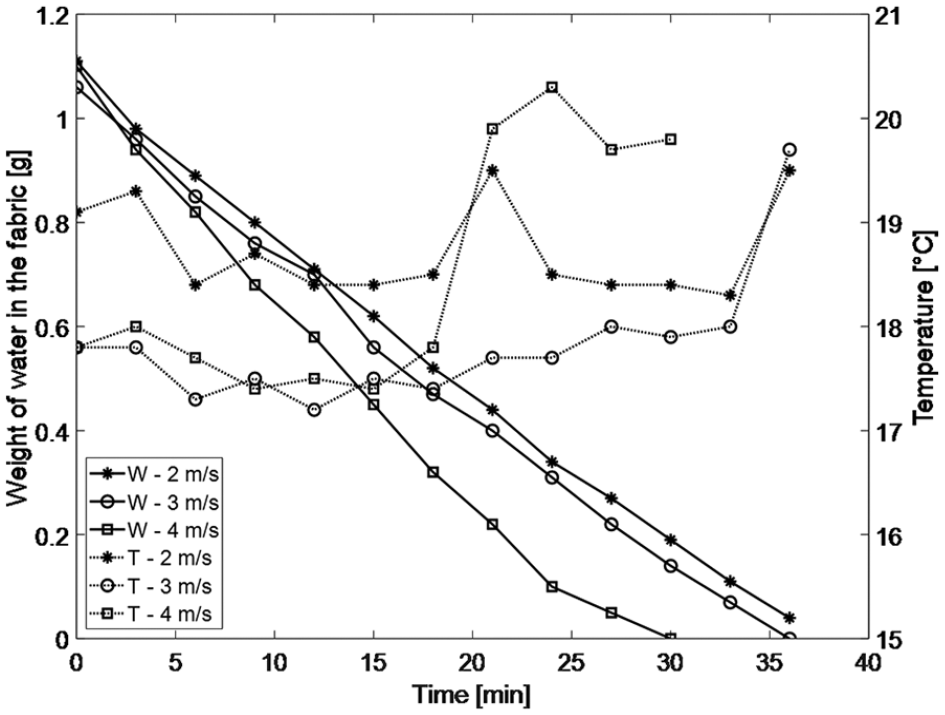
Besides the drying curves, the temperature of samples during drying was observed. The sample temperatures are presented in Figures 7 to 9 (dotted lines). The sample temperature is measured using a non-contact thermometer in a similar way as presented in the standard AATCC Test Method 201-2014, 6 where this type of measuring is used for determination of sample dry state. The resulted course of curves of the sample temperatures obtained using this instrument does not correspond to the mentioned standard and cannot be used for determination of the drying time. Moreover, the use of the non-contact radiation thermometer (pyrometer) requires good knowledge of the surface radiation emissivity of the tested fabric (between 0.7 and 0.95), which changes with the decreasing fabric humidity. Thus, the temperature data obtained by the radiation thermometer must be considered as approximate only.

Drying curves and the fabric surface temperature courses for the 100% cotton sample F1.

Drying curves and the fabric surface temperature courses for the cotton/polypropylene sample F2.
Drying curves and the fabric surface temperature courses for the 100% polypropylene sample F3.
The third method of determination of the drying rate is based on the standard ISO 17617. Unfortunately, samples with an absorption time longer than 60 s are not suitable for testing by this method. Therefore, it was not possible to test the sample F3 from 100% polypropylene; only samples F1 and F2 were tested (see Table 2).
The experiment was carried out at ambient temperature 21°C and relative humidity 65%. The sample size was 8.5 ± 0.2 cm. Before the measurements were started, all samples were air-conditioned in a laboratory for 24 h. The measurement procedure involves the following steps:
A Petri dish with sample is placed on the balance. The conditioned test assembly is weighed (weight in air-conditioned state). Using a micropipette, 0.1 ± 0.01 mL of water was applied to the centre of the Petri dish.
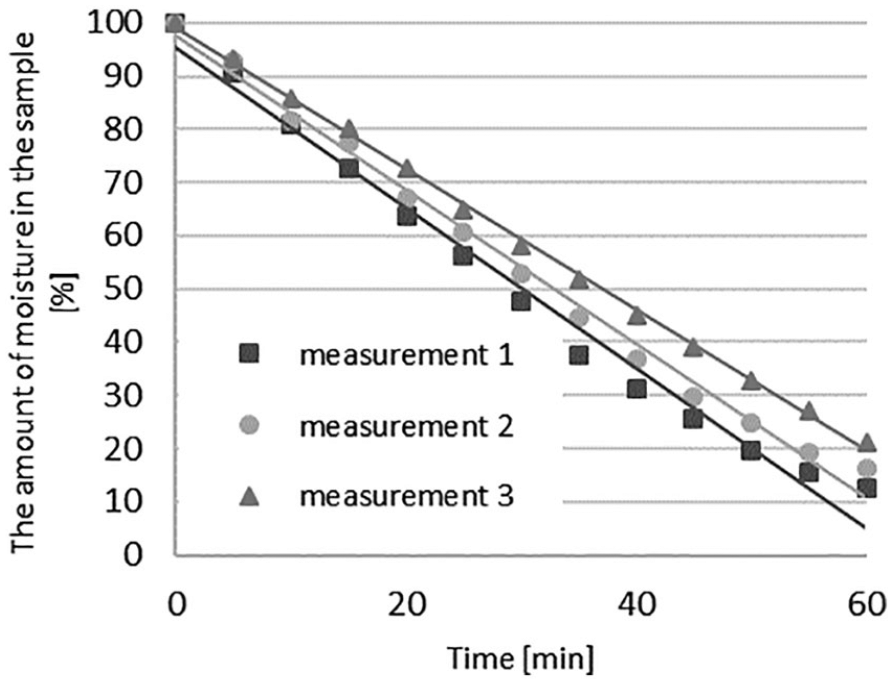
The sample is placed on the dish with a drop of water, and the test assembly is reweighed and the testing was started. The current weight of the sample is recorded at intervals of 5 min ± 15 s until either a total of 60 min has elapsed or until the remaining water mass falls to within 10% of the initial water mass. The results of single measurements for sample F1 and F2 are presented in Figures 10 and 11.

Drying curves for the 100% cotton sample F1.
Drying curves for the cotton/polypropylene sample F2.
It is evident that there is a significant difference between the drying time of sample F1 and F2, which also corresponds to the results of the new instrument prototype. Due to the higher portion of hydrophilic (cotton) fibres in both samples, the maximum measurement time given in the standard is not sufficient, and samples should be measured for a longer time. As this method is not suitable for all materials, it cannot be applied to assess the drying rate of most functional garments. These are made of synthetic fibres and, unfortunately, they are unable to absorb a given amount of moisture within 60 s, as it is required by the standard.
Conclusion
In the article, a new method and instrument determination of the isothermal drying rate and drying time of sport dresses and underwear was presented, which is executed at a constant velocity of the parallel air flow. The results were compared with results obtained according to the standard ISO 17616.
The repeatability of the instrument and related method was verified by determination of the drying rate of selected woven fabrics at different velocities of the parallel air flow. At the same time, the surface temperature of sample was measured.
The comparison of the drying curves shows that the shortest drying time was reached for the 100% cotton sample under the condition of the highest air flow velocity (4 m.s−1) – about 51 min, 45 min for 50/50% cotton/polypropylene sample and 30 min for 100% polypropylene sample. The longest drying time was recorded for the air flow velocity 2 m.s−1 – about 69 min for the 100% cotton sample, 54 min for the 50/50% cotton/polypropylene sample and 36 min for the 100% polypropylene sample. It can be stated that the achieved results meet the expectation. Different results between different materials are due to the different initial relative moisture content of cotton and polypropylene fibres, but mainly due to much lower adhesive forces of water to non-polar polypropylene fibres. The results show that with the increasing air velocity, the drying times decrease at least by 20% for all types of tested samples F1, F2 and F3.
Footnotes
Declaration of conflicting interests
The author(s) declared no potential conflicts of interest with respect to the research, authorship, and/or publication of this article.
Funding
The author(s) disclosed receipt of the following financial support for the research, authorship, and/or publication of this article: The research project SGS no. 21199 of Faculty of Textile Engineering, Technical University of Liberec, funded this research from a grant offered by the Ministry of Education, Youth and Sports of the Czech Republic.