
Abstract
Recognizing alterations in respiration patterns is an essential early sign not only for disease diagnoses but also for determining psychosomatic condition of the individual. The desire for measuring these parameters outside the hospital setting has led to a great interest in embedding this functionality in everyday wearable materials. This study presents an assessment of respiration patterns using a knitted piezoresistive smart chest band. A total of 20 users—Asians and Africans from 8 countries—were tested 14 times over a 67-day period. Experiments were conducted with users being under several varied test conditions including standing and sitting posture, varying physical activities, and different times in the day. Results show a successful application of the band with result patterns being in congruence with studies conducted using other related respiratory measurement technologies and instruments. Sedentary standing posture presented less signal noise compared to physical activity tests. Individuality and the repeatability of results over time suggest feasibility of the use of breath patterns as a biometric feature. Influences of ethnicity, gender, and body mass index on respiration patterns have also been discussed.
Introduction
The piezoresistive effect has been known to those skilled in the art of solid-state chemistry/physics and electronic/electrical engineering for quite some time; however, its application in textiles for strain sensor development is just a little over two decades old. A number of studies and prototype sensors based on piezoresistance 1 have been fabricated to sense breathing—robotics, 2 structural integrity assessment, 3 physical activity tracking, 4 and motor rehabilitation analysis and gait analysis. 5
The application of piezoresistance in the fabrication of breathing sensors espouses the same traits just like any other form of pneumography—respiratory inductive plethysmography (RIP) 6 or impedance plethysmography which measures displacement of thoraco-abdominal compartments and changes in time and pulmonary volume. These piezoresistive sensors are fabricated by either coating piezoresistive materials 7 on a fabric, directly knitting conductive fibers into fabrics, or by stitching. Breathing sensors are usually positioned around the trunk of the user in the form of bands or shirts; 8 however, other placement areas including attachment to backrest of chairs, 9 bed, and the wrist have been experimented on. However, wrapping around the trunk tends to be the dominant mode as it affords not only ambulatory measurements but the stimuli provided by the trunk movement is also significant enough to be sensed by fabric sensors.
The working of the sensors is such that during inspiration the cross-sectional area of the rib cage and abdomen increases altering the resistance of the sensitive section and the frequency of their oscillation, with the increase in cross-sectional area proportional to lung volumes. The electronics convert this change in frequency to a digital respiration waveform where the amplitude of the waveform is proportional to the inspired breath volume (BV).
The respiratory cycle (RC) describes the movement varying volumes of air into and out of the lungs. This phenomenon affords enough oxygen supply to meet the energy production requirements of the body and maintain a suitable acid–base condition by releasing carbon dioxide from the body. Breathing rate measurements are currently not restricted to the clinical setting but are increasingly seen as personal health devices. Most of these sensors are primarily focused on quantitative measure of breathing rate. 1 , 10 The breathing rate gives an indication of the health of the lungs and breathing system as well as other physical and emotional indicators.
The importance of the breathing rate index therefore cannot be overemphasized. Disease severity classification systems including the pneumonia severity index (PSI), 11 CURB-65, 12 and acute physiology and chronic health evaluation (APACHE) 13 all incorporate the respiratory rate (RR) to categorize the most critically ill patients.
However, apart from disease condition, respiratory patterns in even healthy subjects have been reported to vary based on various indicators such as age, gender, ethnicity, and physical condition of subject. Infants are reported to have an average breathing rate within the ranges of 20–40 while adults are reported to breathe between 12 and 20 times per minute. At the age of 65, most elderly people will breathe between 12 and 28 times per minute; those 80 and above breathe 10 to 30 times per minute. Changes in respiratory pattern could also be linked to many different psychological processes and conditions such as emotions and affect, mental load and stress, subjective distress, and psychosomatic disorders.
Even though a couple of research reports have reported of their textile-based breathing sensors, 14 some of these sensors are, however, not suitable for ambulatory breathing measurements as their signal acquisition systems used, which include multimeters, resistance meters are not only bulky but also need to be plugged in a power source. 8 , 14 , 15 Also, these sensors only focused adducing respiration timing data, that is, RR or cycle information. This report presents a sensing system with good form factor comparable to commercial pneumographic or plethysmographic products and capable of ambulatory respiration measurement. Qualities that set this system apart from our previously published studies include the customized signal acquisition and processing software and hardware. This study also seeks to, as a preliminary measure, test the usability of the fully developed prototype system.
Breathing data about subjects, for example, engaged in varying physical, behavioral, or psychological activities such as reading and singing are scarcely available in literature. 16 However, wave forms currently exist for most various breathing conditions such as apnea, cheyne–stokes, and so on.
Subsequently, this study also seeks to conduct a much more expansive study on respiratory patterns, extracting both the timing and volumetric data of various individuals under varied conditions, and assess whether the data so gathered can serve as basis to provoke innovative functional applications such as personal identification, activity recognition, and so on.
Experimental
Materials and methods
The belt is circular weft knitted using the method described in a previous study where several other rib structures were experimented on. 17 This sensor is however produced using 1 × 1 mock rib structure on a Santoni’s SM8-TOP2 circular weft knitting machine (Santoni SPA, Italy). The current system has a portable signal acquisition, processing, and a bluetooth signal transmission capability. Materials used for the band include silver-plated yarns purchased from Qingdao Hengtong X-Silver Speciality Textile Company; nylon DTY and covered elastic yarn from Zhejiang Jinqi New Material Tech. Co., Ltd.; velcro fastening; and connecting cables purchased online from Tmall.com.
The signal acquisition, processing, and transmission system (processing box) was attached to the belt during RR assessment test, and signals were transmitted wirelessly (bluetooth) to a computer for analysis.
The KTC respiration system
The smart band and its accompanying attachments referred to as the KTC respiration system is shown in Figure 1. Its main functions include sensing, signal acquisition and conditioning, signal processing, signal transmission, and relay for display on a personal computer. The knitted band which serves as the sensing unit is attached to the signal acquisition, processing, and transmission system (processing box) during respiration assessment test, and signals are transmitted wirelessly (bluetooth) to a computer for display and analysis. The sensing unit is weft knitted as described in our previous studies. 17 , 18

Prototype of smart chest band.
The schematic circuit diagram of the KTC respiration system is shown in Figure 2. The main hardware components of the processing box are an ARM Cortex-M3 STM32F401RCT6 core board, designed power supply and signal acquisition circuit, HC-08 Bluetooth 4.0 BLE Serial Port Module, two Li-Ion rechargeable batteries, 7805 Voltage Regulator IC, and a USB charging unit. Signal acquisition circuitry converts the strain sensor signals into digital values.

Schematic circuit diagram of the KTC respiration system.
The signal acquisition unit of the sensor is connected to the ADC_IN18 input channel of the microcontroller (MCU). This is used to convert the strain sensor output which is the variation of resistance into a digital value. The STM32 device is based on the high-performance Arm Cortex-M4 32-bit RISC core, which operates at a frequency of up to 84 MHz. It also implements a full set of DSP (digital signal processor) instructions and a memory protection unit which enhances application security. The HC-08 Bluetooth serial communication module is based on V4.0 BLE Bluetooth protocol signal transmission module. The module connects to the MCU such that when the module is connected to a MCU with a power supply system of 3.3 V the MCU’s RXD is connected to the bluetooth module’s TXD and vice versa. Connection to the computer is via a bluetooth dongle.
The indices measured by the system were selected based on common pneumography indicators cited in literature. Pneumography is the generic term for any device that records respiratory excursions from movements on the body surface. The indicators used include RC measured in cycles per minute (cpm), RR measured in respiration per minute (rpm), inspiratory duty cycle (DTCY) measured in percent (%), BV likened to tidal volume (VT), and moment ventilation (MV) likened to minute ventilation (VE) in standard spirometry. BV and MV are modeled quantities and not synchronized standard into spirometry units. In their current form, their units are in ohms (Ω) and ohms/min (Ω/min) respectively.
Pneumographic-based respiration measuring devices tend to base the units of the respiratory volumes on the underlining theories or technologies; for example, resistive and piezoresistive-based sensors were labeled in ohms while others like BiopacTM respiration sensor were labeled in volts (µⅤ). 19 Other study reports such as impedance pneumographic, accelerometer device-based ones, and so on simply resort to arbitrary units (AUs). 20 , 21 Some attempts have however been made to synchronize them with other clinical respiration measuring devices. 16
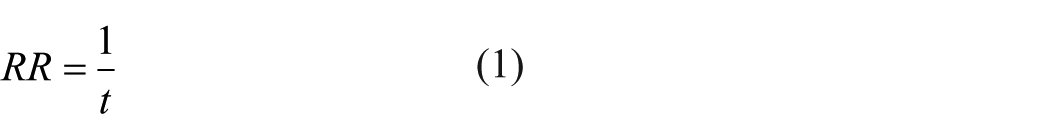
Breathing or respiratory cycle defines the time taken from the commencement of inspiration to the ending of expiration. RC was computed by counting the number of times the chest rose in a minute of testing and was correlated with the number of peaks recorded in the respiration pattern per minute (Figure 3). RR was measured via dividing 1 sec by the respiratory time (t), that is, time between successive RCs expressed as

Computation modes of selected respiration indices.
The volume of gas inhaled or exhaled during the RC is referred to as the breath volume (BV). BV is synonymous with VT measured in standard spirometry using the spirometer. In this study, the BV is calculated using the following formula

where ∅ denotes real numbers on a given respiratory wave and points
Respiratory or breath volume describes the volume of gas inhaled or exhaled from a person’s lungs per minute. It is an important parameter in respiratory medicine due to its relationship with blood carbon dioxide levels. An increase in RR or BV causes an increase in MV. MV was also calculated by

DTCY defines the ratio of inspiration to the total RC (TI/Ttot), and this can be closely related with airflow 22 in and out of the lungs. In other words, it measures the inspiratory effort over the total respiration and is expressed as

where TI is the inspiration time, TE is the expiration time, and Ttot is the total respiratory time. The DTCY is an important quantitative indicator for estimating the consistency of the RC. Increased DTCY can actually compensate for partial airway obstruction. The duty cycle value at rest is approximately a third of the entire RC. 23 Clinically, low values are therefore important indicators for obstructive sleep apnea susceptibility. However, individuals with comparatively lower RRs tend to have a lower duty cycle as opposed to those with higher rates. Physical activity also increases the DTCY. This therefore suggests that DTCY values cannot be analyzed in isolation and must be posited with the respiration pattern under study.
The test interface is presented in Figure 4; it entails a panel to enter name and age of the user, and signal display range and the resistance of the sensor. Also shown are a start button, pause/resume button and a replay button. The replay button when clicked replays the latest test result which is automatically recorded. All five respiration indicators are shown below the displayed pattern. The interface software program apart from graphic display also automatically saves the original digitized signals and the derived parameters in an excel format strip-chart.

Test system interface.
This can be accessed for further analysis after experimentation. The electronic processing box processes sensory signals according to stored instructions in its memory, that is, inherent software setting and through input commands provided by the user via the user interface.
Study population characteristics
Respiration measurements of volunteers of no known respiratory health conditions were recorded. The population characteristics are as follows.
A total of 20 volunteers from Asian and African extraction spanning nine countries who are all students of Jiangnan University have taken part in the test; 50% are males and 50% are females; 45% are Asians and 55% are Africans. Table 1 shows the detail demographics of the volunteers.
Detail demographics of users.

Testing procedures
The length of the conductive section was measured before and after being worn by the user. This was done to ensure that tightness is even for all users irrespective of body size by tightening the band for slimmer users while loosening for more-built users. Smart band was strapped around the chest of the user and the measurement of the conductive section retaken to ascertain the magnitude of extension after wearing. The user was asked to stand still for “standing” wear test to begin. Some users opted to play games on their mobile phones during the standing test. After 3 min, the next test condition followed by allowing the user to sit down for the same length of time. During the “reading” test, a user was presented with a text to read out at a reasonable audible tone. Chinese users were given mandarin content while the rest of the users from the various nationalities read in English. Physical activity tests were conducted in the school’s gym while the user trained on some gym equipments. Selected users were tested 3 times in a day—morning, afternoon, and evening—to ascertain whether test times have influence on the results.
Results and discussions
Respiration results of all volunteers or users are presented. Standing and sitting patterns recorded are identical to the patterns of commercial respiration systems such as Vernier’s Go Direct Respiration Belt, 24 1132 Pneumotrace II™ piezo-electric respiration transducer, 25 and pneumatic respiratory belt SS5LB (BiopacTM Systems, Inc., Goleta, California, USA). 26 Even though some patterns contained some level of noise, signal stability level is very high compared to some other prototype sensors published in literature. This is because after ADC sampling of signals to generate digital signals, digital signals are then filtered to eliminate unwanted artifacts generated by the sensors and sensing the environment. Subsequently, an average filter has been applied during the interface design to smoothen out the digital signal to preserve its original profile as much as possible. Several parameters that affect respiration have been discussed.
Impact of standing, sitting posture, and reading activity
Figures 5 and 6 present respiration patterns of users during standing, sitting, and reading tests. Reading activity patterns are also identical with patterns adduced by some voice-recording sensors. 27 There were recorded cases of apnea as shown in Figure 5, user#2 (standing and sitting pattern). One user (user#18) with habitual intermittent deep breathing was also recorded as shown in Figure 5 (standing and sitting pattern).

Respiration patterns of female users adduced during standing, sitting postures, and reading activities.

Respiration patterns of male users adduced during standing, sitting postures, and reading activities.
Two main standing and sitting posture breath-pattern characteristics have been identified, namely fast inhalation and exhalation time patterns and fast inhalation and slow exhalation time patterns. Clinically the former is ideal, such that the inspiration duty cycle of a single breath cycle should be one third of the total. Several research reports based on pneumography have confirmed that posture influenced the various respiration indicators. 24 , 25 Result of this study did not deviate from these research findings.
Between the standing and the sitting postures studied, standing posture tend to have produced higher values. Increased lung volumes of subjects or users in standing position compared to other positions can be attributed to an increase in the volume of the chest cavity. 28
Reading activity however presented quite distinct patterns compared to both standing and sitting postures. The patterns are similar to those obtained using respitrace in a study and how speech production changes when people move. 29 This is in congruence with the assertion by Coyle et al. 30 that speaking episode, one of the most frequent types of physical activity and behavior, can alter a variety of physiological systems including breathing. The results of the reading activity thus hint of the possibility of using this sensor for researches in the area of speech production and speech perception and adaptation of breathing during the perception of speech. 27
Even though clinically none of the tested volunteers presented results beyond allowable ranges as shown in Table 3, for the purpose of comparing the influence of posture on the results, RC and RR values in the range of 21–25 were designated as high. Overall, results point out that 50% of the population had higher standing RC values, while 20% was recorded for sitting and 30% for reading respectively. In terms of RR, 30% of the population had higher standing values, 20% for sitting, 45% for reading, and 5% equal for standing and sitting. These results confirm that posture impacts on respiration dynamics.
Impact of gender
The test indices based on gender were similar however; male users generally presented higher indicators compared to their female counterparts as shown in Table 1, a conclusion drawn by many researchers. 6 , 31 This is based on the supposition that the lung capacity is dependent on the size of a body and/or lung and that for a man and a woman of similar body size, the woman tend to comparatively have a smaller rib cage cross-section area. 32 Therefore, lung volume of an adult female is typically 10%–12% lower than that of a male having the same height and age. 32 A disproportionate growth of the lower limbs has been suggested to account for the difference in lung size between males and females who have the same stature. 33
Romei et al. 34 however contend that the influence of gender on chest wall kinematics is still controversial as there is no clear and consistent pattern of dominance and results tend to vary based on individual differences. They reported that variations in rib cage dimensions during breathing were not significantly different between male and female subjects but with very few exceptions, 34 a result similar to those obtained in this study as shown in Table 3. African male values against their female values were higher for all the indices except standing MV. For the Asia users, on the other hand, the males presented higher values except for sitting BV.
Impact of ethnicity
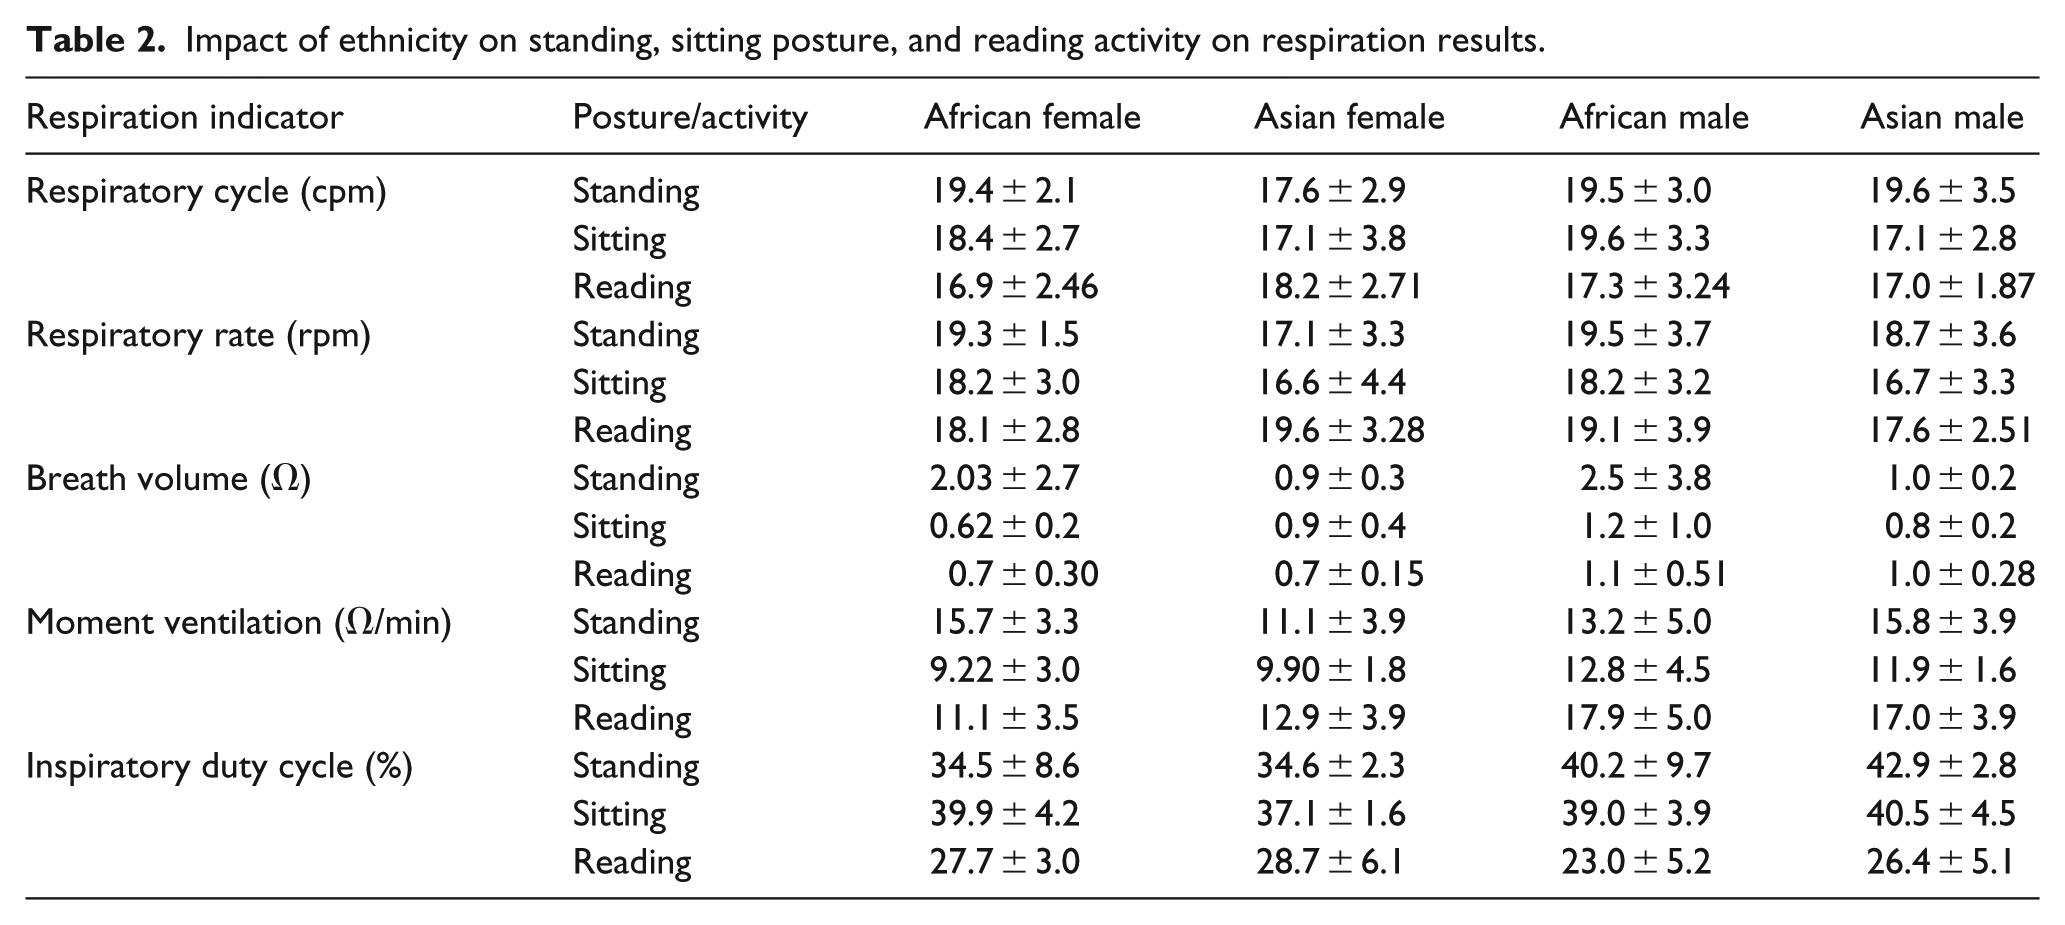
Several studies have been conducted and published on the impact of race or ethnicity on lung function or respiration indicators using different types of instruments. Researchers, however, suggest that other factors such as anthropometric, socioeconomic, nutritional, and environmental play a role in the race difference experimental results. 35 Harik-Khan et al. 35 however after analyzing the effect of these factors conclude respiration or lung function is to a large extent influenced by physique and to a much lesser extent on those other conditions. In this study, it has been gathered that apart from standing and sitting posture RR and BV where the values for Asian males were comparatively lower, they had a slightly higher RC, MV, and DTCY values compared to their African counterparts.
The African female standing and sitting posture results dominated their Asian counterparts except DTCY values as shown in Table 2. Reading values were not paired in this manner as the languages were completely different. The reason for the general differences in respiration results of the population studied is not readily known. It might as well be due to the individual respiratory capacities of the users. However, according to Whittaker et al., 36 attributing racial differences in respiratory capacities to differences in inspiratory muscle strength is still speculative. Even though in their earlier studies, they alluded to this conjecturing. Standing and sitting posture results are analyzed here as both postures tend to influence the results. According to Hsi et al., 37 anthropometric differences in results can be eliminated by sticking to sitting posture–measured heights as the baseline parameter.
Impact of ethnicity on standing, sitting posture, and reading activity on respiration results.
Biometric applicability of patterns
Each pattern recorded showed ample evidence of individuality, and based on the physiology of the users. Comparatively short users with body mass index (BMI) around the 20s tend to produce high RRs with low volumes. Conversely, bigger and taller users produce fewer cycles but higher volumes. The individuality of the patterns is an indication of respiratory pattern qualifying for consideration as a biometric feature. Biometrics refers to the measurement and statistical analysis of people’s unique physical and behavioral characteristics. Over the years, biometrics has become increasingly sophisticated, and has developed to be one of the favorite technologies for both businesses and security agencies.
As a step to give more credence to this supposition, three users from the population were selected and tested consistently for 7 days. As can be seen from Figure 7, the three users have distinct breath patterns. User#1 and user#3 showed identical inhalation cycles and comparatively longer exhalation cycles. Between exhalation and the subsequent inhalation, there is what is referred in spirometry as a resting phase (Figure 7(b); user#1 and user#3). The inhalation and exhalation cycles of user#19 are visibly steep without any rest period within, thereby showing identical inhalation and exhalation cycles.

Standing posture respiration patterns of three users measured over 7-day period compared: (a) user#1, (b) user#3, and (c) user#19.
Their individual breathing rates and volumes are also distinctively different and are influenced by their physical attributes. As shown in Table 3, user#1 who is shorter (height: 1.57 m and weight: 48 kg) among the three had very high respiratory rate and cycles. As expected, the duty cycles were also very high. User#19 (height: 1.83 m and weight: 77 kg)—a male even though had shorter exhalation cycles, his respiratory cycles and rates were however lower than user#1 due to his taller and heavier stature. His BV values were also comparatively higher.
Averaged results of three users adduced over a 7-day period.

RR: relative risk; BV: breath volume; MV: moment ventilation.
User#19 and user#1 both had higher DTCY; these values are influenced by different parameters for both users. For user#1, it is due to the corresponding high RC and RR but for user#19, it is influenced by the shape of his breath pattern and steep inhalation and exhalation wave cycles without rest periods before successive inhalation. User#3, a female (height: 1.70 m and weight: 60 kg), had the least respiratory cycles, rates, and DTCY as shown in Table 3. User#3’s reduced RC and RR stem from her much bigger stature compared to user#1. Also user#3’s DTCY is obviously influence by a comparatively longer rest period within successive exhalations. In the estimation of this study, combining the respiratory pattern, the RR, and the duty cycle can therefore serve as credible features for biometric identification. Further studies are however warranted to test the feasibility of this recommendation.
The influence of age has been ignored because of the similarity in age of the users, as users within the ages tested are known to possess similar respiration traits. 38 Sharma and Goodwin 38 reports that lungs undergo a phase of growth and maturation during the first 20 years of an individual’s life and achieve optimal lung function around 20 years of age in females and 25 years in males. It remains steady with very minimal change from age 20 to 35 years before it begins to decline. In all, 80% of the user population is between 23 and 29 years of age as shown in Table 1. Subsequent analysis based on the influence of physical activity was carried out.
Impact of physical activity
Comparison of respiration indices under physical activity was done. This is because during physical exercise, the muscles are strained beyond normal and calories are burnt. The muscles tend to require more oxygen than they normally use to burn these extra calories.
The blood picks up oxygen as it circulates through the lungs and delivers it to the active muscles during exercise. As the level of physical activity intensifies, so is the RR permitting more oxygen into the lungs. This is to enable the lungs to, in turn, pump more oxygen into the blood stream and out to the muscles.
Figure 8 presents test signals of users under different physical activity conditions. As can be seen, the signals are comparatively noisy but good enough to measure breathing while indoor walking, jogging, and riding a stationary bike. Figure 9 shows the image of respiration being measured of a volunteer undertaking physical exercise. In electronics, noise is an unwanted disturbance in an electrical signal. The incidence of these noises from physical activity tests arises partly from body movements that are associated with these forms of exercises and the sensor’s inherent induced noise.

Comparison of test patterns under different physical activity conditions: (a) riding a stationary or indoor bike, (b) indoor walking activity respiration pattern, (c) jogging on an elliptical cross trainer, (d) after jogging on an elliptical cross trainer, (e) training on the pec deck machine, and (f) after training on the pec deck machine.

Respiration measurements while user is engaged in physical activity.
BV values as well as other qualitative values were very difficult to ascertain due to the noisy signals. This therefore means that qualitative measurement of respiration during physical activity using the belt is hindered. However, quantitative indices such as RC and RR are to a large extent measurable. To make up for noisy signals during exercise, respiration measurements were carried out immediately after exercise. The RR is known to remain faster and deeper than normal for up to 40 min after an intense exercise has been completed.
However, after a regular aerobic fitness exercise, RR tends to return to normal levels within 10 min. Figure 8(d) and (f) which were measurements taken immediately after their corresponding exercises however shown clearer signals. The results showed high values confirming increased breathing levels after every physical activity. Normal breathing rate at rest for an adult is 12–20 breaths per minute; however, intense exercise may increase the breathing rate up to 40 or 50 breaths per minute.
The intensity of the exercise also clearly shows in the results obtained during and after the exercise. Even though training on the elliptical cross trainer produced higher values compared to one adduced during training on pec deck machine, the more muscular exertion experienced during training on the pec deck machine after training produces higher results compared to the ones for training on the elliptical cross trainer as shown in Figure 8(d) and (f) respectively. Table 4 shows the results obtained during and after the various exercises. (Due to user availability constraints, walking test was undertaken by user#3 while the other exercises were done by user#13; Table 4 shows their average sedentary condition results for comparison.)
Test results under different physical activity conditions.

RR: relative risk; BV: breath volume; MV: moment ventilation.
Impact of test periods—morning, afternoon, and evening
The impact of test times on the respiration indicators was evaluated, by testing the respiration of three users in the morning, afternoon, and evenings. Again the pattern of results showed much individuality than following a particular pattern for all three selected users.
User#3 however presented consistent pattern for all the indices except for MV and BV where afternoon values tend to be higher compared to both morning and evening as shown in Figure 10. User#3 and user#13 had similar patterns for RC and RR results. There was no clear pattern of influence of test time on the results. User#19 had a step pattern of results (low morning, higher afternoon, and highest at evening) for all except for DTCY where evening result was lowest.

Test results for different times in the day.
Impact of weight and height
Both ethnicities showed similar responses to the influence of body height and weight on the respiration results; that is, there is no clear correlation between all users’ respiration patterns, their height, and weight as individual differences tend to cloud the findings. However, the correlation between height relative to RC and rate is that, regardless of gender or ethnicity, tallest users produced the highest values as Figure 11(a).

Scatter plots of respiration indices: (a) RC/height; (b) RC/weight; (c) RC/BMI; (d) BV/BMI; (e) MV/BMI; and (f) DTCY/BMI of male and female users.
Heaviest male users on the other hand also produced highest RCs (Figure 11(b)). BMI was calculated for all users to holistically capture the two parameters and use them for subsequent analysis. Three females and a male out of the 20 users showed results of over-weight and one female under-weight.
None of the subjects or users tested was obese and as the results show, there was no clear pattern of decline in respiration results based on BMI. Per the BMI characteristics of the users, the results obtained are consistent as according to Littleton; 39 clinically, poor respiration results due to obesity is only significant in highly obese patients. In a study of 373 patients for lung function testing who had normal values for airway function but a wide range of BMIs, the effect of BMI was only apparent in patients with BMIs >30, 40 a BMI level non-existent in our study population.
Device repeatability and aging
The device was tested over a total of 67-day period spanning over 1230 tests. Within the period, the device was able to satisfactorily test user’s respiration without any significant deterioration in result response as shown in Figure 12.

Comparison of RC and BV results over time.
Drawbacks and limitations
Three forms of noise affected the smooth application of the system, namely motion-induced noise, user appearance–induced noise, and sensor intrinsic noise. The motion-induced noise was minimal in sedentary tests as expected, but sensor intrinsic noise was apparent in some circumstances. User appearance–induced noise stemmed from the outfit that the user wore during the test; some apparels affected belt stability resulting in noisy signals. However, when belts were worn by users wearing singlets or tight-fitting t-shirts, the incidence of user appearance noise was reduced significantly. A combination of all three was responsible for the higher noise levels in physical activity test results.
Conclusion
The study demonstrates a successful but simplified and economic way to measure respiration outside the hospital environment. The device has been largely successful in measuring breathing indicators of users. Results patterns show good agreement with studies done in other parts of the world using similar technologies and instrument such as the Go Direct Respiration Belt, RIP sensors, and so on.
Distinctions exist between respiration patterns recorded under different activities. Patterns recorded during reading show distinct patterns compared to standing and sitting breath patterns. Physical activity RCs and rates also increased compared to sedentary ones, an occurrence grounded on the science of metabolism.
Even though male users generally are known to present higher indicators compared to their female counterparts, there has not been any significant differences in the results of this study. Also, there was no clear impact of ethnicity on results and so we contend that the differences showed are as a result of individual respiration capacities of the population studied.
Individuality and the repeatability of breath patterns and indices recorded justify the recommendation of breath pattern as a biometric feature.
There was no recognizable difference in test patterns conducted at different times within the day. The test repeatability of the device over a total of 67-day period spanning over 1230 tests was also satisfactory. Even though initial resistance kept fluctuating over time, it had no detectable adverse impact on the results.
Footnotes
Declaration of conflicting interests
The author(s) declared no potential conflicts of interest with respect to the research, authorship, and/or publication of this article.
Funding
The author(s) disclosed receipt of the following financial support for the research, authorship, and/or publication of this article: The authors acknowledge the financial support of the Science Foundation of Jiangsu Province (BK20151129) and Fundamental Research Funds for the Central Universities (JUSRP51727A).