
Abstract
While many of the factors influencing strain sensor properties have been explained in literature, other very important parameters that influence actual design performance of sensors remain obscure. This paper investigates the impact of conductive profile and area design including post fabric treatments such as dyeing and washing on sensor performance. 1 × 1 mock rib was the fabric structure of choice, and silver-plaited nylon was the conductive yarn used in knitting all the samples. Six main polygonal shapes including ellipse, diamond shape, corrugated rectangular shape, rectangular horse shoe, rectangular dough roller shape, and plain rectangular shape were designed and knitted. Plain rectangular profile has been found to deliver the best results characterized by noiseless signals, highest gauge factor, and good result repeatability. The analysis of results also reveals a positive linear correlation between conductive path and initial electrical resistance of a sensor. The inverse is true for the relation between the conductive width values and their corresponding initial resistances. Higher conductive widths led to low initial resistance, and values less than 20 Ω for a sensor could lead to inferior sensor sensitivity. High conductive paths produced high initial resistances, and values within the range of 40–120 Ω could deliver higher sensitivity. This study thus concludes that the optimum aspect ratio range for conductive area to deliver satisfactory sensitivity results is approximately between 24:1 and 77:1 cm. Laundry and dyeing have also been found to result in reduced sensor dimensions, resistance, and sensitivity levels.
Introduction
Strain sensor research is an area that has been tackled by a number of researchers around the globe. Several textile techniques have been used in the design and manufacture of these sensors, and they include knitting [1], weaving [2], braiding [3], and film/composite based [4]. Textile decoration or ornamentation methods such as stitching (overlock, embroidery) [5–7], printing, and coating/bonding/pasting [8] are also applied.
The focus has been to embed sensitive material within a textile structure and then subject this material to stress. Sensitivity response is obtained by measuring the magnitude of deformation relative to change in the property of the sensitive material. Several theories such as Fresnel reflection—fiber Bragg grating [9], piezotronic, photoelastic, and conductivity-related properties such as piezoresistance [10], piezoelectricity [11], capacitance [12], and inductance [13] have been harnessed in developing these types of sensors. However, conductivity-related properties have been the most common. The areas of strain sensor applications have been physiologic parameter estimation [14], robotics [15], structural integrity assessment [9], gait analysis, physical activity tracking [16], and motor rehabilitation analysis [17].
Various factors have been acknowledged to affect the operation and functioning of these sensors. These include but not limited to the type of fabric structure, yarn type (both conductive [18] and non-conductive or elastic yarn type), stress magnitude [19], and effect of temperature. Influence of loop deformation-related resistance and inter-loop contact resistance of silver-coated yarns has been reported by Li et al. [20]. Even though there is no consensus on the choicest fabric structure, there is agreement between Atalay et al. [21] and Qureshi et al. [22] on the suitability of interlock fabric structure. 1 × 1 rib (mock rib) has also been the best among the rib family of weft knits according to Yan [23] and Raji et al. [24]. Plain structures have however been the most widely experimented knit structure probably due to its extensive application in apparel knitting. The search for the optimum conductive yarn however rages on; nonetheless, in the absence of a perfect yarn, silver-plated nylon or polyester continues to dominate in research reports and even commercial applications.
Notwithstanding these rather copious parameters that have been found to affect the sensitivity response and already been researched and reported on, other outstanding design and application parameters are still yet to be ascertained. It is speculated that the conductive characteristics of silver-plaited yarns could be affected by washing, dyeing, and even storage. However, there has not been any experimental work published to substantiate this.
The influence of conductive width (CDW) and the length of conductive path (CDP) still remain unaccounted for. The conductive profile is useful when considering the aesthetic effect of the final product in some cases, since it occupies a distinct zone. Conductive area (CDA) is also important in determining the cost factor as it determines the quantum of the usually more expensive conductive yarn required for sensor design. However, determination of which profile and size of CDA could deliver the best aesthetic appeal must be based on sensor performance, and so far, no research report has been cited on these parameters.
This research report therefore in an attempt to comprehensively address the enlisted issues pertaining to strain sensor research undertook series of experiments. These findings seek to provide additional direction on what negative influencing parameters or conditions could be identified and eliminated or minimized while on the other hand maximizing the positive ones to produce a robust textile strain sensor.
Experimental
This section deals with materials and methods used in the sample fabrication, the samples so produced, and a series of tests that have been carried out to analyze the enlisted conditions and parameters that affect sensor performance.
Materials
Textile structure (1 × 1 mock rib) was designed using Photon and Digraph 3 software (Dinema S.P.A Lonati group, Italy). Knitting machine used for samples is Santoni’s SM8-TOP2 (Santoni SPA, Italy), gauge number: E28, number of feeds: 8F, diameter 15 in. The yarns used include nylon-covered Spandex, elastane, silver-plated nylon, and polyamide DTY. The knitted samples were dyed with acid dye using the Osci Color-Oscillating Dyeing Machine by Xiamen Rapid Precision Co. Ltd. An Aux mini washing machine, Aux Group of companies, Ningbo, China was used. Piezoresistance tests were carried out using Ningbo Kewei multi-functional electronic fabric strength testing machine (Ningbo Kewei Textile Instrument Company Ltd, PRC). Victor Digital Earth Tester (Shenzhen Victor Hi-Tech Co., Ltd, PRC) and custom-made electronic testing system (Processing box and KTC Piezosens interface) were used as electrical signal processors. The main hardware components are an ARM Cortex-M3 STM32F401RCT6 core board, a designed power supply, and signal acquisition circuit, a USB serial connection to a PC.
Methods
Sample design and fabrication
The choice of this structure is mainly based on the premise that 1 × 1 rib possesses an unusually high degree of elasticity when stretched in the coursewise direction. Also, the choice is partly influenced by the broad project being undertaken, which is a smart bra with respiration sensing capability. Per the design of the bra, the sensing part will be situated on the band of the bra which is usually rib knitted. In our previous study [24], four rib structures were experimented on, and the conclusion was that 1 × 1 mock rib is most suitable for our project. In producing the samples, yarn finger 2 on all eight feeds were fed with Nylon-covered Spandex. Yarn finger 5 was also fed with polyamide DTY on all eight feeds. Two feeds (feeds 2 and 6) on the machine had elastane yarns which were specifically used in securing the hem of the cuffs or bands. On these two feeds only, yarn finger 3 was fed with this elastane yarn for the sole duty of stitching the hem of the band. Plated silver conductive yarn was fed to yarn finger 8 on all eight feeds. The Cam setting which determines the stitch density (SD) was set at N25, a SD that is usually used for under garments. 1 × 1 mock rib structure was used for knitting all the samples.
In any case, the conductive section must occupy a defined area and has a consistent link to ensure signal propagation.
Figure 1 shows the images of different strain sensors with their conductive profiles. Six main polygonal shapes with differing areas were designed and fabricated in triplicates. The shapes were selected based on aesthetic considerations. Figure 2 shows the magnified image of the structure showing the conductive yarn and non-conductive yarns embedded therein.
Strain sensor samples showing different conductive profiles. Magnified images of 1 × 1 mock rib. (a) Front view. (b) Back view.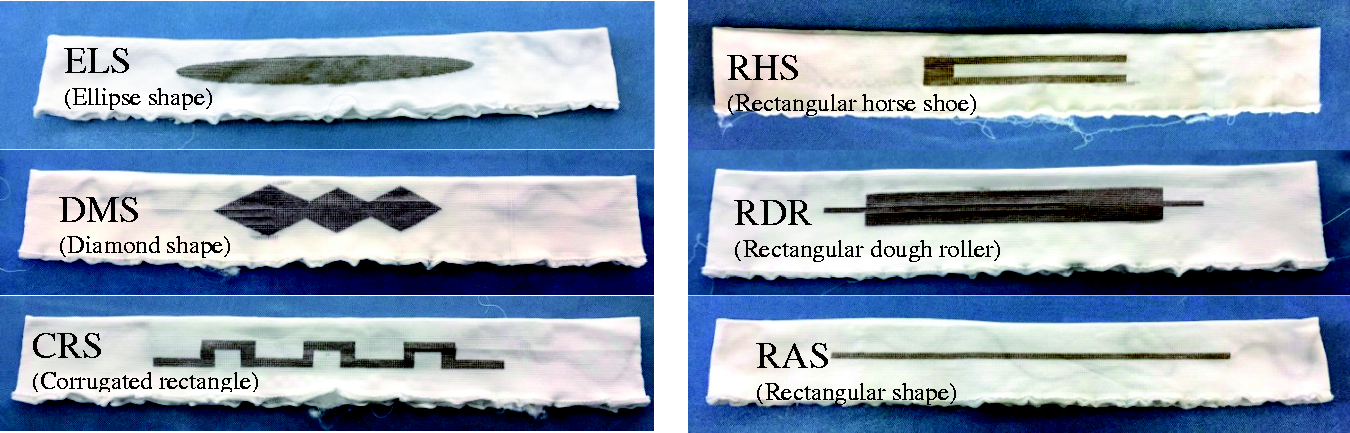

Count and conductive properties of yarns.

Electromechanical test systems and software
Two main electrical resistance measurements were carried out on the samples namely stationary electrical resistance and piezoresistance or electromechanical tests. In testing the initial resistance of samples in non-tensile (stationary) tests, the digital earth tester was used. To ensure convenience in testing and to maintain signal integrity, the samples were connected with a 30 awg (American wire gauge) wire of 24 cm in length, secured with press studs as shown in Figure 5, and then clipped with alligator clips plugged in from the Earth Tester to test their stationary electrical resistance. With the electromechanical tests, however, the samples were clamped firmly onto the fabric tensile tester; the wires were connected to a plug and plugged into the processing box. Figure 3 shows the scheme of experimental setup. Two main types of tensile tests were carried out namely uniaxial stretch-recovery and cyclic tests.
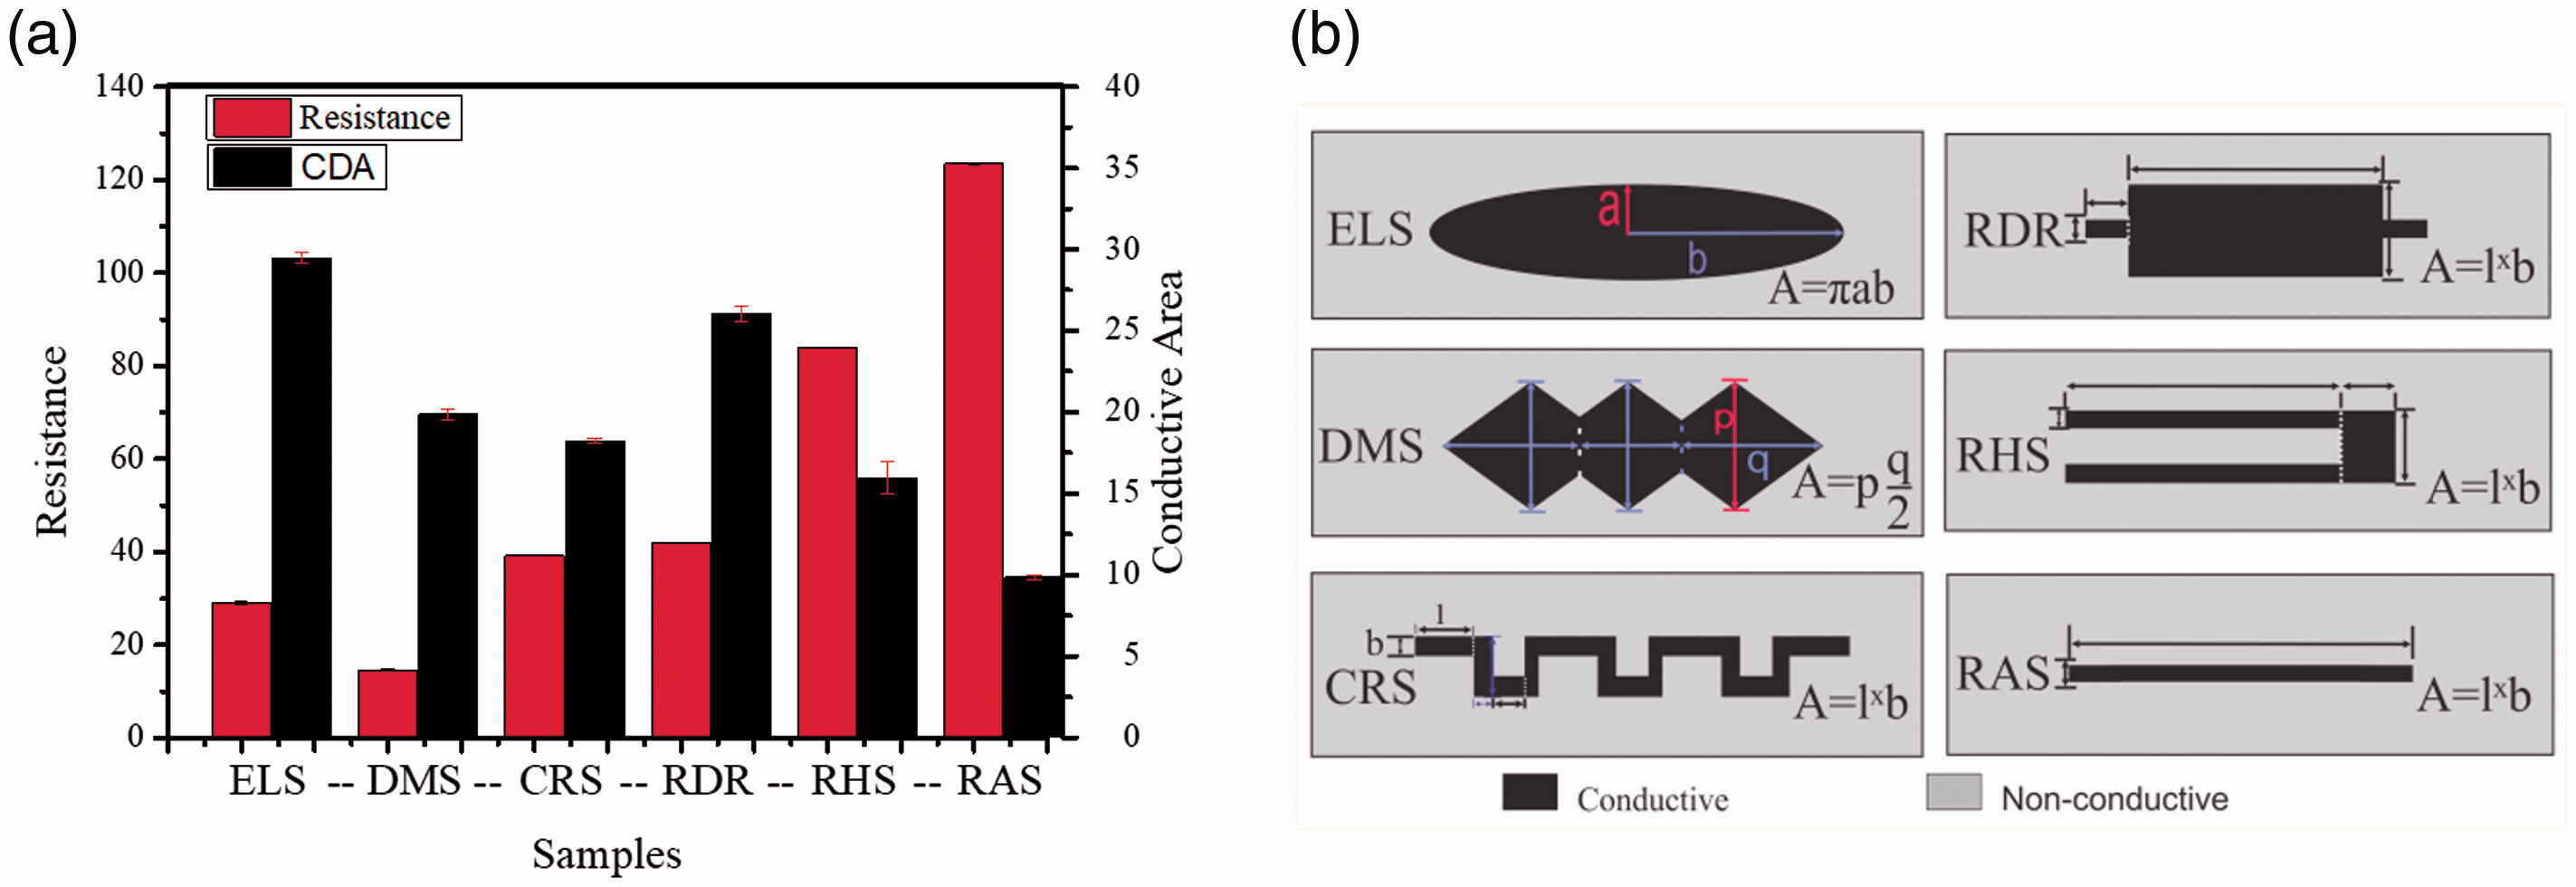
Test set up for piezoresistance or electro-mechanical measurements. (a) Correlation between CDA and resistance of samples; (b) methods of CDA computations.
Cyclic uniaxial tensile tests were carried out on the samples. The electromechanical property of the sensors as explained in a previous study [24] is based on the separation of the knitted loops which hitherto were compact in their unstretched states as can be seen in Figure 4. It is more obvious between 40 and 100% stress magnitudes.
Depiction of loop configuration under various magnitudes of stress.
The increase in resistance otherwise referred to as the sensitivity is therefore based on a combination of the increase in the CDP as the loops are relaxed, and the disruption of the intra yarn contacts within the fabric structure. A withdrawal of the stress thus allows the sensor to recover its initial contacts, loop lengths, and configurations and therefore a restoration of initial resistance.
ASTM D 4964 standard test specification was followed. There were four load–unload cycles of deformation to a fixed strain level of 20% and at a tensile speed of 500 mm/s. Gauge length was 300 mm. The connected wires were secured by stitching with a conductive yarn. This is because minute frictions between the wire and the fabric’s conductive surface at the connection points resulted in noisy signals. This therefore points to the effect that one cause of noisy signal is unstable test probe connection.
Dyeing of samples
Dyeing essentially is the application of color to materials. Piece dyeing which describes the application of dye to specified lengths of fabrics or apparels provides a cheaper means of obtaining different color varieties for short run-knitted goods. However, since dyes contain several chemical agents, it is not certain what subjecting the sensor to dyeing will result. Selected samples were thus dyed to ascertain the effect of dyeing on the electromechanically properties.
The following are the proportions: acid dye stuff 0.3–0.5% owf (on-weight-fabric), ammonium sulfate: 2 g/L, bath ratio: 3:1, sodium sulphate: 1 g/L, and acetic acid: 0.5–1 g/L. The samples were placed in a conical flask and filled with water and then fixed into the slots in the dyeing machine. The temperature was raised to about 70℃ and retained for 20 min. This was done to ensure good dye take up. Sodium sulfate was then introduced, followed by gradual introduction of ammonium sulfate and then the dye stuff (yellow). The temperature was subsequently increased to about 90℃. Acetic acid was gradually introduced into the bath, and temperature was further increased to 97℃ and retained for 30 min. The bath was allowed to cool down to about 70℃ to complete the process. The samples were taken out, rinsed several times to get rid of excess dye, and drip dried.
Washing of samples
Laundry of the sensor is thus inevitable during use, and as such, wash test is imperative. The rotation of washing bath that induces liquid flow to generate mechanical actions such as deformation and scouring of textiles to remove the dirt [26] is suspected to affect the conductivity but as to what extent. Additionally, the chemical effect of detergent loosening the dirt from textile surfaces, mechanical actions by the washing bath [27] therefore need to be investigated to ascertain the influence on its performance.
Laundry test was carried out based on ISO 6330:2012, textiles—domestic washing and drying procedures for textile testing. Three test specimens were washed in an Aux mini washing machine, Aux Group of companies, Ningbo, China. The washing machine falls in the category of vertical axis, top-loading agitator type. A popular detergent, Tide washing powder (lemon scented), was used. The total mass of specimen was 36.5 g. Twenty-seven grams of washing powder was used to provide enough running suds. Since the capacity of the washing machine was small, no loading fabrics were used. Samples were subjected to three rounds of washing. In the first round, they were washed three times, second round was 10 times, and the third round was seven times adding up to a total of 20 wash times at 10 min each. After rinsing and hydro extraction, the samples were drip line dried and subsequently tested for their post-laundry performance after each round.
Effect of aging
The ability the sensors to consistently replicate the same output signal for repeated application of the same value of the measurand over a period was measured. The sensors performance after 27 days period was compared to ascertain the impact of aging on sensor sensitivity to ascertain the sensor’s stability after prolonged use.
Results and discussions
CDA and resistance relationships
Knit loops within the fabric structure in the course and wale directions have dissimilar orientations. The CDP and signal links of the sensor are akin to a conductive or resistive circuit [28]. An electric circuit is essentially a conducting path, external to a power source, which allows charge to flow from one terminal to the other. In the course-wise direction, it can be likened to series and parallel circuit in the wale-wise direction. A series circuit is a closed circuit in which the current follows one path, as opposed to a parallel circuit where the circuit is divided into two or multiple paths. When a number of resistors are connected in series, the total resistance in the circuit is obtained by adding the individual resistances. However, unlike the series circuit connection, the total resistance in a parallel circuit is derived using the reciprocal of the individual resistance. All the same due to the nature of the textile structures, it is not possible to have a wholly series circuit if the conductive courses are more than one. It can therefore be classified as series-parallel circuit which is a combination of series circuits with parallel circuits. Generally, the total resistance in such instances can be computed by first identifying connections that are in parallel or are in series and calculating the total parallel resistance and adding it to the series resistance.
Even though the conductive circuits consist of both series and parallel circuits, the wale-wise direction is dominated by parallel resistance circuits or connections as sand the course-wise direction by series circuits. The impact of the minority circuits in each case can therefore be ignored. All of the samples designed have their CDPs oriented in the course-wise directions. The samples tested for the effects of their shapes and CDAs were characterized before subjecting them to tensile and other tests. Figure 5(b) shows the methods used in computing the CDA values.
Figure 5(a) shows the CDA results and their relationships with the resistance values. The area computations confirm that larger CDA results in lower resistance values and vice versa. However, CDA computations were not used for comparison because of the overriding influence of varied CDPs of the six samples. Also, the CDA as a parameter is influenced by changes in either or both the CDP and CDW which proffers different qualities to the sensor. For instance, if the increase in CDA is caused by an increase in the CDP, the effective resistance will increase. In the other way round, if it is caused by an increase in CDW, the resistance will reduce. Isolating these two parameters and using them as basis for comparison therefore makes sense since all the six shapes have different lengths and obviously different profiles.
The CDA can only be used as a basis for comparison if all the shapes being compared are the same. CDP and CDW were thus used as basis for comparison. CDP is the measure of the probe distance or connection test points on the samples (Figure 6). The CDW on the other hand is the measure of the vertical dimension or height of the sample’s conductive shape (Figure 6).
Sample strain sensor showing CDP, CDW, and wire connection.
These twin relationships established in this study define the conductive and performance characteristics of the sensors. They are the CDP which is identical with the series descriptive property whilst the CDW and the parallel descriptive property are also similar on the other hand. This therefore means that the CDP and the effective resistance have a proportional relationship and an inverse proportional relationship with the CDW.
Figure 7(a) shows relationships between the CDW and the effective resistance of the sensors. Figure 7(b) also shows the relationships between the CDP and the resistance of the sensors—ELS, diamond shape (DMS), corrugated rectangular shape (CRS), rectangular dough roller shape (RDR), and rectangular horse shoe (RHS).
(a) Correlation between CDP and resistance of samples; (b) correlation between CDW and resistance of sensor samples.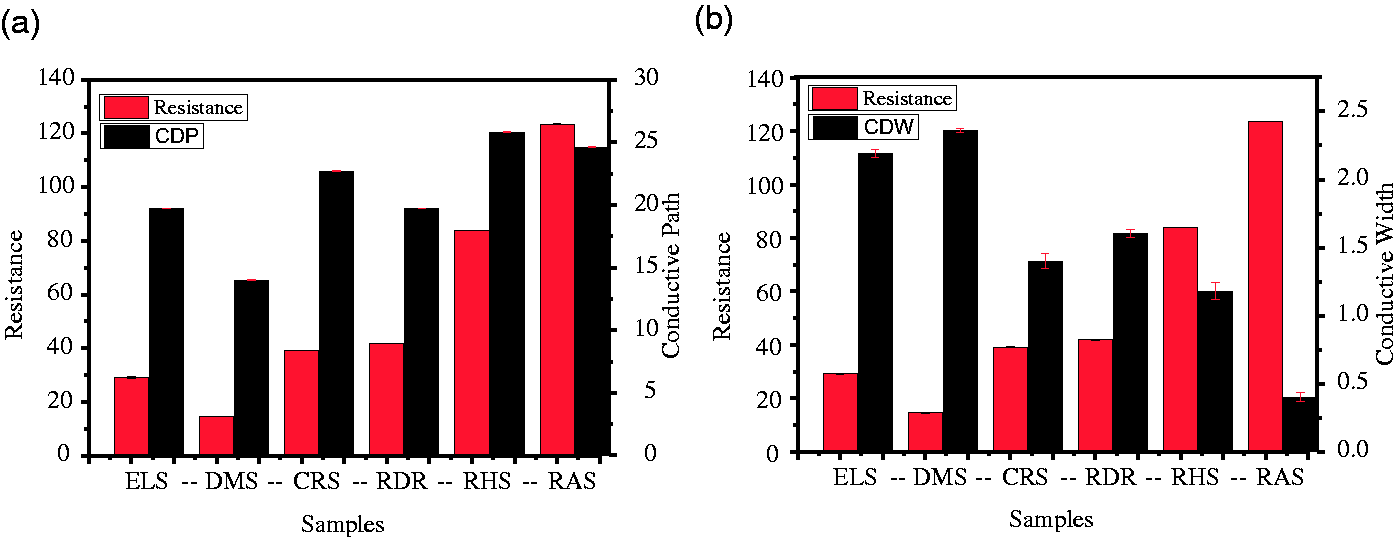
A strain sensor with a high length to width ratio will effectively have a high electrical resistance due to the dominance of series circuits within the structure. Conversely, resistance has inverse proportional relations with a high CDW. Per these relations, a sample with high width to length ratio will produce a low initial resistance due to the dominance of parallel circuits within the structure or vice versa.
Electro-mechanical tensile sensitivity and linearity of sensors Ω
The sensitivity of the sensors was estimated by using the classical gauge factor (GF) index expressed as
(a) Cyclic response of ELS samples; (b) DMS samples; (c) CRS samples; (d) RDR samples; (e) RHS samples; (f) RAS samples.

Complex-shaped samples such as DMS and RHS delivered poor result repeatability and noisy signals (Figure 8(b) and (e)). This may be due to the complex paths that electrical signals have to traverse in these complex-shaped sensors. Also, during the knitting process for DMS and RHS samples, conductive yarn has to be truncated at the areas occupied by the non-conductive portions of the profile.
This may also have contributed to the arbitrary noise in signals. CRS and ELS on the other hand delivered less noisy signals (Figure 8(a) and (c)) with appreciable GF values (Figure 9(c)). RAS sample produced results with the highest repeatability devoid of noise. This may be as a result of consistent conductive loops linking the CDP from end to end ensuring smooth signal propagation. RAS is thus the profile of choice for knitted strain sensor design. Sensitivity results shown in Figure 9(c) establish that sensors with very low initial resistance tend to have poor sensitivity. Sample DMS which had the least resistance thus had the least sensitivity. On the other hand, RAS sample which had comparatively higher initial resistance value delivered the highest GF.
(a) and (b) Cyclic responses showing effects initial resistance fluctuations; (c) sensitivity results of samples; (d) linearity of test results.
Initial stress-recovery characteristics have been adversely affected by initial resistance fluctuations. During several rounds of tests, it was observed that the initial resistance values varied with subsequent cyclic resistance values. This initial resistance variations between samples during rounds of tests generated cyclic response observed in terms of signal drift [19]. Some of the signal drifts exhibited semblance of cyclic softening (Figure 9(a)) and cyclic hardening (Figure 9(b)) signal drift patterns. The cause cannot be attributed to a particular conductive profile as the occurrence was common to all the various profile groups of samples. The occurrence may be attributed to mulling’s effect generated by the tensile tester, the inherent conductive characteristic of conductive materials used in fabricating textile strain sensors which causes the resistance of the materials to fluctuate over time. This of course may also be influenced by the nature of textile structures and other environmental factors.
However, as can be seen, the change in resistance over the subsequent cycles has been pretty stable with average R2 values computed via a polynomial fit per cycle shown in Figure 9(d) hovering around the region of 0.91 ± 0.01. The linearity and repeatability of the sensors can thus be said to be very high. In Figure 6, test results of the samples presented showed good repeatability after the initial signal deviation. Opinions as to the real cause of the signal drift are however varied. Atalay et al. [19] ascribe it to the duality of their structure which caused dimensional instability during tensile test. Zhang et al. [29] suggest it being a reflection of the cycle differences.
Other imputable causes include friction by the structural alteration in a conductive fabric due to deformation of fibers and slippage between fibers as well as stretching, bending, twisting, and compressing affects activated when the knitted fabric is stretched [30,31]. Effect of aging on sensor performance was analyzed by comparing test results over 27 days period viz days 1, 20, and 27. It has been observed that the initial resistance of the sensor increased with age. From day 1, the resistance of 102 Ω rose to 129 and 134 Ω for days 20 and 27, respectively. Also, results establish improved sensitivity with age with a consistent and stable linearity over the 27 days period as shown in Figure 8(d).
Influence of CDP distance variation on sensitivity
Due to the comparatively better sensitivity performance of the rectangular-shaped sensor, additional rectangular samples of varied widths and lengths were fabricated to ascertain among other things, the influence of CDW and path variation on sensor performance. This includes elimination of the tapered ends of RDR to form RAS11, increasing and reducing the widths of RAS, etc. This particular experiment confirms that the initial resistance can be controlled in two ways, one by designing the sensor, such that it has a high length to width ratio or low width to length ratio bearing in mind the application and placement requirements.
However, even though this study established that low initial resistance levels resulted in low sensitivity and vice versa, the relations cannot be that of the higher—the better. This is confirmed by the GF values churned out by samples RAS12 and RAS13 which had the highest initial resistances, respectively. The elimination of the two tapered ends of RDR to form RAS11 reduced the initial resistance, and the sensitivity significantly as the parallel connections dominated the structure of the sensor.
These CDW and CDP complexities therefore point to the fact that an optimum conductive range criterion is required to deliver good sensor sensitivity. An optimum CDA aspect ratio has therefore been proffered by this study. This aspect ratio helps in containing the initial resistance with appreciable limits which has proven consistent in determining the sensitivity of the sensors. The most favorable aspect ratio for a CDA design operates within a range of 19:1 and between 24:1 to 77:1.
Characterization and test results of RAS samples.

The impact CDP or in other words the longitudinal dimension of the sensor’s conductive section has been tested by comparing five sensors RAS, RAS3, RAS5, RAS6, and RAS7 which had similar CDWs but different conductive lengths. Regression analysis was done by pairing the samples against each other and finding the best fit. There exist positive linear correlation between CDP and resistance, likewise between CDP and GF as shown in Figure 10(a). CDW values which were identical for all were thus ignored. The reason can be ascribed to the high initial resistance of the longest sample which is as a result of its high series connections as opposed to parallel connections in the stress direction and also fits the aspect ratio proffered by this study. However, the result produced by sample RAS3 confirms the earlier position that the CDP indeed operates within a certain optimal range. Increasing the CDP of RAS in RAS3 duly increased the initial resistance but did not translate to a superior in sensitivity Figure 10(a).
(a) Correlation between resistance, CDP, and GF of samples with identical widths but different lengths; (b) correlation between resistance, CDP, and GF of samples with identical lengths but different widths; (c) image of dyed sample; (d) correlation between resistance, wash times, and GF; (e) image of washed sample.
On the other hand, the influence of CDW variation has also been conducted to ascertain if the inverse of the previous results is true. Samples RAS6, 8, 9, 10, and 11 with identical CDP but graduated CDWs were thus paired. Regression results showed very high negative correlation between the samples as shown in Figure 10(b). This is a further confirmation that high width to length can result in lower sensitivity. Designing textile strain sensors with comparatively high initial resistance does not only proffer high sensitivity to the sensor but also enhance low power consumption requirements. The resistance dictates the quantum of current drawn by the circuit, and this is grounded on Ohm’s law which established that the higher the resistance, the lower the current and vice versa. As battery power becomes the standard for the operation of devices, battery power consumption becomes a critical factor in device performance.
But as stated earlier, the initial resistance needs to be controlled for optimum sensor performance. A further confirmation was elicited via tests on samples RAS13 and 14 which had exceptional low widths or CDWs. Their profiles imparted them with very high initial resistance values; however, this did not translate into high GF. Rather, this resulted in noisy signals and very low GF values. The resistance of the sensor, which has been referred to in the study as the initial resistance, is also known as the load resistance in electrical engineering. In event that the load resistance is extremely low, the chunk of the power output of the voltage source is dissipated as heat inside the source itself. On the other hand, if load resistance is too high, then the current which traverses the circuit will be too low to transfer energy to the load at an appreciable rate. This therefore informs the poor sensitivity response of sensors with very high resistance and those with very low resistance values.
It is therefore not advisable to design sensors with very small widths since these sensors have the possibility of churning out noisy signals and also reduced sensor sensitivity. Also, since the dominant circuit is that of series circuits, signal failures are therefore likely to occur in event of yarn breakage within the CDAs.
Influence of dyeing on sensor performance
Dyeing of the fabrics produced shrinkage in the length-wise and to a lesser extent in the thickness direction but not in the width-wise direction. This shrinkage thus reflected in both the CDPs and CDA results recorded before dyeing. Subsequent sensitivity tests as expected and shown in 10(c) reveal deterioration in sensor sensitivity after dyeing. The GF values for gray sample dropped from 1.21 to 0.9 after dyeing. Accounting for a percentage change in resistance from 24.26% to 18.09%. Figure 10(c) shows the image of dyed sample. The reason for sensitivity deterioration is ascribed to the shrinkage which in turn resulted in initial resistance reduction. The dyed samples also felt stiff compared to the gray samples. This result therefore renders dyeing as an unfavorable means to impart color to strain sensors. Knitting with dyed or colored yarn is thus recommended.
Influence of washing on sensor performance
Just like dyeing, post washing characterization of samples revealed some level of reduction in dimensions and resistance of the samples, albeit to a lesser extent compared to dyeing. Many studies have imputed the post laundry shrinkage of knitted structures to loop distortion and bending [32]. There has also been significant color change after washing with the samples turning whiter as shown in Figure 10(e). As can be seen in Figure 10(d), a decrease in sensitivity resulted after washing three times. However, after the 13th wash, there was a slight reversal with the test indices (resistance and CDP) increasing a little more than the previous three times wash results. Seven (7×) subsequent washes (20th wash) however showed a further decrease in physical indices from the previous ones recorded but to a much lesser degree compared to the transition from unwashed to the initial three times wash. This therefore hints that multiple washes have the propensity to isolate the influence of dimensional reduction on resistance change; however, other new dynamics such as stiffness and probable inherent deterioration of the conductive coating of the yarns may be emerging.
Thus, after the 20th wash, there has been a further but marginal reduction in dimensions but rather emerged pronounced stiffness of the samples, culminating into reduced elasticity, a situation ascribed to the probable presence of detergent residue. Resistance however increased notwithstanding the decrease in dimension a situation arising out of probable inherent deterioration of conductive coating on the yarn. However, the increase in resistance as such did not translate into improved sensitivity as can be seen from the plot in Figure 10(d). One of the reasons for the decrease in sensor sensitivity could therefore be as a result of the sensor’s stiffness. This is because initial cycle tests produced significantly reduced sensor sensitivity values of 0.54 ± 0.08 which later on shot up after subsequent cycle tensile tests, a time when the structure must have been relaxed a little bit due to a number of stress-relaxation cycles.
Conclusion
The findings of this research establish that 1 × 1 mock rib-knitted strain sensor having a rectangular profile delivers best sensor performance with noiseless signals, highest GF, and good result repeatability. This is as a result of its straight CDP which ensures smooth signal propagation. On the other way round, complex conductive shapes such as diamond and horse shoe are prone to noise and tend to produce low signal repeatability as the signal paths appear to be crooked. This crooked CDP emanates from the truncation of their conductive loops during knitting along the portions of the profile occupied by non-conductive yarns.
The study also reveals that a high initial resistance of a textile strain sensor is very important and dictates its sensitivity up to a point. The optimum initial resistance value thus operates within a rather large range from 40 to 120 Ω. The initial resistance is governed by the sensor’s shape characteristics, whether or not it is dominated by reduced parallel circuits (low width) and increased series circuits (high length). Therefore, with the stress direction of the sensor being in the course-wise direction, reduced number of courses and increased number of wales leads to high initial resistance.
Higher number of courses increases with the number of parallel circuits leading to low initial resistance and subsequently low sensitivity or vice versa. However, to attain a balance between series and parallel circuits within the sensor structure for the optimum initial resistance value and best sensor performance, the ideal aspect ratio for CDA could be adjusted to 19:1, and a range between 24:1 and 77:1 cm depending on the application which could deliver a GF value >1. Certain applications require longer or shorter CDPs. A GF value beyond 1 is considered satisfactory in the opinion of the authors as this figure compares favorably with strain sensor fabricated using plaited silver conductive yarns. Within this optimal range, there exist a linear relationship between initial resistance, CDP, CDW, and GF.
Also, sensor’s signal noise can be reduced significantly by ensuring stable probe connections. Both washing and dyeing of sensors have been found to adversely affect sensor sensitivity. Dyeing reduced the sensitivity to a large extent therefore renders dyeing as an unfavorable technique in introducing color to strain sensored apparels. Knitting with dyed yarns is thus recommended. Therefore, when it comes to washing the sensors during usage, repeated washes beyond a threshold of 30 times cannot be considered as tolerable.
Footnotes
Declaration of conflicting interests
The author(s) declared no potential conflicts of interest with respect to the research, authorship, and/or publication of this article.
Funding
The author(s) disclosed receipt of the following financial support for the research, authorship, and/or publication of this article: The authors acknowledge the financial support from the Science Foundation of Jiangsu Province (BK20151129); Fundamental Research Funds for the Central Universities (JUSRP51727A).