
Abstract
In this study, cross-linked cationic starch was synthesized with corn starch as a raw material, epichlorohydrin as a cross-linked agent, and 3-chloro-2-hydroxypropyl trimethylammonium chloride as a cationic etherification agent, respectively, and it was characterized by X-ray photoelectron spectroscopy, X-ray powder diffraction, scanning electron microscopy, and thermogravimetry. The X-ray photoelectron spectroscopy results showed that cationic N appeared on the surface of cross-linked cationic starch; that is, a quaternary ammonium group was introduced. The X-ray powder diffraction results indicated that although the crystallinity of cross-linked cationic starch was lower than that of corn starch, cross-linked cationic starch still had an A-type crystal structure. The scanning electron microscopy results demonstrated that cross-linked cationic starch maintained a granular structure with small holes on the surface. Finally, the thermogravimetric results illustrated that the thermal stability of cross-linked cationic starch decreased. Before the adsorption experiment, the pHpzc of cross-linked cationic starch was obtained by the pH drift method, and it was 6.8. The optimal removal rate of reactive golden yellow SNE dye obtained by response surface methodology was 99.59%, and the optimal adsorption time, temperature, concentration of dye, and cross-linked cationic starch dosage were 14.3 min, 39°C, 100 mg/L, and 0.7 g/L, respectively. The adsorption of SNE by cross-linked cationic starch conformed to pseudo-second-order kinetics and the Langmuir isothermal adsorption model. The equilibrium adsorption capacity from pseudo-second-order kinetics and the maximum adsorption capacity from Langmuir isotherm model were 123.76 and 208.77 mg/g at 308.15 K, separately. In addition, this adsorption was an endothermic process.
Keywords
Introduction
In recent years, water pollution from dyes has reached an unprecedented level. Printing and dyeing processes in the textile industry consume large amounts of water and discharge large amounts of wastewater, and approximately 2%–20% of dyes are discharged with wastewater.1,2 In the dye market, azo dyes are widely used in the printing and dyeing industry for their bright colors and high color fastness, accounting for 60%–70% of synthetic dyes. 3 Azo dyes with complex structures, containing one or more –N=N– groups in molecules connected with multiple aromatic rings, are poorly biodegradable. In addition, azo dyes are toxic and carcinogenic, and once discharged into water bodies, they pose a serious threat to human, animal and plant health.4–6 Reactive azo dyes containing sulfonic acid groups are in increasing demand due to their high specific water solubility and durability. 7 Reactive golden yellow SNE dye (SNE) is a kind of anionic dye with monochloromethazine as the active group, and there are sulfonic acid groups in the molecule.
Dye removal methods include membrane separation, coagulation, ion exchange, biological oxidation, and adsorption.8–13 The adsorption method is one of the most mature methods for the treatment of dye wastewater. 14 Moreover, adsorbents can be obtained in a wide range, including inorganic adsorbents, represented by activated carbon (AC) and zeolite,15,16 and newly developed organic adsorbents, represented by chitosan-, cellulose-, and starch-based materials.17,18 However, the adsorption performance of inorganic adsorption materials is determined by their own specific surface area and porous structure. Therefore, the application of inorganic adsorption materials is limited due to their large volume and low efficiency in the treatment of high-concentration wastewater. Organic adsorption materials have become increasingly popular due to their nontoxicity, biodegradability, and relatively low price. However, chitosan- and cellulose-based adsorbents have some disadvantages as shown in Table 1.
Different adsorbents used for the treatment of dye wastewater.

AC: activated carbon.
Starch is an environmentally friendly, natural, renewable polysaccharide macromolecular compound with a maximum storage capacity.19,20 The highly active and changeable hydroxyl groups in the starch structural unit can support various functional groups through surface chemical modification, thus greatly expanding the application range of starch.21,22 Cross-linked cationic starch (CCS) is a modified starch obtained by the cross-linking and etherification of natural starch. Quaternary ammonium groups are introduced into the starch molecules so that the molecules are positively charged and can effectively absorb anionic dyes.
The adsorption process of SNE by CCS is affected by the adsorption time, temperature, dosage of adsorbent, initial concentration of dye, pH, and oscillation velocity. The optimization of adsorption process variables (independent variables) is a combination of statistical techniques and mathematical models that requires a comprehensive design of the experiment. 23 Response surface methodology (RSM) is a method proposed by Box and Wilson to obtain optimal conditions.24,25 Compared with the traditional optimization method, RSM requires a limited number of experiments and is more convenient to operate. Moreover, RSM can obtain not only the influence of each variable on the dependent variable but also the influence of the interaction between two independent variables.26–28 In this study, an RSM method based on central composite design (CCD) 29 was used to optimize the adsorption process variables, including the time, temperature, dosage of CCS, and concentration of dye, and the adsorption kinetics, isothermal adsorption, and adsorption thermodynamics of SNE on CCS were studied.
Experiment
Materials
Corn starch was of chemical grade and was purchased from Zhucheng XingMao, Shandong, China. Epichlorohydrin (ECH), 30% trimethylamine solution, and NaOH (sodium hydroxide) were purchased from Guangfu, Tianjin, China. SNE with molecular weight (MW) = 1025.24 g/mol was obtained from Shenxin, Jiangsu, China. The chemical structure is shown in Figure 1. All standards and aqueous solutions used in this study were prepared with distilled water, and all the chemicals were analytically pure.

The chemical structure of SNE.
Synthesis of cross-linked cationic starch
First, the etherifying agent 3-chloro-2-hydroxypropyltrimethyl ammonium chloride (CHPTMAC) was prepared. In an ice bath, 163.2 mL of 30% trimethylamine solution was slowly added to 64.5 mL of concentrated hydrochloric acid in a three-necked round flask equipped with a thermometer and a constant-pressure funnel; the temperature was controlled below 30°C, and the pH was adjusted to 7.5–8 with 30% trimethylamine solution. Then, 58.4 mL of ECH was added, and the mixed solution was processed at 35°C for 5 h. After the reaction, unreacted trimethylamine was removed through reduced pressure distillation, and unreacted epichlorohydrin and the byproduct dichloropropanol were removed by extraction with carbon tetrachloride. Finally, the product obtained by precipitation with acetone and dried at the required temperature was the etherifying agent CHPTMAC.
Next, the cross-linked starch (CS) was prepared as follows. In a three-necked flask equipped with a motor stirrer and condensing unit, corn starch was added to 0.2% (w/w) sodium hydroxide and 5% (w/w) sodium chloride mixed solution at a concentration of 10% (w/w). The mixture was stirred thoroughly in a constant-temperature bath of 50°C. To this mixture, 3 mL of ECH was added dropwise for 10 min. After stirring for 8 h, the reaction suspension was adjusted to pH 7.0 and then filtered and washed. Finally, the obtained CS was dried at 50°C in a vacuum oven for 12 h.
Finally, CCS was synthesized. A total of 6 g of CS was dissolved in 15 mL of water and 15 mL of ethanol. A certain amount of NaOH solution was added to the starch suspension, and the mixture was alkalized at 50°C for 30 min. Then, CHPTMAC was added, and the obtained mixture suspension was etherified at 50°C for 6 h. After separation and washing, the final product was dried at 50°C for 24 h (Figure 2).

Schematic diagram of CCS.
Characterizations of cross-linked corn starch
The surface chemical composition was analyzed by X-ray photoelectron spectroscopy (XPS; ThermoFisher Scientific, China). X-ray powder diffraction (XRD) patterns were collected using a Bruker D8 ADVANCE diffractometer (Germany). The samples were scanned from a 2θ of 4°–50° with a step size of 0.02°. The particle morphology was observed using a Hitachi S4800 cold-field scanning electron microscope (SEM, Japan) with 10.0 kV voltage and 2.0k and 5.0k magnification. The thermogravimetric (TG) profiles were obtained by using a Netzsch STA449F3 (Germany). Measurements were collected under a nitrogen atmosphere in a temperature range of 35°C–600°C at a heating rate of 10°C/min.
Adsorption study
SNE was dissolved in deionized water to the required concentrations, and the adsorption experiments were carried out in batches of 50-mL conical flasks containing a specific amount of CCS and 20 mL of SNE solution in a shaking bath. After shaking for a definite time, CCS was removed by extraction filtration, and the concentrations of the SNE in solution after adsorption were analyzed by a ThermoFisher Scientific ultraviolet–visible spectrophotometer (US). The removal rate (RE) of SNE by CCS was determined as follows30,31

where C0 and Ct are the concentrations of the dye initially and at time t, respectively.
Point of zero charge pH of cross-linked corn starch
The pH at the point of zero charge (pHpzc) is when the charge on the adsorbent surface is zero. The pHpzc for CCS was obtained by the pH drift method. 32 The initial pH (pHinitial) of 50 mL 0.01 M NaCl solution was adjusted by 0.1 M HCl or NaOH solution to 4–9. Then, 0.15 g of CCS was added to the NaCl solutions with different pH values, and the suspension was stirred at 25°C for 48 h. After 48 h, the final pH (pHfinal) was measured. The pHpzc of CCS is the value at which pHinitial is equal to pHfinal.33,34
Adsorption process optimization
This research adopted RSM based on CCD to optimize the adsorption process variables, including A (time, min), B (temperature, °C), C (dye concentration, mg/L), and D (CCS dosage, g/L), as well as the level of each variable, as shown in Table 2. Design-expert 8.0 was used to design the experiment and analyze the results. The response results were evaluated by a second-order polynomial, including individual, square, and interaction terms for each variable. The secondary response model is as follows 35

where Y is the RE of SNE; Xi and Xj are independent variables; β0, βi, βii, and βij are the constant, linear, quadratic, and interaction coefficients, respectively; and ε is the residual error.
Ranges and levels of parameters for the CCD model.

CCD: central composite design; CCS: cross-linked cationic starch.
Results and discussion
Characterization studies
Figure 3 shows the high-energy resolution spectra of nitrogen. There was an N1 peak at 400.0 eV in both the corn starch and CCS spectra due to the presence of proteins in the molecules. An N2 peak at 402.6 eV appeared in the energy spectrum of CCS due to the introduction of quaternary ammonium groups. 36 The XPS results showed that the form of nitrogen changed in CCS compared with corn starch and quaternary ammonium groups were introduced into the starch molecules.

High-energy resolution spectra of nitrogen in (a) corn starch and (b) CCS.
The XRD patterns of corn starch and CCS are shown in Figure 4. From the figure, the XRD curve of corn starch showed strong reflections at 2θ values of approximately 15.0°, 17.1°, 18.0°, and 23.0°, illustrating the A-type crystal structure. 37 The strength of the diffraction peaks of CCS was obviously weakened. After modification, the crystallinity of the starch decreased but did not disappear. This result was due to the introduction of covalent bonds between the starch molecules in the presence of a cross-linking agent whose interaction force was significantly higher than the hydrogen bond force, enhancing the intermolecular binding of starch. Therefore, the next etherification reaction had a small effect on the crystallinity. However, the introduced quaternary ammonium groups increased the steric effect and the distance between the molecular chains, resulting in difficulties in forming hydrogen bonds between molecules. Furthermore, quaternary ammonium groups carrying positive charges are mutually exclusive, increasing the distance between chains in the crystalline region. This behavior destroyed the crystalline structure and internal tight structure of starch, which was beneficial to the diffusion of dye into the starch, enhancing the adsorption performance.

XRD spectra of corn starch and CCS.
As shown in Figure 5, the corn starch granules were polygonal, with a smooth surface and a high degree of regularity, and CCS maintained a granular structure. However, from the image of CCS magnified 5.0k times, it can be observed that there were tiny holes on the surface. The integrity of the starch particles was mainly determined by the crystalline structure. If the crystalline region was destroyed, the macrostructure of the starch particles also changed significantly. Therefore, the grain morphology of CCS underwent the abovementioned slight change. The appearance of tiny holes in CCS was more conducive to the adsorption of dye.

SEM images of (a) corn starch and (b) CCS.
As seen from the TG diagram, there were three stages of mass loss for corn starch and CCS. The first stage of mass loss began at approximately 156°C and was a process of moisture evaporation in the starch. Although the starch was dried at low temperature before the thermal performance test, the hydroxyl groups on the glucose units in the starch molecules could combine with water molecules via hydrogen bonds, so there was still water evaporation in the first stage. The second phase of mass loss occurred at approximately 250°C–350°C, in which the starch quality decreased the most, more than 50%. In this process, polysaccharide chain depolymerization and glucose ring–opening thermal degradation occurred, and CO, CO2, H2O, and other gas products as well as solid coke were generated. 38 The third stage was the thermal decomposition of solid coke. Because the test was carried out in a N2 atmosphere, there was no O2 to provide combustion of the final product, so the final remaining mass was relatively high, approximately 20%. It can be seen from Table 2 that the residual mass of CCS was relatively large, which was caused by the presence of the inorganic component Cl in the CCS molecules.
The data obtained by analyzing the TG and DTG (derivative thermogravimetric) curves in Figure 6 are shown in Table 2. After comprehensive consideration of Tonset, T50%, and Tpeak in Table 2, it was found that the thermal decomposition temperature of CCS was relatively low, that is, the thermal stability became worse. This was because for corn starch, crystallinity was the main factor affecting the thermal performance. 39 According to the XRD results, the crystallinity of CCS was reduced, so the thermal stability was weakened. In addition, it can be seen from Table 3 that the thermal decomposition rate of CCS was significantly lower than that of corn starch, which was caused by the increase in the molecular chains and molecular size of corn starch after cross-linking and etherification.

TG and DTG curves of (a) corn starch and (b) CCS.

TG: thermogravimetric; DTG: derivative thermogravimetric; CCS: cross-linked cationic starch; Tonset: extrapolated onset temperature; T50%: 50% weight loss; Tpeak: temperature of the highest decomposition rate; residual mass: solid residual left at 600°C; slope: decomposition rate.
The effect of pH
Figure 7 shows the result for the effect of pH, and the pHpzc of CCS was 6.8, as obtained from the curve. According to the literature, when the pH value of a solution is lower than pHpzc, the adsorbent surface is positively charged.26,32–34 Otherwise, the adsorbent surface is negatively charged. As shown in Figure 1, SNE, which has sulfonic acid groups, is an anionic dye. When the surface of the adsorbent is positively charged, it can be effectively absorbed by electrostatic attraction. Therefore, in the subsequent adsorption experiment, the pH value of the SNE solution was 5.

The pHpzc of CCS using the pH drift method.
CCD model analysis
The CCD experimental results for the removal of SNE in solution by CCS are shown in Table 4, and the results obtained with Designer-expert 8.0 are listed in Table 4. The corresponding quadratic polynomial for SNE RE and the four influencing factors is shown in formula (3)

CCD for the four independent variables and the results of RE.

CCD: central composite design; RE: removal rate.
It can be seen from Table 5 that the quadratic model, which has a high Fischer ratio and a p value lower than 0.0001, indicated that the model was statistically significant. The model determination coefficient (R2) was 0.9921, indicating that the model could explain 99.21% of the variable data.
ANOVA for the RE of SNE by CCS.

ANOVA: analysis of variance; RE: removal rate; CCS: cross-linked cationic starch; df: degrees of freedom.

Normal plots of residuals.
The p values of the independent variables A, B, C, D, BD, CD, B2, and C2 were lower than 0.01, indicating that these variables had a significant influence on the response at the 99% confidence level. In addition, the p values of the independent variables AB and BC were lower than 0.05, indicating that these variables had a significant influence on the response at the 95% confidence level. The effects of other factors were not significant.
Effects of experimental variables on SNE RE
The independent influence of the four variables on the SNE RE is shown in the perturbation in Figure 9. For CCS, the time, temperature, and dosage of CCS have the same trend of influence on RE and are directly proportional to RE; the influences of temperature and the dosage of adsorbent were more significant. Curve C indicated that the RE increased substantially with a decreased concentration of SNE solution.
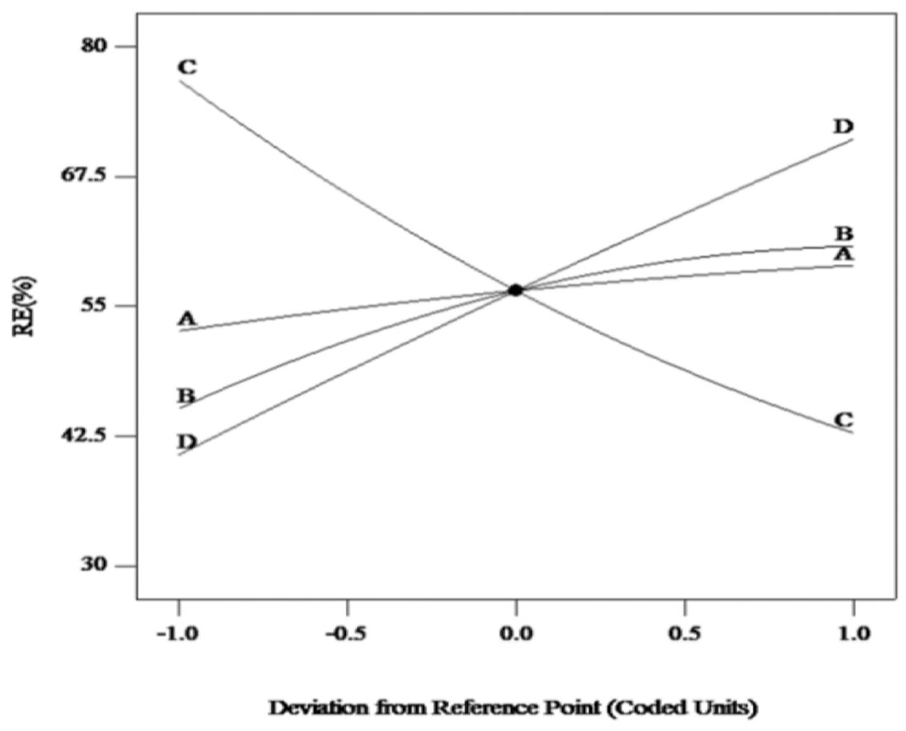
Perturbation plot for RE of SNE by CCS.
The three-dimensional (3D) surface and contour diagram represent the influence of the interaction of two factors on the RE in 3D space and two-dimensional space, respectively. Figure 10(a) shows the influence of the interaction between time and temperature on RE when the CCS dosage was 0.6 g/L and the SNE concentration was 150 mg/L. At all temperatures, with increasing time, the active sites −N+R on CCS remained in contact with SNE, and RE gradually increased. At all times, RE increased with increasing temperature. Figure 10(b) shows the influence of the interaction between temperature and SNE concentration on RE when the adsorption time was 10 min and the CCS dosage was 0.6 g/L. According to the figure, as the temperature increased and the SNE concentration decreased, RE became larger. Figure 10(c) shows the influence of the interaction between CCS dosage and temperature on RE when the adsorption time was 10 min and the SNE concentration was 150 mg/L. As the temperature increased and the CCS dosage increased, RE gradually increased. Figure 10(d) shows the influence of the interaction between CCS dosage and concentration of SNE on RE. With increasing CCS dosage and decreasing SNE, RE increased gradually. When the CCS dosage was 0.8 g/L and the SNE concentration was 100 mg/L, RE reached a maximum value of 92.28%.
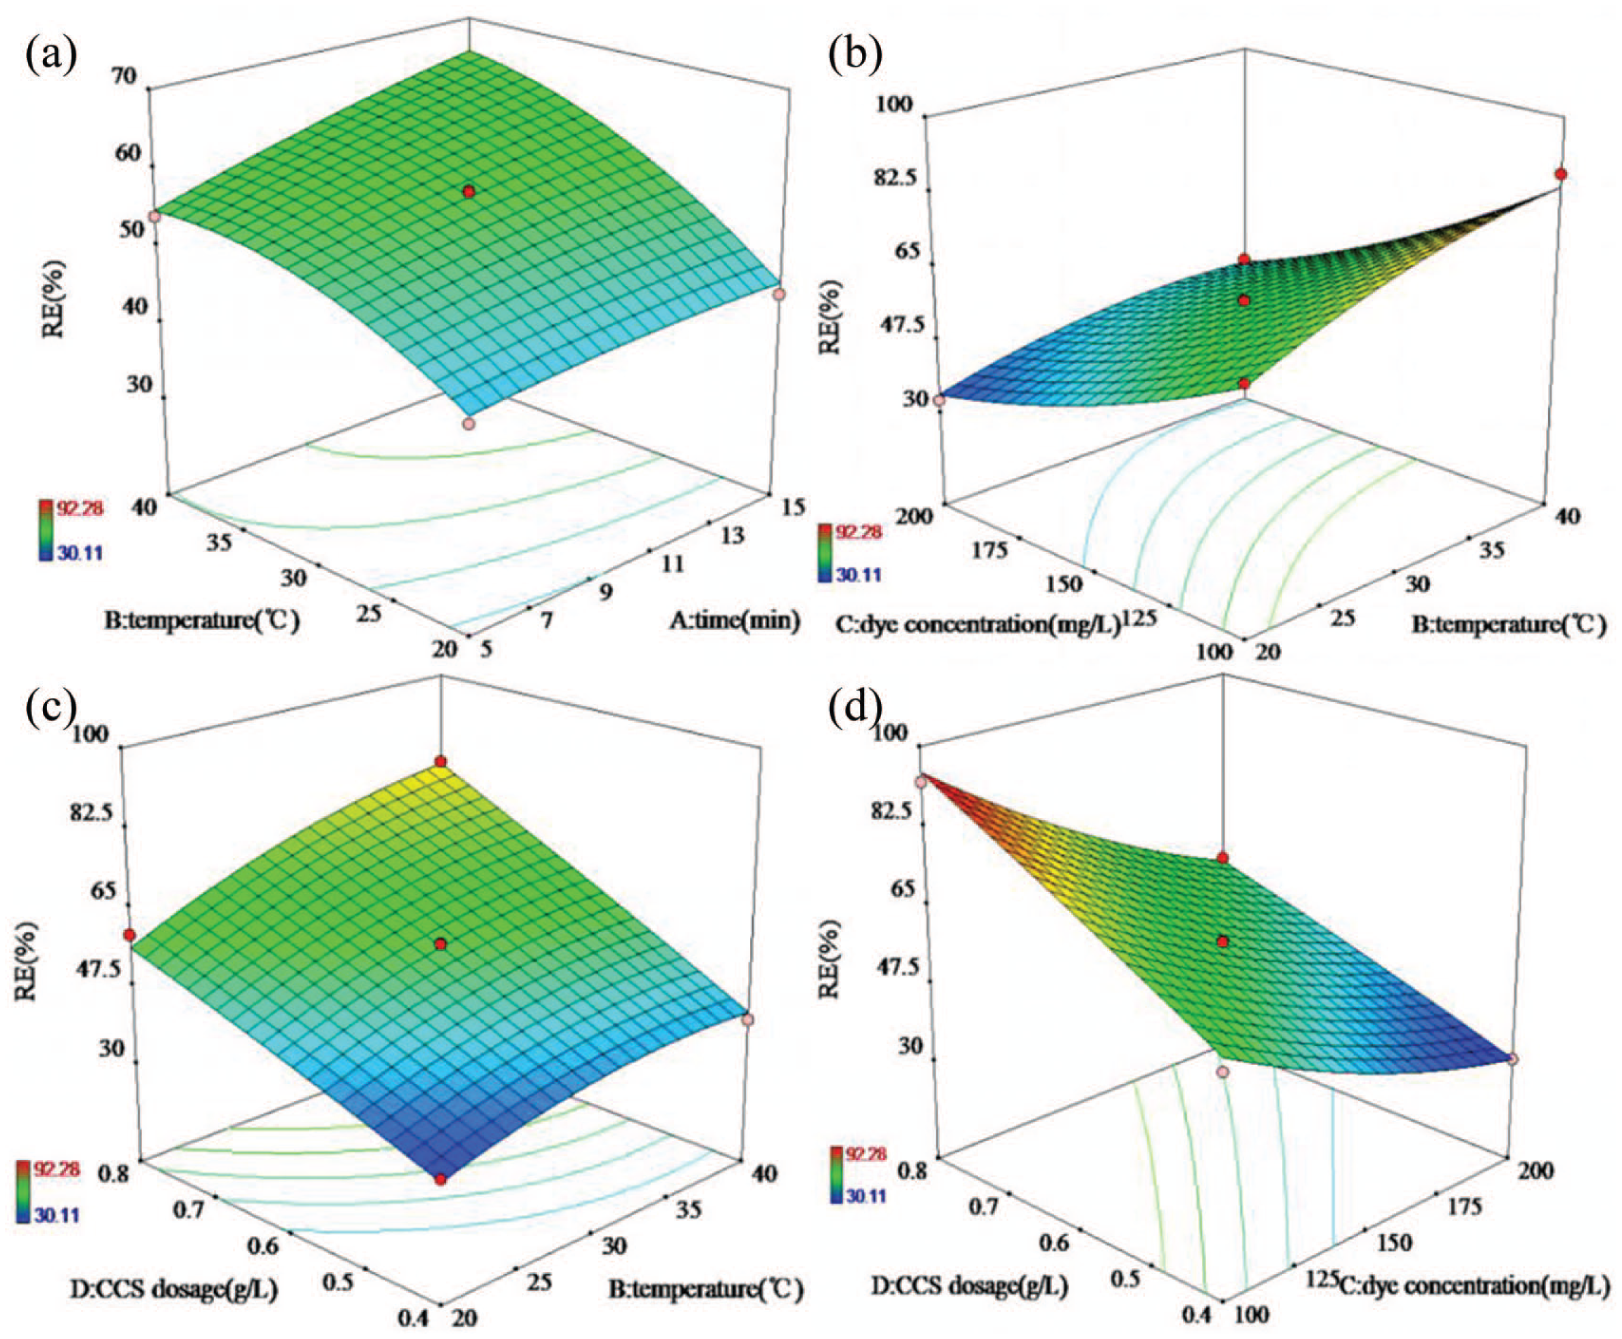
Response surfaces and contour plots for SNE removal by CCS.
Optimum conditions
The best conditions for removing SNE by CCS, as obtained from the software Design-expert 8.0, included a time of 14.3 min, temperature of 39°C, SNE concentration of 100 mg/L, and dosage of CCS of 0.7 g/L. Under these conditions, the theoretical RE was 99.09%, and the experimental value was 99.59%. The error was 0.50%, and SNE was essentially completely removed at this time.
Adsorption kinetics study
Pseudo-first- and second-order kinetic models 40 were used to investigate the adsorption mechanism and possible velocity control step. The pseudo-first-order equation is expressed as

where qt is the adsorption capacity at time t; qe is the equilibrium adsorption capacity; and k1 is the pseudo-first-order rate constant of the equation. Figure 11(a) shows the plot of ln(qe − qt) versus t for SNE adsorption by CCS; k1, qe, and the correlation coefficient (R2) obtained by fitting are displayed in Table 6.
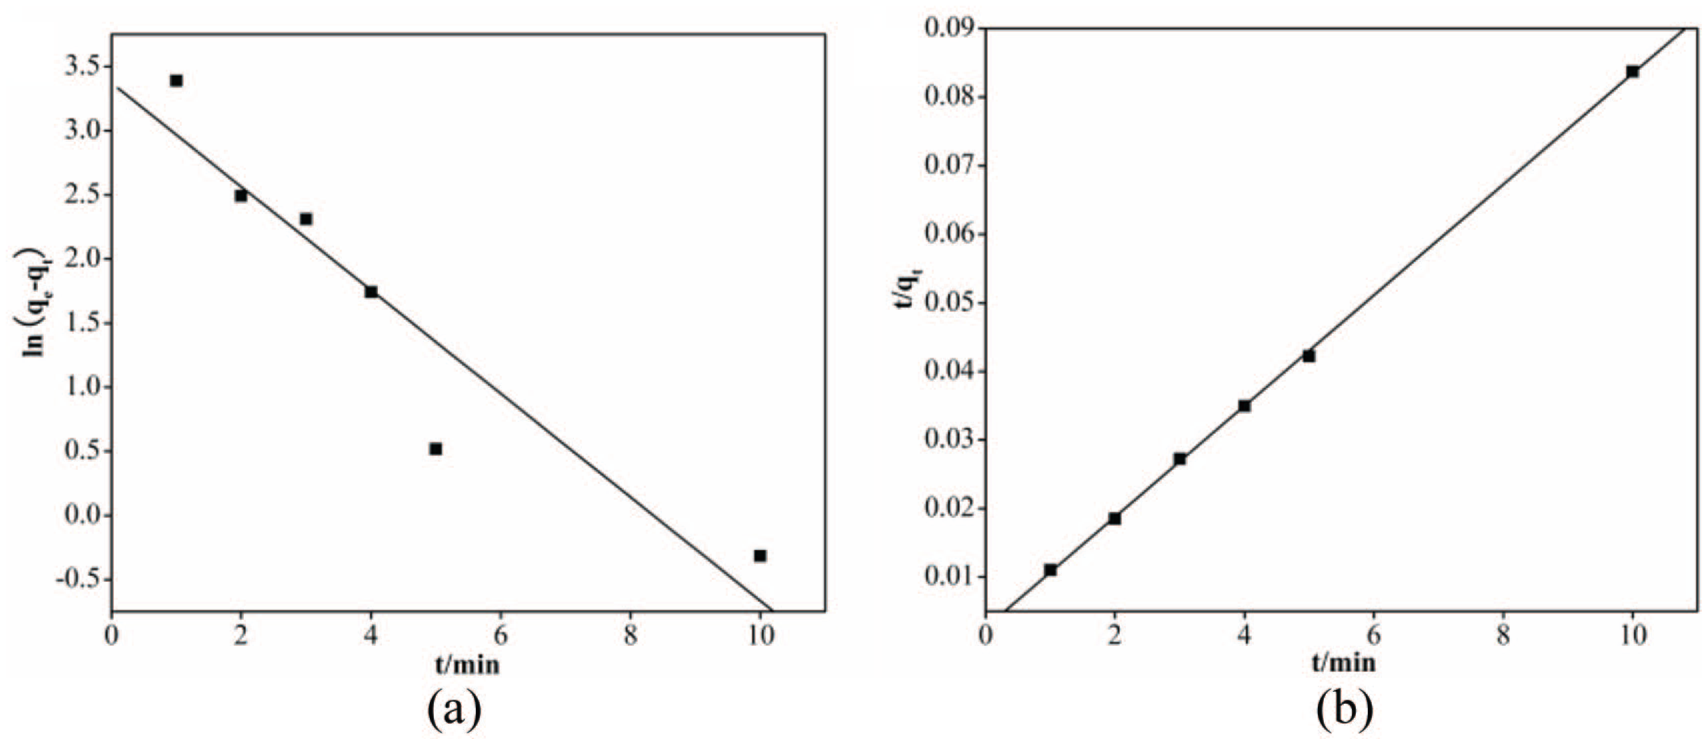
(a) Pseudo-first-order and (b) second-order kinetic plots for SNE adsorption by CCS.
Pseudo-first-order and second-order kinetic parameters for SNE adsorption by CCS.
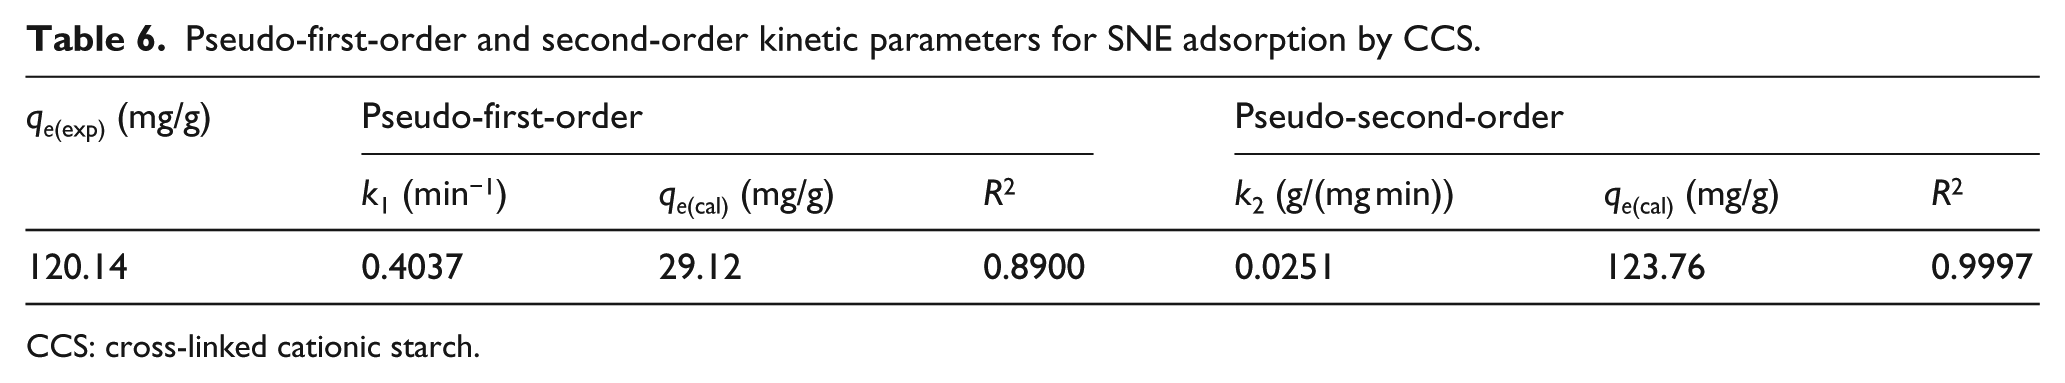
CCS: cross-linked cationic starch.
The pseudo-second-order equation is expressed as
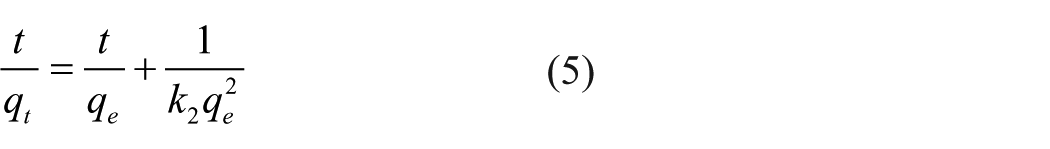
where k2 is the pseudo-second-order rate constant of the equation. The relationship between t/qt and t is shown in Figure 11(b), and k2, qe, and R2 were calculated and are shown in Table 6. On the one hand, the value of R2 for the pseudo-second-order model was closer to 1.0 than that of the pseudo-first-order model. On the other hand, the calculated qe of the pseudo-second-order model was similar to the experimental value. Therefore, the adsorption of SNE by CCS was better fitted with the pseudo-second-order model. In other words, the chemical reaction was the main rate-determining step of the SNE adsorption process by CCS.
Adsorption isotherm study
The Langmuir and Freundlich equations41,42 were adopted to study the equilibrium of the adsorption process between the liquid and solid phases. The basic principle of the Langmuir theory is that a solid adsorbent surface has a uniform adsorption energy and each molecule occupies only one adsorption site. Therefore, the Langmuir isotherm applies to monolayer adsorption. The linear Langmuir equation is

where qm is the maximum adsorption capacity, Ce is the equilibrium concentration of SNE, and KL is the Langmuir constant representing the adsorption energy. The relationship between Ce/qe and Ce is plotted in Figure 12(a). The values of the Langmuir isotherm parameters calculated by fitting are shown in Table 7. The maximum adsorption capacity and Langmuir constant increased with increasing temperature, which indicated that the adsorption process of CCS on SNE was endothermic.

(a) Langmuir and (b) Freundlich adsorption isotherms for SNE adsorption by CCS.
Langmuir and Freundlich adsorption isotherm parameters for reactive dye adsorption by CCS.

CCS: cross-linked cationic starch.
Freundlich isotherms assume that the process of adsorption occurs on a heterogeneous surface and that the adsorption capacity is related to the equilibrium concentration of dye. The linear Freundlich equation is as follows

where KF is the Freundlich adsorption coefficient and n is the characteristic Freundlich constant related to adsorption intensity. Figure 12(b) shows the linear plots of the lnqe versus lnCe curves, and the relevant parameters are given in Table 7. It is generally believed that n > 1 represents favorable adsorption and that when n is larger, the interaction between adsorbent and adsorbate is stronger. Table 7 shows that as the temperature increased, the Freundlich adsorption coefficient and n increased, which illustrated that when the temperature was high, there was a greater adsorption energy between CCS and SNE. The Freundlich characteristic constants were all greater than 1, indicating that the adsorption of SNE by CCS easily occurred. Compared with the correlation coefficient of the Langmuir isotherm, the correlation coefficient of the Freundlich isotherm was lower; therefore, the adsorption of SNE by CCS was better fitted by the Langmuir isotherm. The adsorption process occurred on a homogeneous surface, and the adsorption was monolayer adsorption. Moreover, the Langmuir constant KL increased with increasing temperature, so it can be preliminarily concluded that the adsorption was chemical adsorption, which corroborates the conclusion from the adsorption kinetics study.
Adsorption thermodynamics study
Temperature plays an important role in adsorption. To investigate the adsorption thermodynamics, adsorption experiments were carried out at different temperatures. At different initial concentrations of SNE solution, the thermodynamic parameters were calculated by the following equations 43


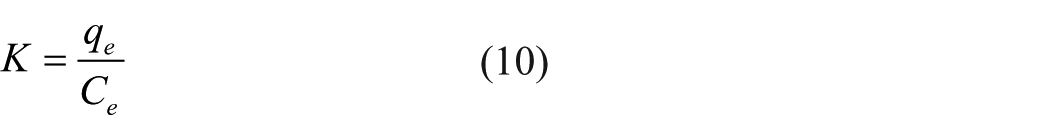
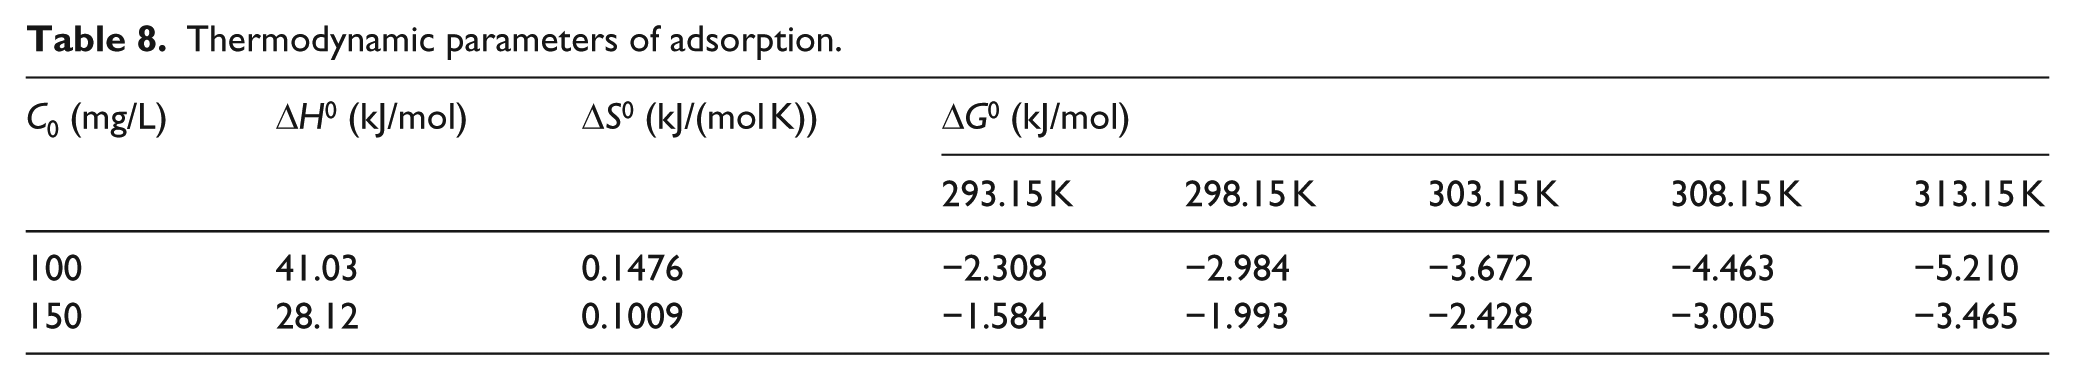
where R (8.314 J/(mol K)) is the universal gas constant; T is the temperature; K is the equilibrium constant determined by qe and the dye concentration Ce; ΔS0 and ΔH0 are the entropy change and enthalpy change, respectively; and ΔG0 is the Gibbs free energy (kJ/mol), which is used to determine whether the adsorption is spontaneous. Figure 13 shows the relationship between lnK and 1/T, and the parameters are listed in Table 8. The Gibbs free energy value of ΔG0 < 0 showed that the adsorption behavior of CCS on SNE was spontaneous, and with increasing temperature, the values of ΔG0 became more negative, indicating that the adsorption of SNE by CCS was easier at higher temperatures. The enthalpy change value of ΔH0 > 0 further indicated that the adsorption of CCS on SNE was endothermic, and the entropy change value of ΔS0 > 0 illustrated that the process underwent an increase in entropy, showing that the reaction was irreversible and desorption did not easily occur. The ΔG0 value at an initial dye concentration of 100 mg/L was more negative than that at a concentration of 150 mg/L, which indicated that the lower dye concentration favored adsorption.

Plots of the relationship between lnK and 1/T for reactive dye adsorption by CCS.
Thermodynamic parameters of adsorption.
Conclusion
In this study, CCS was prepared by cross-linking and etherification and characterized by XPS, XRD, SEM, and TG. The pH drift method was used to obtain a pHpzc of 6.8 for the CCS. RSM based on CCD was used to optimize the adsorption process variables, including time, temperature, SNE concentration, and CCS dosage. The experimental results showed that the established quadratic polynomial model was significant. The optimal SNE removal conditions obtained from this model were an adsorption time of 14.3 min, a temperature of 39°C, an SNE concentration of 100 mg/L, and a CCS dosage of 0.7 g/L. Under these conditions, the experimental RE was 99.59%. The kinetic study showed that the adsorption of SNE by CCS conformed to a quasi-second-order kinetic model, and chemical adsorption was the decisive step in the whole adsorption process. The adsorption of SNE by CCS was more consistent with the Langmuir isothermal adsorption model; that is, the adsorption process of SNE by CCS was a monolayer adsorption process. The thermodynamic parameters indicated that the adsorption was an endothermic process. CCS had good adsorption performance for SNE and is expected to be applied in the treatment of industrial dye wastewater in the future.
Footnotes
Declaration of conflicting interests
The author(s) declared no potential conflicts of interest with respect to the research, authorship, and/or publication of this article.
Funding
The author(s) received no financial support for the research, authorship, and/or publication of this article.