
Abstract
We evaluated 15 materials for their effectiveness as hip protective pads for elderly women, including several materials used in commercially available pads and novel materials. The materials’ densities were measured, and they were tested for force attenuation (relevant to protection), permeability index (relevant to thermophysiological wear comfort) and interface pressure delivery (relevant to pressure comfort). Force attenuation values were obtained in drop impact tests. Permeability data were obtained from the dry thermal resistance and evaporative resistance of the pads tested using a sweating guarded hot plate. Interface pressure delivery values were acquired using a Salzmann pressure-measuring device MST MK IV. Experimental pads were graded, rated and ranked on their overall performance using weights applied to the four parameters. Vertically lapped nonwoven fabrics and treated knitted spacer fabrics were highly ranked and could be used as material for hip protective pads.
Introduction
The world’s population is ageing: the proportion of individuals aged 60 years and above is increasing faster than that of any other age group. An estimated 1.2 billion people will be aged more than 60 years in 2025. 1 The ageing population means increasing rates of disability, and its feminisation (due to women living longer than men worldwide, lifting the ratio of women to men in older age groups) 1 translates into higher incidence of several gendered health problems.
Falls are among the most severe and frequent injuries experienced by people older than 65 years.2,3 Hip fractures are mainly caused by falling on a proximal femur 4 and are major contributors to the disability, death and medical costs associated with falls. 2 Hip fractures occur in around one in four women and one in eight men. 5
A common method of prevention of hip fractures in older people is the use of a hip protective garment. 6 Hip protective garments are special underwear designed to dissipate kinetic energy from an impact to soft tissue and muscle, and particularly to the anterior and posterior of the femur, 6 using integrated soft or hard protective pads. Biomechanical research suggests that passive protective measures such as hip protective pads are more effective at preventing hip fractures than efforts aimed at slowing the rate of bone loss (and hence bone strength) in older people. 7
Compliance (or adherence – the percentage of people who continue to wear the hip protective garment) is a major problem. Compliance rates for some products fall significantly with time. 8 Bentzen et al. 9 compared acceptance of soft and hard protective pads in nursing homes and found no clinically relevant difference in acceptance or probability of continued use. However, significantly more users of the soft hip protective pad used the protective pad 24 h a day. The following factors may influence hip protective garment compliance negatively: it being experienced as too tight, too hot, uncomfortable in bed and necessitating assistance in toileting, 8 being too bulky or uncomfortable and being difficult to put on. 10
To increase wearers’ adherence to hip protective garments, the negative determinants of hip protective garment have to be addressed. Pad choice plays an important role in overcoming these problems. The pad’s protective effectiveness is the main attribute that has to be fulfilled; the average strength of an elderly woman’s hipbone is 2.5 kN, 11 so the impact force under the pad has to be below 2.5 kN to prevent hip fracture.
Elderly people experience specific physical changes associated with the declining function of the skeletomuscular system that affect their ability to dress and undress, to manipulate buttons and other closures and that are relevant to clothing comfort. The following changes have the greatest influence on demands on clothing: (1) the decline of muscular strength, meaning difficulty in gripping and otherwise coping with heavy garments, for instance when attempting to don hard elastic materials; (2) ageing skin becomes thinner, dryer and more sensitive, so the textile materials used in garments should be smooth and highly stretchable to avoid skin irritation and itching and (3) increased blood pressure and declining blood flow, meaning that clothes must not fit so tightly that they hinder the circulation of the blood, especially at the groyne and in the legs and feet. 12
To avoid pressure discomfort, where the hip protective garment is perceived as too tight by the wearer, the pad integrated into the garment fabric should not add high pressure to the hip section of the wearer. The protective pad has to be flexible enough to permit an adequate range of motion and adjust to the body contours of the wearer.
Another attribute that must be considered is pad thickness: the pad has to be as thin as possible to prevent the garment becoming bulky and bulging in appearance. The pad also has to have the ability to transfer heat from the wearer’s body to the environment.
This study aimed to determine the force attenuation, performance relevant to thermophysiological wear comfort (dry thermal resistance, evaporative resistance and permeability), performance relevant to pressure comfort (interface pressure delivery) and density of pads constructed of different textile materials. Materials used in hip protective pads available in the market, materials with some promise for this purpose and materials manufactured for other kinds of impact protective pads were investigated.
Materials and methods
Test materials
In all, 15 materials were evaluated (Table 1). Seven materials currently available on the market were chosen, three of them already in use as commercial hip protective pads (1, 2 and 5) and the remaining eight being materials manufactured for other forms of impact protection. Single jersey-knitted fabrics suitable for use in hip protective garments were used in a fabric assembly for determining dry thermal resistance and evaporative resistance and for the pocket and sleeve in the interface pressure delivery test. These fabrics were made of 92.35% cotton and 7.65% elastane. The wale density was 15 wales/cm and course density was 25 courses/cm. The mean weight per square metre of fabric was 252 g.
Experimental pads.

Test methods
Determination of impact force and force attenuation
Impact force attenuation was determined using a fall impact simulator, which provided an accurate estimate of the peak compressive force applied to the proximal femur during a fall and the reduction in force provided by a hip protective pad. The literature contains various descriptions of mechanical test systems used to evaluate the peak force absorbed by a hip protective pad during a simulated fall. All test systems use a falling mass to generate impact energy; it either falls vertically from a drop tower or in a curved path using a pendulum. 13
For the current research, the drop tower was utilised as the test method. The drop tower was set up as follows. An S-type 9800 N load cell was firmly fixed to a concrete floor. A metal plate was attached to the top side of the load cell using a bolt. Then, a piece of artificial flesh (20 mm thick) was placed on the load cell and the experimental pad placed on top of that (Figure 1).
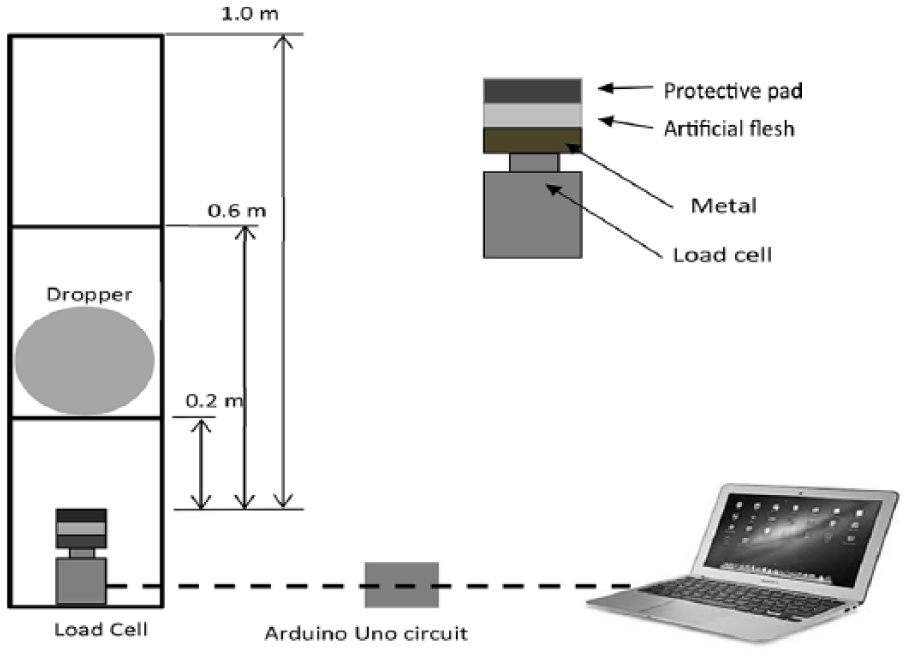
Drop impact test diagram.
The artificial flesh was made of Soft Translucent Silicone, which is commonly used to simulate soft body parts, flesh and skin (www.dalchem.com.au). It had density of 1.1 kg/m3 and shore A hardness of 12, the same properties as the artificial flesh used in previous hip protector testing. 14 Its thickness of 20 mm corresponds to the typical thickness of soft tissue found over the most prominent part of the greater trochanter in female hip fracture patients. 15 The artificial flesh (and the fabric specimen size) was 5 cm × 5 cm, derived from the 5 cm diameter of the average female femur head14,16 and the vulnerable area that projects over the femur. 17
The tower and dropper were placed above the load cell, 18 as shown in Figure 1. The desired impact energy of the dropper was obtained by varying its falling height. The impact force the dropper transferred to the experimental pad was captured by the load cell, which was connected to an Arduino circuit board to record the data. The data were then transferred to a computer using Bluetooth. 18
According to Robinovitch et al., 13 typical speeds of person fall are 2.0 m/s for a mild fall, 3.4 m/s for a moderate fall and 4.5 m/s for a severe fall. The kinematic equation for free fall is illustrated in the following

where V is the speed (m/s), g is the gravity (m/s2) and h is the height (m).
equation (1) can be rearranged as follows

From equation (2), the dropper heights corresponding to fall speeds of 2.0, 3.4 and 4.5 m/s are 0.2, 0.6 and 1.0 m, respectively.
The impact test used a 5 kg dropper. 14 The impact energy of the falling object is

where E is the impact energy (J), m is the mass (kg) and h is the height (m).
The calculated impact energies generated by the 5 kg dropper dropped from three heights were E0.2m = 9.8 J, E0.6m = 29.4 J and E1m = 49 J. The range of experimental impact energies chosen in this study was comparable to those used in previous investigations. 14
At least five trials were conducted for each test condition with a time interval of at least 3 min between subsequent trials to allow for a rebound from deformation of the hip protective pad and simulated soft tissues. 13 The peak impact force (N) was recorded and the mean and standard deviation of five test results per specimen was calculated.
The force attenuation of the experimental pad was calculated as shown in equation (4)

where FA is the force attenuation (N/mm3), fAF is the impact force on artificial flesh (N) and fP is the impact force on the experimental pad (N).
Since the pad thickness varied across the three fabric types, the force attenuation was normalised per unit volume, with the assumption that the effect of thickness of pads on force attenuation is linear and the same in all pads (equation (5))

where VP is the volume of the experimental pad (mm3).
Force attenuation capacity efficiency
where FAeff is the force attenuation capacity efficiency (%), FAFn is the normalised impact force on artificial flesh (N) and F(AF + P)n is the normalised impact force on artificial flesh and experimental pad (N).
Determination of the dry thermal and evaporative resistance of the protective pad and fabric assembly
The thermal and moisture resistance of the pad and fabric assembly was tested using integrated sweating guarded hotplate (iSGHP), manufactured by Measurement Technology Northwest (MTNW). The instrument measures the thermal resistance (Rct) and water vapour resistance (Ret) properties of textile materials. It provides simple, fully automated testing in compliance with the ISO 11092 and ASTM F1868 standards.
The iSGHP was operated by ThermDAC8, automatic control software that performs numerous data analysis functions, including calculation of thermal resistance and area-weighted averages. All of these calculations are performed on data which have been logged to the test-generated .csv file based on a user-defined logging interval. 19 The equations used in calculations are as follows. 19
Dry thermal resistance, Rct
Calculated in SI unit for each zone by the following formula

Rct is the thermal resistance (m2 °C)/W, Tskin is the zone average temperature (°C), Tamb is the ambient temperature (°C) and Q/A is the area-weighted heat flux (W/m2).
Evaporative resistance, Ret
Calculated in SI units for each zone by the following formula
Ret is the evaporative resistance (m2 Pa/W), Psat is the saturation pressure vapour at skin temperature (Pa) and Pamb is the ambient pressure vapour at ambient temperature (Pa).
Permeability index, Im

Im is the permeability index (dimensionless), Rct is the thermal resistance, Ret is the evaporative resistance and K is the constant (60.6515 Pa/°C)
Material intended for the hip protective pad was cut into 13.5 × 13.5 cm2. Knitted fabric of 30 × 30 cm was used as a fabric layer, with a pocket of 21 × 21 cm sewn in its middle. The pad was inserted into the pocket 18 (Figure 2).

(a) Pocket on the fabric, (b) pad inserted into pocket and (c) pad and fabric assembly on SGHP.
The fabric layer sample was carefully positioned over the plate so that there was no air trapped under the sample. Once the sample was in place, the sample hold-down flap was installed. Then, the height of the hotplate was adjusted until the air velocity sensor tip was even with the 7 mm spacer block. It was important that the surface of the sample be 15 mm below the air velocity sensor probe for accurate measurements. Three specimens of each experimental pad were tested, and the averages of the dry thermal resistance and evaporative resistance values were calculated.
Interface pressure delivery
Knitted fabric squares were sewn into sleeve-like tubes resembling the hip section of a hip protective garment, and then, a protective pad was inserted. 20 The experimental sleeves were placed onto a rigid cylinder and the interface pressure generated by the sleeves between the cylinder and the sleeve was measured. The experimental rigid cylinder was 50 cm in circumference and 30 cm in length. The 50 cm circumference was regarded as representative of the circumference of a thigh extending from a hip. 21 The length of the cylinder was determined by the length of the sensor array used for the interface pressure measurement.
The sleeves were 45 cm in length and 32.7 cm in width, so that they provided 10% practical extension in fabric course direction (in the width direction when worn on the cylinder). A seam allowance of 2 cm was added. The pocket for the protective pad was made from the same fabric and was incorporated into the sleeve by seams. The protective pad was manually inserted into the pocket. All pads and sleeves were conditioned and tested in the standard atmosphere of temperature 20°C ± 2°C and relative humidity 65% ± 2%.
The pressure generated by pad and sleeves was measured using a Salzmann pressure-measuring device MST MK IV and Salzmann MST 2007 software. Salzmann consists of a thin plastic sleeve (4 cm wide, 0.5 mm thick), with four paired electrical contact points, connected to an air pump and a pressure transducer. This probe was placed between the cylinder and the compression device. The air pump inflated the sleeve until the contacts opened (when the inner pressure exerted by the air was just above external pressure due to the compression device). When the contacts opened, the transducer read the pressure at each measuring point and the pressure was displayed digitally with 1 mmHg resolution.
The pressure measurement on the cylinder was conducted as follows: the cylinder was positioned vertically on its holder without allowance for movement (Figure 3). The sleeve was carefully positioned on the cylinder over the Salzmann sensor and was spread evenly so there were no folds or kinks or air gaps between the cylinder, the sensors and the fabric. The results were read on the MST portable device. The measurement of pressure induced by the sleeve on the cylinder was repeated three times. The sleeve was removed and re-positioned again before the next measurement was taken and the mean values calculated.
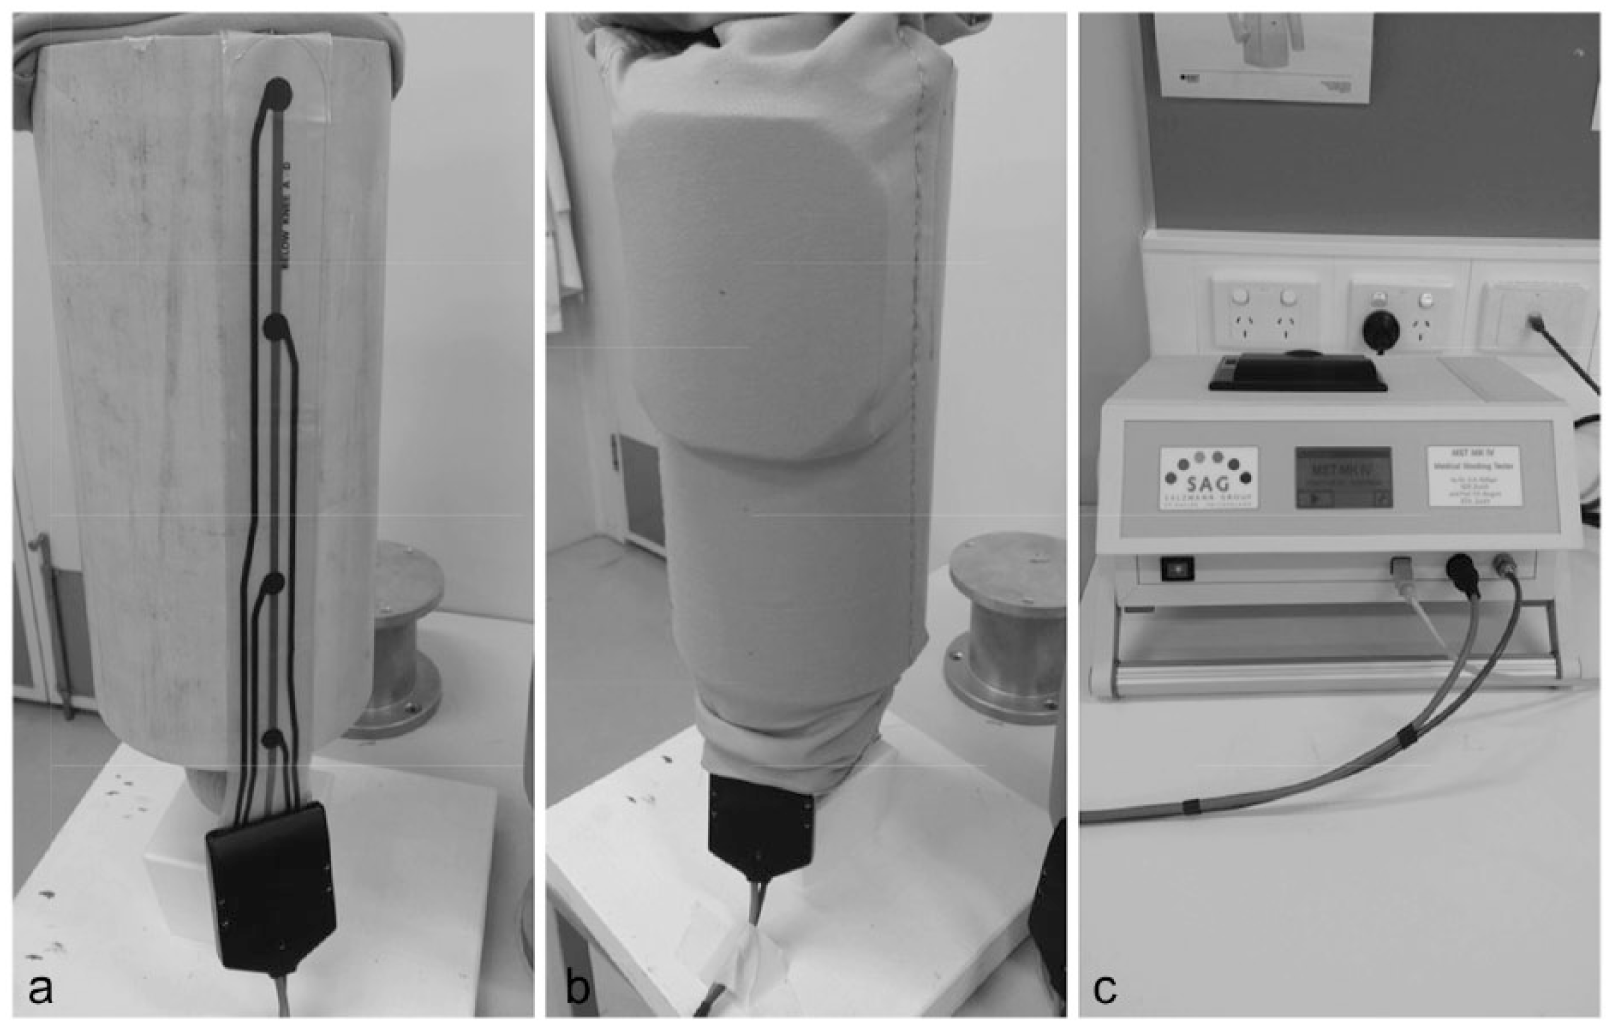
Interface pressure delivery test: (a) sensor over the cylinder, (b) pad inside sleeve pocket over the cylinder and (c) Salzmann MST MK IV.
The experimental pads used in this study were of varying thickness, so it was necessary to normalise the interface pressure delivery. The interface pressure delivery of the sleeve and pad was deduced by the interface pressure delivery of the sleeve only. The result was then divided by pad thickness

where P is the interface pressure delivery of pad normalised by thickness, Ps is the interface pressure delivery of sleeve, Pp is the interface pressure delivery of pad inserted into sleeve pocket and T is the pad thickness.
The above tests were conducted several times per sample, and then, the mean was calculated. One-way analysis of variance (ANOVA) was performed to determine whether there were statistically significant differences among the level means. The null hypothesis (H0) for the test was that all experimental pads had the same force attenuation, permeability index, interface pressure delivery and density. The alternative hypothesis was that one or more experimental pads had different force attenuation, permeability index, interface pressure delivery and density.
Overall experimental pads grading, rating and ranking
The research aimed to determine the experimental pad with the best overall performance. Most experimental pads had different sets of values for the four parameters tested. Moreover, different pads performed best on each parameter, so a procedure that could combine parameter scores to give an overall score was required.
Grading
The grading of the pads was determined as follows:
1. The range value of the parameter was determined by the formula

where R is the range value, H is the highest value and L is the lowest value.
2. The number of the grade was determined by Sturge’s rule

where N is the number of grade and n is the number of experimental pads.
3. The width of grades was determined by the formula

where W is the width of grades, R is the range value from equation (10) and N is the number of grade from equation (12).
4. Best/worst grade determination. The best grade was determined by the highest number. For example, since there are five grades in total, Grade 5 is the best grade and Grade 1 is the worst grade. For the parameters where higher values are preferable, such as permeability index and force attenuation, if their values were low: the lowest value was placed in Grade 1 and the highest value was placed in Grade 5. For example, the range of permeability index values is from 0 to 1. The highest permeability index value 1 was placed to Grade 5 (the best), and the lowest permeability index value of 0 was placed to Grade 1 (the worst). Conversely, for the parameters where lower values are preferable, such as mass and interface pressure delivery, if their values were low, the lowest value was placed in Grade 5 and the highest value was placed in Grade 1. For example, if the range of interface pressure delivery values is from 2 to 10 mmHg, the highest value of interface pressure delivery value of 10 mmHg was placed to Grade 1 (the worst), and the lowest value of interface pressure delivery of 2 mmHg was placed to Grade 5 (the best).
Rating
The rating of each pad was determined as follows. Each parameter was weighted with a different value: force attenuation − 0.35, mass − 0.30, permeability index − 0.20 and interface pressure delivery − 0.15. Experimental pad force attenuation was assigned the highest weight because the main purpose of the pad is to protect the human body from the impact of the fall. Experimental pad mass was considered to be the second-most important for the protective pad, as the mass of the pad has to be low to avoid weight burden to the wearer, so was assigned a slightly lower weight than force attenuation. Permeability was considered the third most important attribute of the protective pad and was given the third highest weight. The pad has to have high permeability index so that the pad can transmit heat and moisture from the body to the environment. The interface pressure delivery weighed value was the smallest, but still an important attribute of the protective pad.
1. The rating of the pad in each parameter was calculated by the formulae


where G is the experimental pad grade, N is the number of grade from Equation (11), RFA is the force attenuation rating, RM is the mass rating, RIM is the permeability index rating and RPD is the interface pressure delivery rating.
2. The overall rating of the pad was calculated by the following formulae


where OR is the overall rating, RFA is the force attenuation rating from equation (14), RM is the mass rating from equation (15), RIM is the permeability index rating from equation (16), RPD is the interface pressure delivery rating from equation (17) and F is the impact forces on experimental pad.
Ranking
The ranking of the experimental pad was determined by sorting the ORs from the highest to the lowest value.
Results and discussion
Impact force, force attenuation and force attenuation efficiency
Figure 4 presents the impact force on the experimental pad under applied energy of 49 J. Almost all the experimental pads’ impact force values (other than pad B’s) lay below the 2500 N force threshold. Hence, 14 of 15 experimental pads would be effective in protecting the hip bone in a fall. The impact force value of artificial flesh alone was greater than 2500 N, indicating that the unprotected hip bone would be broken in a fall. One-way ANOVA test showed that significant differences existed between the impact force values of the experimental pads (p < 0.05).

Impact force on experimental pad under 49 J applied energy.
The pads had different thicknesses, so Figure 5 presents the force attenuation capacities of the experimental pads normalised by their volume. Pad 10, made from treated knitted spacer fabric, had the highest force attenuation capacity and was therefore the best material for a protective pad in terms of force attenuation alone.

Force attenuation capacity of experimental pads normalised by volume.
In general, knitted spacer fabrics treated with shear thickening fluid (STF) had high force attenuation. Treated experimental pads 8, 11 and 13 had similar force attenuation capacity value to experimental pad 3 (made of polyurethane closed-cell foam, the standard material for protective pads).
Force attenuation capacity efficiency
Robinovitch et al. 13 calculated the force attenuation capacity efficiency of a protective pad as

In this study, equation (20) was changed into equation (6).
The force attenuation capacity efficiency of the 15 experimental pads determined using Robinovitch’s approach and equation (6) is displayed in Table 2. Values in Table 2 were sorted from largest to smallest. The rank orders derived using the Robinovitch approach and Equation (6) are not identical, but are highly correlated (Pearson’s r = 0.80). Note that using Robinovitch’s approach, pad G has the lowest rank, but according to Equation (18), pad B has the lowest rank. This is because the impact force on pad B was higher than 2.5 kN, so it would not protect an elderly woman’s hip bone from a fall impact.
Force attenuation capacity efficiency of experimental pads using the Robinovitch approach (Eff.%) and equation (18) (FA).

Dry thermal resistance, evaporative resistance and permeability index
Figure 6 presents the dry thermal resistances of the experimental pads. ANOVA detected significant differences between these values (p < 0.05). Experimental pad E had the highest dry thermal resistance (p < 0.05), undoubtedly because it was the thickest pad. Other dry thermal resistance values were similar due to the experimental pads having similar thicknesses. Low dry thermal resistance is preferred, because it prevents the protective pad from being perceived as ‘too hot’ by the wearer.
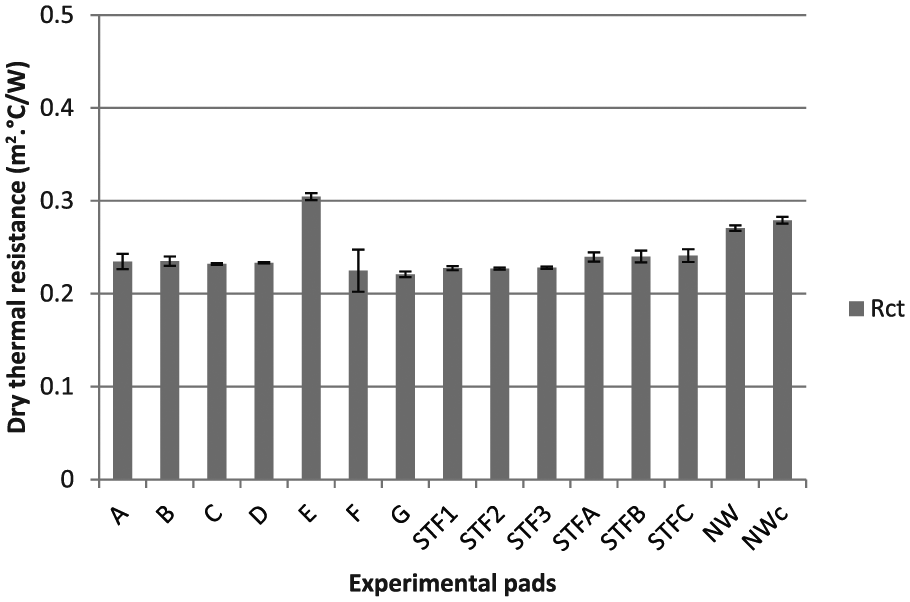
Dry thermal resistance of experimental pad.
Figure 7 presents the evaporative resistances of the pads. ANOVA revealed the existence of significant differences between them (p < 0.05). The pads made of closed-cell foam and of gel had higher evaporative resistance than those made of knitted spacer fabric and of vertical nonwoven fabric. The lower evaporative resistance of knitted spacer fabric and of the vertical nonwoven fabric is due to the relatively open structure of these fabrics. Low evaporative resistance is a desirable characteristic in a protective pad.
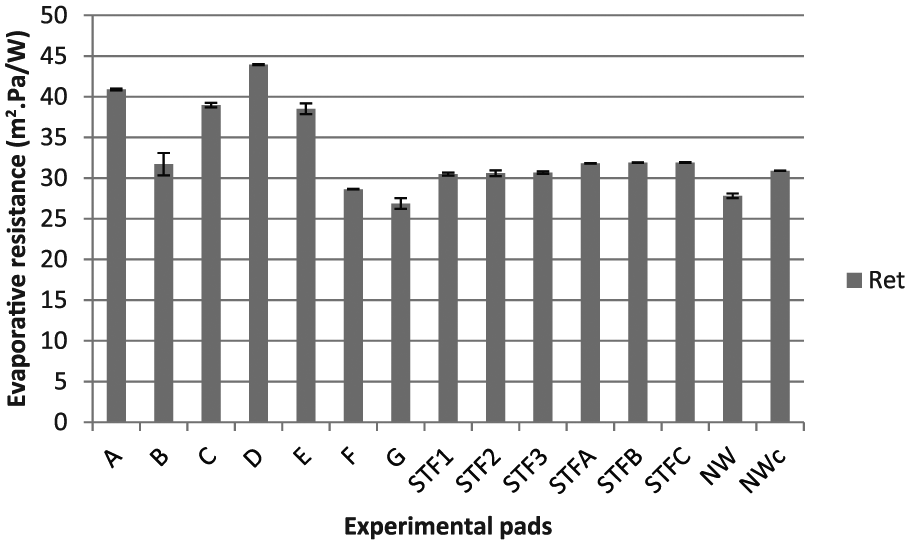
Evaporative resistance of experimental pads.
Significant differences existed in this set of permeability indices (p < 0.05). Figure 8 illustrates the permeability indices of the experimental pads: Pad D, made of gel, and pad A, made of polyurethane closed-cell foam, had the lowest permeability indices, because their relatively solid structure and morphology make it difficult for the moisture to be transferred to the environment. Experimental pad NW had the highest permeability index. The pore structure of pad NW (made of vertical nonwoven fabric) allows heat and moisture to be transferred readily from the wearer’s body to the environment.

Permeability index of experimental pads.
Pad density
Hip protective pads need to be as light as possible to avoid becoming a burden to elderly wearers. Figure 9 demonstrates the masses of the experimental pads normalised by their volume (density); significant differences exist (p < 0.05). Experimental pad D (made of gel) had the highest mass, and pad NW (made of nonwoven fabric) the lowest mass, making NW the best material for a protective pad on this criterion.

Mass of experimental pad normalised by volume.
Interface pressure delivery
The mean interface pressure delivery values of the experimental pads are illustrated in Figure 10. It indicates that the addition of the experimental pad to the sleeve increased the interface pressure delivery value. Pad C inserted into the sleeve pocket generated the highest interface pressure delivery value among all experimental pads, and therefore, it can be assumed that such pressure over larger areas might be perceived uncomfortable.

Pressure delivery by experimental pads.
Since the experimental pads varied in thickness, the interface pressure delivery value was normalised by pad thickness (Figure 11). ANOVA revealed the existence of significant differences between the interface pressure delivery values of the pads (p < 0.05). Once again, experimental pad C (made of polyurethane closed-cell foam) generated the highest interface pressure delivery, possibly due to its inflexibility: when the pad was inserted into the pocket of the fabric sleeve, it did not adjust to the cylinder contour.

Pressure delivery value of experimental pads normalised by thickness.
Experimental pads made of knitted spacer fabric and vertical nonwoven fabric demonstrated low interface pressure delivery values due to being flexible and conforming well to the cylinder contour. Pad B had the lowest interface pressure delivery value and therefore scored highest on this parameter.
Overall grading, rating and ranking of experimental pads
Figure 12 presents the fingerprints of experimental pad grading by individual performance parameters. Each individual parameter had five possible grades: Grade 1 was the worst grade and Grade 5 was the best. To determine the best experimental pad overall, the rating and ranking of the pads were carried out.

Fingerprints of experimental pad grading.
Table 3 presents the ratings and ranks of the experimental pads. The four highest ranked pads were the vertically lapped nonwoven and treated knitted spacer fabric pads. The lowest ranked pad was pad B, since it had impact force above 2500 N.
Experimental pads rating and rank.

Conclusions
An evaluation of 15 materials either in use or with potential for use in hip impact protective pads was conducted. The STF3 pad, made of treated knitted spacer fabric, had the highest force attenuation and therefore best impact protection attributes. In terms of permeability index and material mass (important parameters for materials worn close to the human body), the NW pad, made of vertical nonwoven fabric, performed best. Almost all of the experimental pads (other than pad C) had similarly low interface pressure delivery, which relates to wear comfort.
Different weights were applied to the parameters and overall performance ratings calculated. Four novel manufactured materials had the highest ratings. These novel materials had high force attenuation capacity, meaning that they could effectively protect the hip bone. Simultaneously, they had relatively high permeability indices, so would allow heat and vapour to be transferred efficiently from the wearer’s body to the environment. These pads also had low interface pressure delivery and low mass, so they would not feel heavy and uncomfortable, making them suitable for hip protective pads for elderly women. In summary, this research shows that vertically lapped nonwoven fabric and treated knitted spacer fabrics are plausible alternative materials to closed-cell foam for use in hip protective pads.
Footnotes
Declaration of conflicting interests
The author(s) declared no potential conflicts of interest with respect to the research, authorship and/or publication of this article.
Funding
The author(s) received no financial support for the research, authorship and/or publication of this article.