
Abstract
The speed of liquid planar transmission plays a key role in engineering applications, including baby wipes, wound dressings, and liquid filtration. This article reported a novel branched nonwoven consisting of melt-blown polyethylene glycol/polypropylene micro- and nanofibers. The formation mechanism of branched structures as well as the liquid planar transmission properties of the prepared polyethylene glycol/polypropylene micro-nanofibrous nonwovens was discussed in detail. The results showed that the diameter of melt-blown fibers could be controlled by changing the percentage of polyethylene glycol (0–15 wt%) and die temperature (230°C–250°C). Furthermore, micro- and nanofibers, which had three types of size: >2 μm, 800 nm–2 μm, and <800 nm, formed a three-level branched network, which greatly improved the liquid planar transmission capacity. This work suggested that the branched micro/nanofiber nonwovens could be employed in a wide range of potential engineering applications.
Introduction
Liquid planar transmission exists in industrial nonwovens, such as baby wipes, wound dressings, and liquid filtration.1–5 And the speed of liquid planar transmission is a crucial factor that affects the properties and value of nonwoven products. Generally, the introduction of nanofibers into the nonwovens is often utilized in strengthening the speed by enhancing the surface area.6,7 Heterogeneous nonwovens, which were characterized with the branched networks made of micro-nanofibers, have been studied widely.8–11 The branched network structure is common in nature, such as the vascular systems of animals, rivers, trees, and leaf veins of plants. In addition, successful branched engineering materials including the fabrics with tree-like structure have been developed for exceptional properties in water transportation.12,13
Previous research has shown that the branch radii of branched network were optimized for driving water with minimum flow resistance.14,15 Murray 16 reported the optimal radius ratio between the parent and daughter branches for the least expenditure of energy, as shown in equation (1). Furthermore, the driving force for the liquid in fabrics was capillary force, which was dependent on the branch microstructure, such as the branch diameter, branch number, and branch density. Thus, the capillary force varied in different levels of branches17,18
where βm is the diameter ratio of daughter and parent channels, N is the branching number, Δ is the parameter depending on practical application, and Δ = –1/3 for laminar flow.
Melt blowing, as a well-known technology, could produce micro-nanofiber nonwovens with three-dimensional networks in a single step by extruding polymer melt through an orifice die followed by a fluid drawing via the high-speed hot-air jet.19,20 Meanwhile, due to the solvent-free process, melt blowing is an environmental-friendly method for highly efficient production of micro-nanofiber nonwovens in comparison with the solution electrospinning, direct spinning, and conjugate-splitting spinning.21,22
At present, the modified melt-blowing technologies, including modifying polymer properties and melt temperature, have recently been investigated to reduce fiber diameter and control the distribution of fiber diameter.23–26 Zhao and Wadsworth 27 added polyethylene terephthalate (PET) to polypropylene (PP) to fabricate the melt-blown nonwovens, finding that the fiber diameter distributions were broadened from dozens of micrometers to a few micrometers. Wang et al. 28 prepared the melt-blown nanofiber nonwovens of blended polymer with sulfopolyester and polybutylene terephthalate. They attributed the hierarchical nanofibers-in-microfiber structure to immiscibility of the blend polymer. According to the above, it is possible to prepare micro-nanofiber nonwovens with a wide fiber diameter distribution by melt blowing a variety of noncompatible thermoplastic polymers with great viscosity difference. Nonetheless, it is still a great challenge to realize the branched structure in micro-nanofiber nonwovens with the usage of a conventional melt-blowing process.
In this article, polyethylene glycol/polypropylene (PEG/PP) micro-nanofiber nonwovens with wide diameter distributions were successfully fabricated by the melt-blowing process for fast water planar transmission. Later, the effect of polyethylene glycol (PEG) contents on the branched morphologies of the melt-blown nonwovens was investigated. In addition, the liquid planar transmission of the prepared materials was studied in detail.
Experiment
Materials
PP resins (melt flow index (MFI) = 1525 g/10 min (6.2 kg at 240°C), isotacticity > 97%) were purchased from Guangzhou Wei Yi Synthetic Material Co., Ltd, China. PEG resins (molecular weight = 3600–4400, melting point = 54°C) were provided by Jiangsu Haian Petroleum Chemical Factory, China. And hydrophilic finishing agent (viscosity = 1030 mPa s, pH = 6–7) was brought from Goulston Technologies, Inc., USA.
Preparation of PEG/PP micro-nanofiber nonwovens
The melt-blowing process can convert polymeric raw materials into micro-nanofiber nonwovens in one step (Figure 1(a)). First of all, PP chips were mixed into PEG melt at 90°C and were quenched to PP/PEG chips at room temperature. Subsequently, the PP/PEG chips were fed into the extruders and melted to the mixed melt at the desired temperature. Then, the mixed melt was forced through the die consisting of a row of orifices, which resulted in melt jets. The melt jets were drawn to the fibers by high-speed hot air, as presented in Figure 1(b). Later, the fibers were collected on the moving belt, forming nonwovens of PEG/PP micro- and nanofibers. Finally, the samples were dried at 50°C after hydrophilic finishing (finishing agent in 1 wt%). The processing parameters, such as extruder temperature, air temperature, collector speed, and die hole diameter, are provided in Table 1. And the percentage of PEG was set to be 0–15 wt%.

(a) One-step formation of melt-blown nonwovens consisting of PEG/PP micro-nanofibers; (b) drafting process by high-speed hot air; (c) SEM images of the samples; (d) network models of leaf veins (main branches (radius r0), secondary branches (radius ri), and superfine branches (radius rj)); (e) photograph of leaf veins.
Main production settings.

Characterization of the PEG/PP micro-nanofiber nonwovens
According to the ISO Standard 9073-1:1989, “Textiles—Test methods for nonwovens—Part 1: Determination of mass per unit area,” the mass per unit area of the samples were tested. Per the ISO Standard 9073-2:1995, “Textiles—Test methods for nonwovens—Part 2: Determination of thickness,” the thickness of the sample was measured with the usage of an YG141D digital fabric thickness meter (Wenzhou Darong Textile Instrument Co., Ltd, China). And the sample properties are indicated in Table 2.
Codes, surface densities, thickness, and porosities of the samples.

PEG: polyethylene glycol.
To observe the fiber morphology, the samples were sputtered with a thin layer of Au and observed by scanning electron microscopy (SEM) (MERLIN Compact; Zeiss, Germany). The fiber diameter and fiber diameter distribution were calculated utilizing the ImageJ software (National Institutes of Health, USA). Furthermore, the liquid spreading speed and the wicking height were examined by the pendant drop approach as described previously. 29 The samples were tested after storing under the condition of 25°C and 65% humidity for 24 h. The distilled water of 20 µL was injected onto the sample surface through a microinjector, which was fixed at 5 cm above the samples. The diffusion area of the sample surface was recorded by the camera with a resolution of 1920 × 1080 pixels. Subsequently, the images were tested by the ImageJ software.
Results and discussion
Morphologies
It is observed from Figure 1(c) that PEG/PP micro-nanofiber nonwovens consisted of fibers with different sizes: >2 µm, 800 nm–2 µm, and <800 nm. These fibers of different diameters formed a three-level branched network, as shown in Figure 1(d), which was close to the branched networks of vein leaf (Figure 1(e)).30,31
Figure 2 displays the SEM images of the sample surface and cross-section. It can be observed from Figure 2(a) that the fibers were randomly arranged in the horizontal direction and overlapped with each other on the surface and inside of the samples. The coarse fibers with diameters above 2000 nm overlapped with each other and formed large gaps, while the microfibers (800–2000 nm) and nanofibers (<800 nm) were located beside the gaps, which formed a network of coarse-fiber branching multiple microfibers as well as nanofibers in the horizontal direction. In Figure 2(b), the PEG/PP micro-nanofiber nonwovens were made up of multi-layer thin fiber layers, and each fiber layer was also considered as a branched network. Hence, it can be considered that the fiber layers, as three-level branched networks, provided a structural basis to strengthen the liquid transmission.
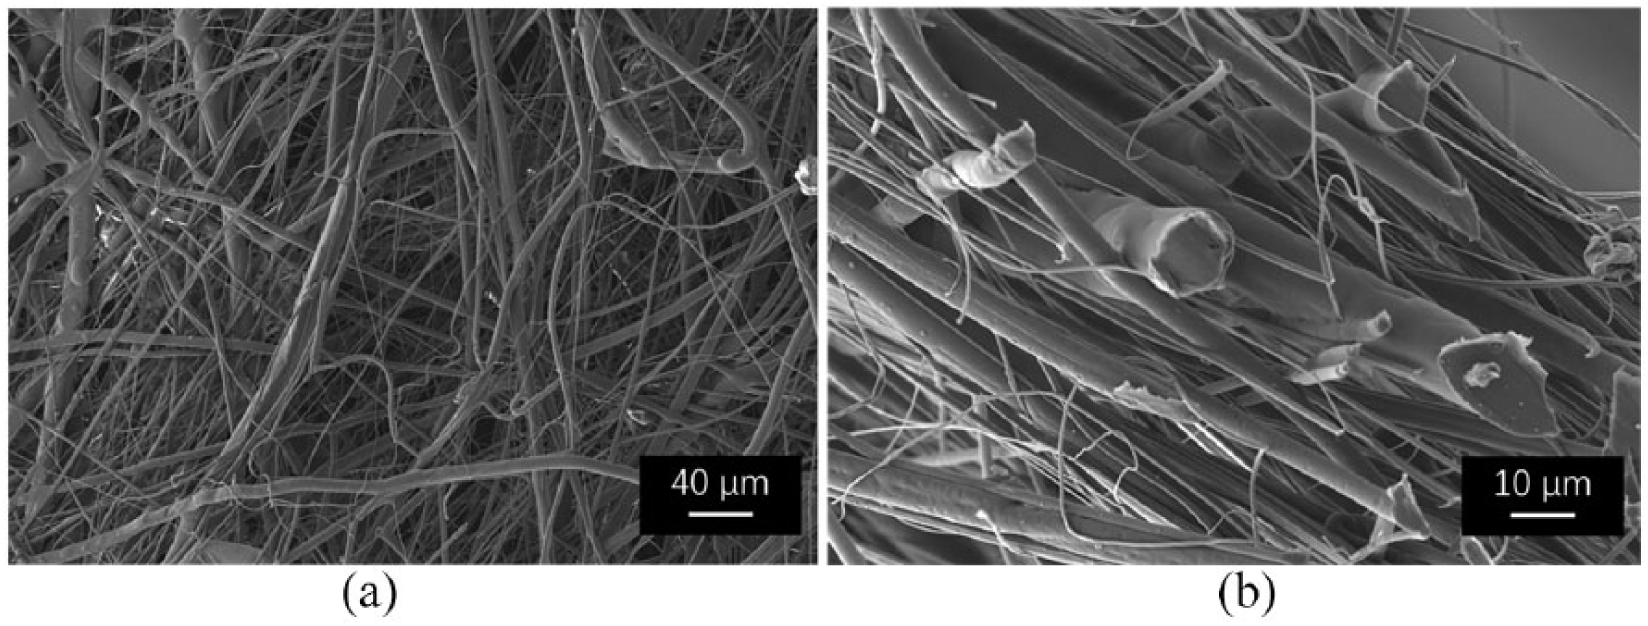
(a) Surface and (b) cross-section SEM images of the samples.
The formation mechanism of the branched networks
Figure 3(a) presents the comparison curves of the thermal–rheological properties of the PEG/PP blend resins under the condition of the same shear rate at 240°C. According to Figure 3(a), the apparent viscosity of the PEG/PP blend resins was lower than that of pristine PP, which demonstrated that the addition of PEG can help reduce the viscosity of PP to obtain the nanoscale-level fibers. The differential scanning calorimetry (DSC) figures of both PP and PEG/PP nonwovens are shown in Figure 3(b). It can be seen from this figure that the melting enthalpy slightly reduced with the addition of PEG, which directly explained that the addition of PEG “destroyed” the macromolecules of PP so that the apparent viscosity of the PEG/PP blend resins was lower than that of pure PP. The reason might be that the microphase separation occurred between the incompatible melts of PP and PEG in the air drafting process. And these two incompatible melts were mixed to form the continued-blended melt with the fluctuated viscosity, and the low-viscosity melt zone would undergo thinning and microphase separation from the high-viscosity melt zone under the low viscous force and air drag force. On the one hand, the addition of PEG, which was incompatible with PP, 32 significantly reduced the melt viscosity.4,33 On the other hand, the die hole diameter used in the experiment was 0.25 mm, which was smaller than that of the conventional die hole (0.3–0.4 mm). As a result, the branched PEG/PP micro-nanofiber nonwovens consisting of micro- and nanofibers would be fabricated under the synergistic combination of the microphase separation and the air drag force in the melt-blowing process.

(a) Comparison curves of the thermal–rheological properties of pristine PP and PEG/PP blend resins under the condition of the same shear rate at 240°C; (b) the DSC figures of the PP and PEG/PP nonwovens.
Structural parameters of branched networks
Branch diameter characterized by fiber diameter
The branches in the vein networks had different ratios and numbers, and the capillary flow had different sensitivities to the microstructures of local branches at different levels. Thereby, structural parameters, such as branch diameter, branch number, and vein density, were very essential to characterize the effectiveness of the horizontal branching structure.
According to the water wicking relying on the capillary force, the branch diameters could be characterized by the fiber diameter, the number of fibers with different diameters utilized to characterize the branch number, as well as the vein density characterized by the specific length of the fiber webs.
It can be observed from Figure 4 that the SEM images of the PEG/PP micro-nanofiber nonwovens were formed with the die-to-collector distance (DCD) of 200 mm and the die temperature of 240°C at different PEG concentrations, including 0 (pristine PP), 5, 10, and 15 wt%. According to Figure 4, the samples of the PEG/PP micro-nanofiber nonwovens were regarded as the branched networks of the three-level branch structures composed of fibers of <800 nm diameter, microfibers of 800–2000 nm diameter, and fibers of >2000 nm diameter. The nanofibers with diameter < 800 nm were considered as the third level of the branched structure, microfibers of 800–2000 nm as the second level, and fibers of >2000 nm diameter as the first level.

SEM images of the PEG/PP micro-nanofiber nonwovens were formed with the DCD of 200 mm and the die temperature of 240°C at different PEG concentrations: (a) 0 wt% (pristine PP), (b) 5 wt%, (c) 10 wt%, and (d) 15 wt%.
Branch number characterized by fiber diameter distribution
Figure 5 shows the fiber diameter distribution of samples with varying PEG percentage and die temperature. It can be seen that the PEG percentage had a significant effect on the fiber diameter distribution, as indicated in Figure 5(a). First, the number of fibers with diameter < 800 nm increased with the increasing percentage of PEG. The frequency of the fiber number with the diameter of <800 nm increased from 40.63% to 63.64% with the growth of the PEG percentage being raised from 8 to 15 wt%. Second, the increasing trend slowed down gradually. Third, the frequency of the fibers with diameter > 2000 nm as well as the fibers with the diameters ranging from 800 nm to 2000 nm decreased with the increasing percentage of PEG. Nonetheless, the reduction rate slowed with the increase of the PEG percentage. Then, the growth of die temperature increased linearly with the number of fibers with diameter < 800 nm (Figure 5(b)). When the die temperature is increased from 230°C to 250°C, the frequency of the fiber with diameter < 800 nm rose from 54.12% to 63.6%. Furthermore, the ratio of the fibers with diameter > 2000 nm and in the range of 800–2000 nm both reduced linearly with the growth of the die temperature. The possible reason for such phenomena is that, in the melt blending system of PEG and PP, the small PEG molecules were dispersed into the PP macromolecular chains, which reduced the melt viscosity. The increase of die temperature and PEG percentage would enhance the fluidity of melts which formed small-diameter fibers by hot-air drafting. 34 Furthermore, low compatibility between PEG and PP was one of the major reasons for the differences in fiber diameter. It could be understood that the fiber number with different diameters could be adjusted by controlling the PEG percentage and die temperature. It means that the branch number (fiber number) of the samples for the branched networks of PEG/PP micro-nanofiber nonwovens might be regulated through the melt-blowing process for rapid liquid diffusion.

(a) Fiber diameter distribution of samples with varying PEG percentage with the DCD of 200 mm and the die temperature of 240°C; (b) fiber diameter distribution of the samples with varying die temperature and the DCD of 200 mm at the PEG concentration of 10 wt%.
Vein density characterization by specific length
Nonwovens could be considered as a fiber aggregate made up of N fiber webs. Assuming that the thickness of a fiber web was two times the probability diameter, 35 the defined probability diameter served as a function of fiber diameter, and the specific length σ (representing the total length of fibers per unit area of fiber webs) was described by formula (2)

where σ is the specific length of the fiber webs (m−1); µg refers to the mass per unit area of the sample (g/m2); ρf denotes the fiber density (g/m3); Df1 means the probability diameter (m); Th denotes the sample thickness (m); d1 is 800 nm, d2 is 1500 nm, and d3 is 4000 nm; v1 refers to the frequency of the <800-nm fiber number (%); v2 refers to the frequency of 800–2000 nm fiber number (%); and v3 means the frequency of the >2000-nm fiber number (%).
It can be observed from Figure 6 that the fiber diameter distribution of the samples varied with PEG percentage (a) and die temperature (b) with a DCD of 200 mm. According to Figure 6(a), the relationship between the specific length and PEG percentage was a logistical function for the samples of the horizontal branching of the PEG/PP micro-nanofiber nonwovens. The possible reason might be that the number of fibers with diameter < 800 nm increased with the growth of the PEG percentage. The number of fibers in the unit volume increased under the condition of constant fiber density and mass per unit area. It can be seen from Figure 6(b) that, under the condition of steady PEG percentage (10 wt%), the specific length was linear with the die temperature. As the die temperature is increased from 230°C to 250°C, the specific length grew from 115,125.2 to 132,205.8 m−1. It could be attributed to the higher die temperature to the lower blend melt viscosity, which resulted in the increase in the number of thin fibers.

Fiber diameter distribution of the samples with varying (a) PEG percentage at 240°C and (b) die temperature with 10 wt% PEG.
Liquid planar transmission properties
Figure 7 illustrates the water wetting area varying with time for the samples with the PEG percentages of 5, 10, and 15 wt%. And the photographs of the wetting area of the sample with the PEG percentage of 10 wt% at different times are shown in Figure 8. First of all, it can be seen that the wetting area increased with the growth of time. The diffusion process of all the samples indicated the rapid increase of the wetting area at the beginning stage, and then the increase of the wetting area decreased gradually. It means that the curve of the wetting area varying with time presented a trend of “fast rise–slow increase.” In addition, in the range of the PEG percentage from 5 to 15 wt%, the water diffusion rate and the wetting area at the end of diffusion all increased with the growth of the PEG percentage. Finally, when other conditions remained unchanged, the increase of the water diffusion rate could be attributed to the boosting of the breached characteristic results by increasing the PEG ratio for the samples of the PEG/PP micro-nanofiber nonwovens.

Liquid diffusion area varying with time for samples.

Photographs of the wetting area of the sample with 10 wt% at different times: (a) t = 0.00 s, (b) t = 0.04 s, (c) t = 0.91 s, (d) t = 1.56 s, (e) t = 1.93 s, (f) t = 2.57 s, (g) t = 3.93 s, and (h) t = 4.93 s.
As illustrated in Figure 8(a) to (h), the wetting area increased rapidly at the beginning stage. During this period, the water droplet contacted the sample surface and then rapidly entered the internal area of the sample. And the main driving force might be gravity,18,36 as shown in Figure 8(a). At the diffusion stage of Figure 8(b), the wetting area rapidly increased over time. The droplets were mainly diffused within the samples, and the main driving forces were the capillary force and potential water pressure. At the same time, since the droplets acted on the fiber surface and spread along the direction of fibers, and the fibers were mainly arranged along the longitudinal direction, the wetting area gradually became oval shaped. As indicated in Figure 8(c), the steady increase of the wetting area occurred under capillary action in the next stages. From the above discussions, it can be seen that the wetting area of the samples with branched networks was followed by the typical behavior of water. 37
As shown in Figure 9, the needle-punching nonwovens with 100 g/m2, the needling density of 500,000 punches/m2, and the thickness of 4.06 mm were made of PP staple fibers (cylindrical, fiber diameter 2.5 denier, fiber length = 51 mm) and were also investigated for comparison in the literature. 38 The wicking height of the samples was bigger in the machine direction than the cross direction, which might be attributed to the fact that a large number of fibers were arranged along the machine direction, and the gravity and resistance that the liquid needed to overcome when it climbed under the capillary force. Meanwhile, the needle-punching nonwovens showed smaller wicking and larger height than the samples in the machine direction. This result might be explained by the fact that the smaller the microfiber diameters, the larger the surface area-to-volume ratio resulting in the bigger driving force of the Laplace pressure. This indicated that the water transport capacity could be improved by enhancing the branched characterization of the PEG/PP micro/nanofiber nonwovens.

Comparison of wicking height between the samples with 15 wt% PEG and the needle-punching nonwovens in the literature.
Conclusion
The branched networks of the PEG/PP micro-nanofiber nonwovens were produced in one step by controlling the ratio of PEG in the blend and other process parameters. The fiber diameter distribution could be adjusted by the PEG percentage and the die template. The results showed that the diameters of the three types of fibers were <800 nm, 800–2000 nm, and >2000 nm, respectively. The addition of PEG (0–15 wt%) and the increase of the die temperature (230°C–250°C) greatly impelled the melts to form more fibers with diameter < 800 nm, which could increase the probability of the formation of branched networks between nano- and microfibers. Furthermore, the water transport behavior of the branched nonwovens showed that the increase of the percentage of nanofibers (<800 nm) based on the branched structure could increase the liquid planar speed, which demonstrated the structural effectiveness of the hierarchical branched networks of the PEG/PP micro-nanofiber nonwovens. It is suggested that nonwoven is a good candidate for engineering applications, such as baby wipes, wound dressings, and liquid filtration.
Footnotes
Declaration of conflicting interests
The author(s) declared no potential conflicts of interest with respect to the research, authorship, and/or publication of this article.
Funding
The author(s) disclosed receipt of the following financial support for the research, authorship, and/or publication of this article: This work was supported by the National Key R&D Program of China (2017YFB0309100), Collaborative Innovation Center of Textile and garment industry, Henan Province (2017CYY005), Subsidized Project of Henan Science and Technology Research Program (182102210518), Youth Talents Innovative Ability Program of Zhongyuan University of Technology (K2018QN011), and Training Plan for Young Backbone Teachers of Zhongyuan University of Technology (2018XQG04).