
Abstract
There is a continuous worldwide increase in incidences of metabolic syndrome (MetS) reaching about a quarter of the world’s population. Thus, studies that allow for a robust diagnosis of MetS are of paramount importance from an economic and medical point of view. This study was carried out in a group of men diagnosed with MetS using consensus definition criteria that included the definitions of the International Diabetes Foundation and Diabetes Federation and the American Heart Association/National Heart, Lung, and Blood Institute. The control group consisted of men for whom the parameters that define the MetS were in the norm. This study analyzed statistical differences between MetS and healthy men and the correlations between the set of 14 potential markers of MetS, that is, between body mass index, total cholesterol, high-density lipoprotein cholesterol, low-density lipoprotein, triglycerides, cortisol, adiponectin, monocyte chemotactic protein-1 (MCP-1), C-reactive protein (CRP), adipsin, leptin, resistin, and plasminogen activator inhibitor-1 (PAI)-1. This report revealed a significant difference between MetS and healthy men in most of the parameters studied. Furthermore, a strong positive correlation between cortisol levels and body mass index was demonstrated. Furthermore, MCP-1 levels in men with MetS were significantly higher than their levels in healthy men. Finally, a strong positive correlation was also observed between adiponectin and adipsin in Mets men. Thus, this study reveals the potential usefulness of adiponectin, MCP-1, adipsin, leptin, resistin, and PAI-1 as markers of MetS in adult men.
Introduction
Metabolic syndrome (MetS) is a disorder generally defined by an interaction of factors such as elevated waist circumference (WC), elevated levels of triglycerides (TG), reduced levels of high-density lipoprotein cholesterol (HDL-C), elevated blood pressure, and elevated plasma glucose levels (Borges et al., 2010). However, it is not the only definition of MetS. During the last two decades, seven definitions of MetS were proposed: (a) the National Cholesterol Education Program (NCEP) Adult Treatment Panel-III (ATP-III) definition (“Executive Summary of the Third Report,” 2001), (b) World Health Organization (WHO) definition (WHO, 1999), (c) the European Group for the Study of Insulin Resistance (EGIR) definition (Balkau & Charles, 1999), (d) the International Diabetes Foundation (IDF) definition (Zimmet et al., 2005), (e) American Association of Clinical Endocrinology definition (Einhorn et al., 2003), (f) American Heart Association/National Heart, Lung, and Blood Institute (AHA/NHLBI) definition (Grundy et al., 2004), and (g) Consensus definition (incorporating IDF and AHA/NHLBI definitions) (Alberti et al., 2009).
An interplay of parameters defining MetS can lead to an increase in the risk of occurrence of diseases with a high socioeconomic impact, such as coronary heart disease (Ballantyne et al., 2008), cardiovascular atherosclerotic diseases (Tune et al., 2017), and diabetes mellitus type 2 (T2DM) (Shin et al., 2013). Research has also shown that MetS may also be responsible for mild cognitive impairment leading to dementia (Pal et al., 2018). However, in recent years more metabolic abnormalities caused by MetS have been discovered. They include nonalcoholic fatty liver disease (Paschos & Paletas, 2009), sleep apnea (Castaneda et al., 2018), and pro-inflammatory states (Emanuela et al., 2012).
The worldwide prevalence of MetS depends on gender, race, and ethnicity (Cornier et al., 2008) and used MetS criteria (Kassi et al., 2011; Parikh & Mohan, 2012). The epidemiological study (Saklayen, 2018) revealed a continuous worldwide increase in MetS incidences. MetS occurrence is estimated to be 3 times more common than T2DM incidences (O’Neill & O’Driscoll, 2015). Therefore, about a quarter of the world’s population may be affected by MetS (Saklayen, 2018).
Recent studies revealed that factors defining MetS are almost always associated with unhealthy lifestyles (Lin et al., 2019), unhealthy diet (Suliga et al., 2015), and low levels of physical activity (Ko et al., 2016) associated with poor physical fitness (Turi et al., 2016).
The study also showed that in addition to standard MetS markers such as WC, body mass index (BMI), and serum lipid levels including TG and HDL-C (Balkau & Charles, 1999; “Executive Summary of the Third Report,” 2001; WHO, 1999; Zimmet et al., 2005), levels of adiponectin (Padmalayam & Suto, 2013), monocyte chemotactic protein-1 (MCP-1; Trøseid et al., 2004), C-reactive protein (CRP; Devaraj et al., 2009), adipsin (Tafere et al., 2020), resistin (Gupta et al., 2011), and plasminogen activator inhibitor-1 (PAI-1; Alessi & Juhan-Vague, 2006) can be considered as potential MetS markers. Furthermore, some reports stated that the forementioned parameters can separately be indicative of MetS and are markers of subclinical inflammation. The aim of this study is to verify these observations and to perform a comprehensive analysis of the correlation between these parameters. Accordingly, to the best of our knowledge, such study has never been conducted. Therefore, this study scheme is a complex analysis of the relations between BMI, total cholesterol (TC), HDL-C, low-density lipoprotein (LDL-C), TG, cortisol, adiponectin, MCP-1, CRP, adipsin, leptin, resistin, and PAI-1 in randomly selected male subjects with MetS.
Materials and Methods
The study was carried out according to the Declaration of Helsinki of the World Medical Association (WMA, 2001).
Institutional Ethics Clearance (IEC) granted by the Regional Ethics Committee of the Gdansk Medical Chamber in Gdansk, Poland, was obtained for this study (KB-32/21). In addition, each person provided a signed informed consent form.
Data were collected on the date of arrival at the blood collection facility. The study consisted of two groups, the study group (SG) (N= 141, age = 53.48 ± 10.66 years) and the control group (CG) (N = 70, age = 56.32 ± 7.03 years) belonging to the same socioeconomic, ethnic, and geographic niche. Thus, both groups belonged to the Caucasian ethnic group; samples were collected from the area encompassed within a radius of 50 km from the point of sample collection, and their socioeconomic status was defined as uniform based on their monthly income.
The main inclusion criteria for the study and control groups were based on consensus definition criteria that incorporate the definitions of IDF and AHA/NHLBI (Alberti et al., 2009). Thus, the subjects for whom WC ≥ 94 cm, TG levels ≥ 1.69 mmol/L, HDL-C < 1.04 mmol/L, BP ≥130/85 mmHg, and fasting glucose ≥100 mg/dL were classified as MetS subjects. The control group consisted of selected subjects for whom WC, fasting glucose, TG, HDL-C, and BP were within the generally accepted norms (NCEP, 2001). According to the subjects’ statements, they had not taken any medication for a minimum of 3 weeks prior to the study. Subjects in the study group, in addition to the presence of MetS, were not defined by any other pathologies.
The height in centimeters was measured with a precision of 0.1 cm. The subject was placed during the measurement barefoot in orthostatic position. Body mass in kilograms with a precision of 0.1 kg was measured with minimal clothing. The BMI was calculated using the following equation: BMI = body mass (kg)/height2 (m). The WC was measured at the midpoint between the iliac crest and the external face of the last rib with a precision of 0.1 cm.
All laboratory measurements were performed between 7:00 and 9:00 a.m. after fasting for 24 hr.
Cortisol, adiponectin, MCP-1, CRP, adipsin, leptin, resistin, and PAI-1 measurements were performed using the Fluorokine Map Obesity Base Kit and the Luminex 100 platform. Analyte-specific antibodies were precoated onto color-coded microparticles and pipetted into the wells where immobilized antibodies bind to the particles of interest. This procedure was followed by washing the unbonded substance. This step was followed by the addition of a biotinylated antibody cocktail that is specific to the analytes. Next, streptavidin-phycoerythrin was added to each well to bind the captured biotinylated microparticles. A final wash followed this stage to remove streptavidin-phycoerythrin. The contents of the wells were resuspended in a buffer for reading on the Luminex analyzer. The laser reader allowed to determine the magnitude of the phycoerythrin-derived signal that is proportional to the amount of analyte studied. LDL-C, HDL-C, TG, and TC concentrations were analyzed using the Alinity c clinical chemistry system (Abbott Diagnostics). Alinity c is an automated clinical chemistry analyzer equipped with indirect ion-sensitive electrodes on an integrated chip technology (ICT). The clinical chemistry parameters include, among others, HDL-C, LDL-C, TC, and TG. HDL-C levels were evaluated using the Alinity C ultra-HDL (3500T) kit, the LDL-C Alinity C direct LDL reagent 580/Bx, TC—Alinity c cholesterol reagent kit, and TG—Alinity triglyceride reagent kit (7p7720).
All statistical analyzes were performed using the R package (R Core Team, 2020). The normality of a sample distribution was assessed using the Shapiro–Wilk normality test (Shapiro & Wilk, 1965). Statistical inferences between samples were derived using the t test (T. K. Kim, 2015). The correlations between the parameters studied were evaluated using Pearson’s correlation (“Pearson’s Correlation Coefficient,” 2008). The strength of the correlations was defined as 40 < ρ < 60: correlations of moderate strength, and 60 ≤ ρ < 80 strong correlations. The minimum sample size to obtain the statistical power of = 0.8 at α = 0.01 and the week correlation of 0.2 was calculated using the method outlined by Lachin (1981) and was equal to 76 subjects. This study sample comprises 141 subjects. Power analysis for t tests (performed using pooled variance or Welch’s variance) for all the studied parameters resulted in a power greater than 0.9.
Results
The descriptive statistics for SG and CG are collected in Table 1. The cross-correlations observed in SG between the parameters studied are collected in Table 2.
Mean and Standard Deviation of Studied Parameters for Study Group and Control Group.
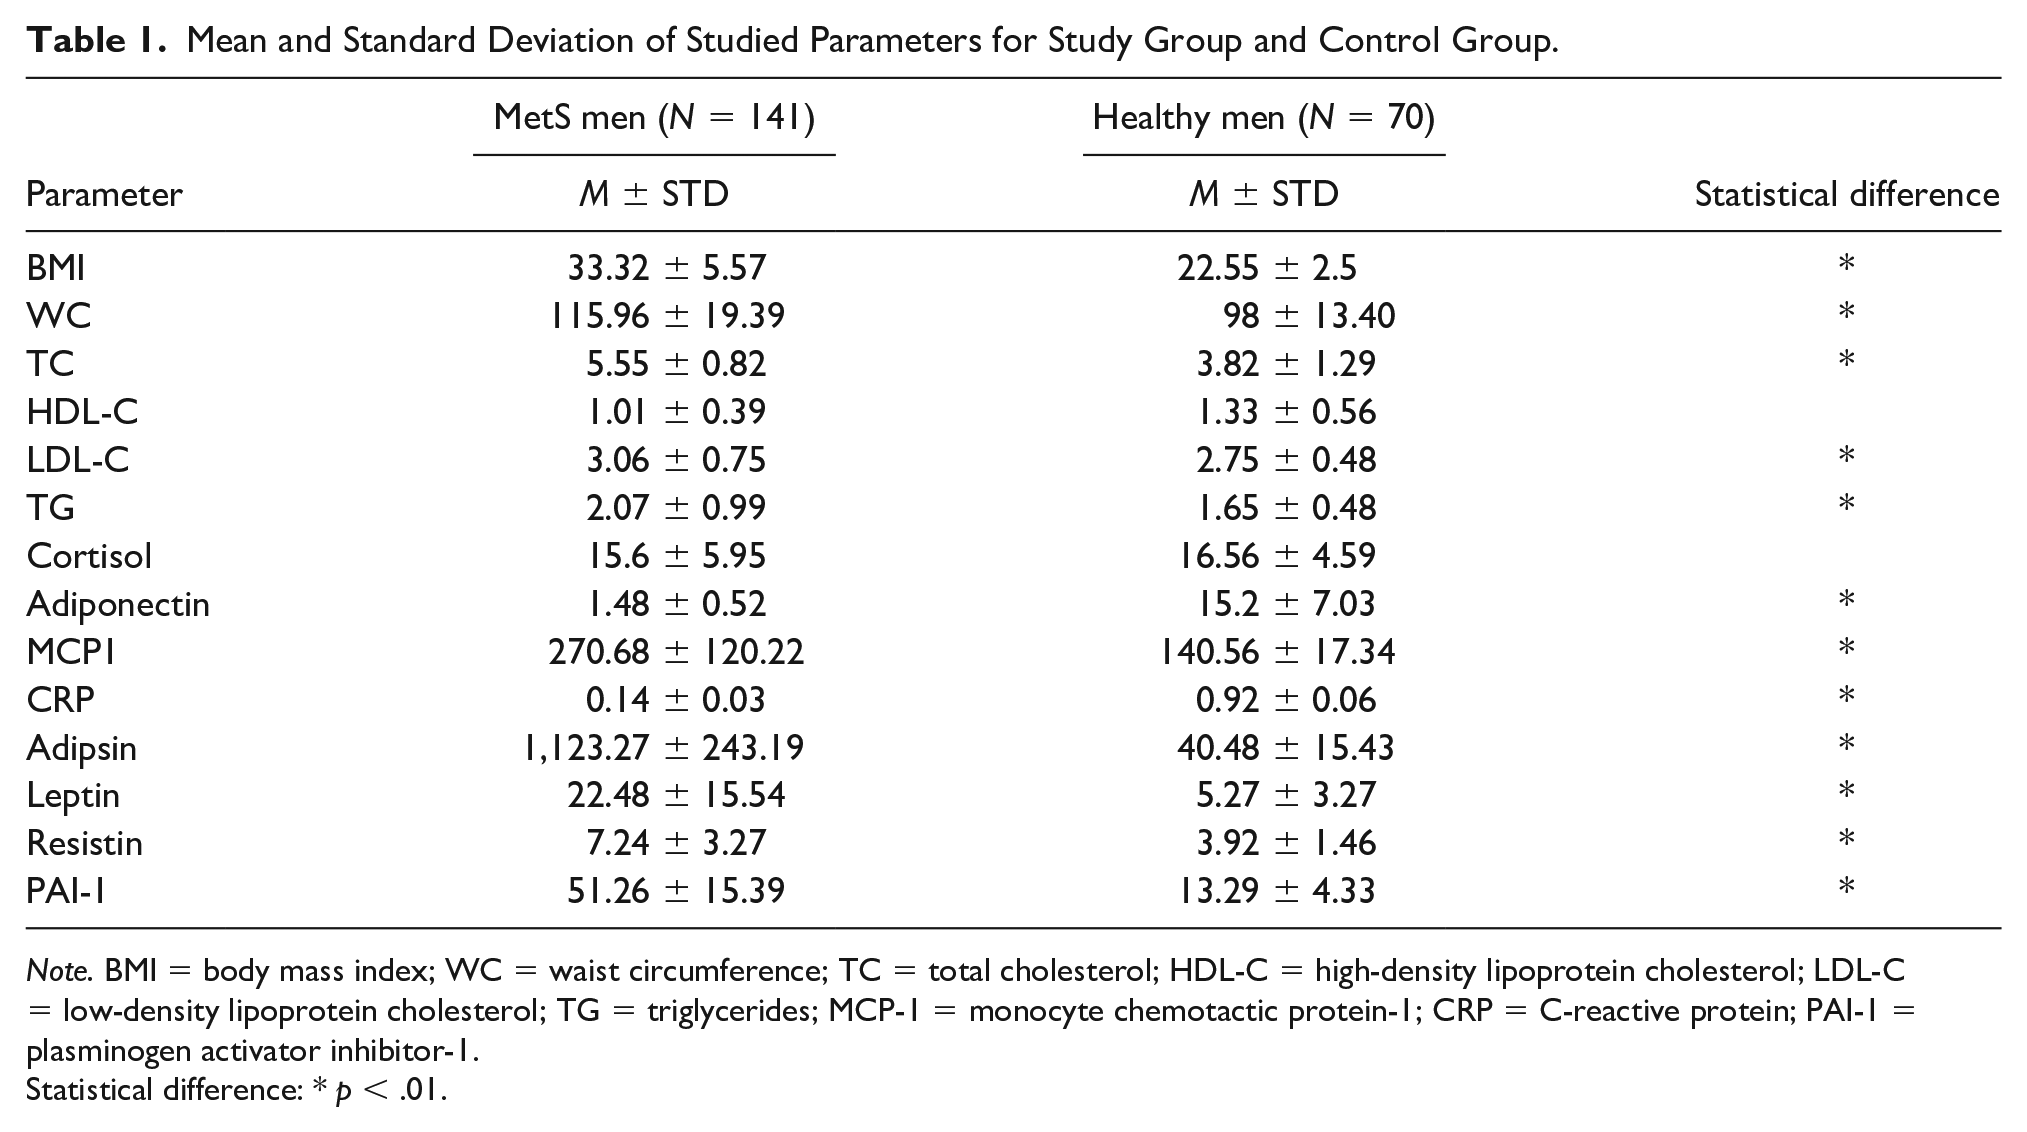
Note. BMI = body mass index; WC = waist circumference; TC = total cholesterol; HDL-C = high-density lipoprotein cholesterol; LDL-C = low-density lipoprotein cholesterol; TG = triglycerides; MCP-1 = monocyte chemotactic protein-1; CRP = C-reactive protein; PAI-1 = plasminogen activator inhibitor-1.
Statistical difference: * p < .01.
Cross Correlations Between Studied Parameters in SG Group.

Note. BMI = body mass index; TC = total cholesterol; HDL-C = high-density lipoprotein cholesterol; LDL-C = low-density lipoprotein cholesterol; TG = triglycerides; MCP-1 = monocyte chemotactic protein-1; CRP = C-reactive protein; PAI-1 = plasminogen activator inhibitor-1; WC = waist circumference.
Each cells contain the strength of correlation, its direction, and statistical significance: *p < .05; **p < .01; ***p < .001; ****p < .0001.
The analysis of Table 1 showed that the average BMI in SG was equal to 33.32 kg/m2 and was significantly higher than the BMI in CG (22.55 ± 2.5 kg/m2). The WC in SG was equal to 115.96 ± 9.39 cm and was significantly greater than in CG (98 ± 13.40 cm). TC levels were equal to 5.55 ± 0.82 mmol/L and were statistically higher than TC levels in CG (3.82 ± 1.29 mmol/L). HLD-C levels were equal to 1.01 ± 0.39 mmol/L and were analogous to the levels observed in CG (1.33 ± 0.56 mmol/L). LDL-C levels were equal to 3.06 ± 0.75 mmol/L and were significantly higher than LDL-C levels in CG (2.75 ± 0.48 mmol/L). TG levels in the SG group were equal to 2.07 ± 0.99 mmol/L and were significantly higher than TG levels in CG (1.65 ± 0.48 mmol/L). Cortisol levels in SG were equal to 15.6 ± 5.95 µg/dL, and their levels were statistically equal to cortisol levels in CG (16.56 ± 4.59 µg/dL). Adiponectin levels in SG were equal to 1.48 ± 0.52 µg/mL and were significantly lower than those observed in CG (15.2 ± 7.03 µg/mL). The MCP-1 levels in SG were equal to 270.68 ± 120.22 pg/mL and significantly higher than the levels of MCP-1 observed in CG (140.56 ± 17.34 pg/mL). CRP levels in SG were equal to 0.14 ± 0.03 mg/L and statically lower than those observed in CG (0.92 ± 0.06 mg/L). Adipsin levels in SG were 1123.27 ± 243.19 µmol/L and statistically higher than the levels that define CG (40.48 ± 15.43 µmol/L). Leptin levels in SG were 22.48 ± 15.54 ng/mL and statistically higher than the range that defined subjects CG (5.27 ± 3.27 ng/mL). Resistin levels in SG were equal to 7.24 ± 3.27 ng/mL and significantly higher than the levels observed in CG (3.92 ± 1.46 ng/mL). PAI-1 levels in SG were 51.26 ± 15.39 ng/mL and significantly higher than the levels that define CG (13.29 ± 4.33 ng/mL).
The analysis of Table 2 revealed the following statistically significant correlations in SG between the parameters studied. All the statistically significant correlations were unique for MetS men (SG group). Therefore, leptin levels were strongly correlated with BMI (ρ = 0.67; p < .01, Figure 1A). LDL-C levels correlated strongly with TC levels (ρ = 0.83; p < .0001, Figure 1B). There was a negative and moderate strength correlation between MCP1 and LDL-C levels (ρ = 054; p < .05, Figure 1C). A similar relation was observed for the correlation between resistin and cortisol levels (ρ = −0.58; p < .001, Figure 1D). Adiponectin correlated strongly with PAI-1 (ρ = 0.91; p < .001, Figure 1E). Moreover, adiponectin and adipsin strongly correlated with each other (ρ = 0.83, p < .0001, Figure 1F). A correlation between CRP and MCP-1 levels was negative and of moderate strength (ρ =−0.52, p < .05, Figure 1G). PAI-1 levels correlated strongly with adipsin levels (ρ = 0.74, p < .01, Figure 1H). WC correlated strongly with leptin levels (ρ = 0.67 p < .01, Figure 1I). There was a negative correlation of moderate strength between PA-1 levels and CRP levels (ρ =0.853, p < .05, Figure 1J). Cortisol levels correlated strongly with BMI (ρ = 0.60 p < .05, Figure 1K).

Unique Correlation Between the Studied Parameters: (A) Leptin and BMI, (B) LDL-C and TC, (C) MCP-1 and LDL-C, (D) Resistin and Cortisol, (E) Adiponectin and PAI-1, (F) Adipsin and Adiponectin, (G) CRP and MCP-1, (H) PAI-1 and Adipsin, (I) WC and Leptin, (J) PAI-1 and CRP, and (K) Cortisol and BMI.
Discussion
Some of the observations presented in this study confirm previous observations. However, this study also identified new relationships that have not yet been presented in scientific studies on MetS. Therefore, in addition to the known correlations between BMI, WC, TC, and HDL-C, this study found correlations between leptin and BMI, LDL-C and TC, MCP-1 and LCL-C, resistin and cortisol, adiponectin and PAI-1, adispin and adiponectin, CRP and MCP-1, PAI-1 and adipsin, WC and leptin, PAI-1 and CRP, and cortisol and BMI.
The observation that SG was defined by BMI levels in the Obese Class 1 category (Nuttall, 2015) and that BMI levels in SG were significantly higher than BMI levels in CG is in agreement with the previous study and confirms that BMI is a parameter that defines MetS (Kobo et al., 2019).
The WC values in the SG group are higher than those observed in CG and in a range of cardiovascular disease risk (Siren et al., 2012). This observation also confirms previous results that indicate that WC is a viable marker for MetS (Shen et al., 2006). Furthermore, a significant increase in TC and LDL-C levels in the SG group compared with the CG group associated with a directly proportional relationship between these parameters supports the results of the previous study that indicated an increase in TC and LDL-C levels in subjects with MetS (Kawamoto et al., 2011). This observation also supports the previously postulated applicability of TC and HDL-C as feasible markers of an increased risk of cardiovascular disease and MetS (Nantsupawat et al., 2019). The presence of low HDL-C levels in SG, normal HDL-C levels in CG confirms the observation that adults with a lower HDL-C level may be more susceptible to developing MetS (Liu et al., 2015; Marjani, 2013). Although TG levels in both groups were within the normal reference range (NCEP, 2001), the presence of elevated TG levels (borderline-high TG levels) in SG confirms the previous study that indicated a relationship between low HDL-C and elevated TG levels as an indicator of MetS (Wilson & Grundy, 2003).
In summary, a review of the applicability of standard obesity markers such as BMI, WC, and serum lipid levels indicates that they are feasible MetS markers.
The presence of cortisol in the SG group in the range of normal concentrations (El-Farhan et al., 2017) and lack of statistically significant differences between the SG and CG groups confirms the previous study (Abraham et al., 2013) that indicated the absence of a systemic relationship between the level of cortisol and MetS. This study also revealed a strong positive correlation between cortisol levels and BMI that contradicts the previous study revealing that an increase in BMI is associated with a decrease in serum cortisol levels (Odeniyi et al., 2015). Since this observation disproves the previous report’s result, more studies are required to elucidate the role of cortisol in obesity and MetS.
This study demonstrated the presence of adiponectin levels in SG within the range of normal concentrations (D. H. Kim et al., 2013). However, its levels were also significantly lower than the levels observed in CG. This observation confirms the previous report indicating a decrease in adiponectin levels in obese subjects and subjects with metabolic abnormalities (Padmalayam & Suto, 2013).
MCP-1 levels in SG were significantly higher than MCP-1 levels in CG and above the range that defines healthy subjects (Valković et al., 2016). This observation contradicts the previous report indicating that MCP-1 levels do not increase in patients with MetS (Rabkin et al., 2013). Furthermore, it was also observed that MCP-1 levels were reversely proportional to LDL-C levels. It is a novel observation, especially in the context of MetS. Therefore, further studies are required to provide an unambiguous explanation for this phenomenon. Furthermore, the results presented contradict the observation reported by C. S. Kim et al. (2006), who indicated that an increase in MCP-1 levels is a function of obesity. They also contradict the study suggesting that MCP-1 cannot be considered a valuable marker of metabolic activity syndrome (Odeniyi et al., 2015).
Elevated levels of adipsin in CG confirm previous studies on the level of adipsin in humans with the normal level of adipose tissue (Napolitano et al., 1994). This observation also confirms the study that indicated a direct relationship between obesity, fat tissue, and adipsin (Guo et al., 2021; Vasilenko et al., 2017). Since MetS can lead to T2DM, this study partially undermines previously reported results indicating depletion of adipsin levels in T2DM patients (Zhou et al., 2018). Furthermore, this study also revealed a strong positive correlation between adiponectin and adipsin levels, indicating that a simultaneous decrease in these two markers can be considered as a MetS predictor. The results presented also support the results of the study by Somodi et al. (2018), revealing a positive correlation between adiponectin and adipsin in obese non-diabetic subjects. An animal model study that indicated a potential role for adipsin and adiponectin in glucose metabolism and insulin resistance also strengthened the relationships reported (Taşdemir, 2019).
Elevated leptin levels in SG as a function of BMI confirmed the role of leptin as a viable MetS marker (Ghadge & Khaire, 2019). This observation confirms previously observed correlations between leptin levels and obesity and may indicate energy imbalance and an increased risk of cardiovascular disease and TDM2 (Martins et al., 2012).
Normal serum levels of resistin (Jamaluddin et al., 2012) associated with a statistically significant difference between SG and CG confirm an unclear association or lack thereof in patients with MetS (Malo et al., 2011).
Elevated levels of PAI-1 disclosed in this report and the previous study (Alessi & Juhan-Vague, 2006) confirm their potential role as a marker of obesity and MetS. Furthermore, this study also revealed a strong positive cross-correlation between PAI-1 and adpisin levels. This observation reinforces the practical utility of PAI-1 and adipsin as MetS markers (Al-Hamodi et al., 2011; Schrover et al., 2018).
This study also revealed a decrease in CRP levels as a function of MetS. This observation contradicts the report by Rutter et al. (2004), which shows an increase in CRP levels in the presence of MetS. The moderate-strength negative correlation detected between CRP and PAI-1 may indicate an interaction between these two parameters in men with MetS. Furthermore, the observed relation contradicts the previous report on the positive direct proportional relationship between the level of CRP and PAI-1 (Devaraj et al., 2003).
Conclusion
This study was an attempt to unequivocally determine the clinical applicability of the novel markers that define MetS. Analysis of standard markers such as BMI, WC, and serum lipids confirmed previous studies that indicate their applicability in the diagnosis of MetS. However, analysis of the potential usefulness of parameters such as cortisol, adiponectin, MCP-1, adipsin, leptin, resistin, and PAI-1 provided new unpublished findings.
Therefore, this study demonstrated a statistically significant decrease in adiponectin levels, a significant increase in MCP-1 levels, and a significant increase in adipsin, leptin, resistin, and PAI-1 levels as potential indicators of MetS.
Furthermore, the presence of a strong positive correlation between cortisol and BMI and a strong positive correlation between adipsin and adiponectin levels was also observed in men with MetS.
A new finding of this study revealed an inversely proportional relationship between MCP-1 and LDL-C levels in men with MetS.
Footnotes
Declaration of Conflicting Interests
The author(s) declared no potential conflicts of interest with respect to the research, authorship, and/or publication of this article.
Funding
The author(s) received no financial support for the research, authorship, and/or publication of this article.