
Abstract
Total testosterone (TT) is known to influence health and virility in men. Among men from United States and Europe, numerous sociodemographic and lifestyle factors were reported to be associated with TT. However, associations with TT and Leydig cell function in the Middle East are poorly described. A cross-sectional, population-based sample had a structured interview, physical examinations, and blood tests in two hospitals in Jerusalem, Israel. A subsample (25- to 44-year-old men, n = 286: 124 Israelis, 162 Palestinians) had sex hormone measurements. The primary outcomes were TT and free testosterone/luteinizing hormone (FT/LH) ratio, representing Leydig cell function. Associations with sociodemographic and lifestyle factors, body mass index (BMI), and physical activity (PA) were evaluated using multivariable linear regression. Compared with Palestinians, Israelis had similar TT (4.81 vs. 5.09 ng/mL, p = .405) and higher FT/LH (31.2 vs. 25.8 ng/IU, p = .002). In ln-transformed values, marital status had a stronger association in Palestinians (P for interaction = 0.03). Age, BMI, and PA had a stronger association with TT in Israelis with significant interactions with ethnicity. BMI <25 and a higher PA quartile were associated with a higher TT (p < .001). Among Israelis, age (p = .007), married marital status (p = .007), and BMI <25 were significantly associated with FT/LH. No associations of any factors were identified among Palestinians. Associations with several modifiable factors identified in Western samples were replicated in Israelis and to a lesser degree in Palestinians. Different relationships of several factors with TT and FT/LH could result from ethnically diverse genetic, sociodemographic, and behavioral characteristics that warrant further research.
Background
Testosterone (T), the primary sex hormone in men, is well known to be related to a variety of diseases and conditions in both men and women. Low testosterone serum concentrations are associated with male hypogonadism, a very prevalent medical concern—estimated at about 6% of middle-aged men, depending on definition and study population (Al-Sharefi & Quinton, 2020; Marcelli & Mediwala, 2020; Paduch et al., 2014). It presents with infertility, libido disturbances, erectile dysfunction, chronic fatigue, depression and mood changes, and osteoporosis (Paduch et al., 2014; Wang et al., 2013). Low testosterone serum concentrations are also associated with cardiovascular disease, stroke (Svartberg et al., 2003), metabolic and all-cause mortality (Haring et al., 2010; McBride et al., 2016). Understanding the factors that influence total testosterone (TT) is important for men’s health.
Hypogonadism is closely associated with Leydig cell dysfunction, which is prevalent in certain clinical settings such as older men. Possible mechanisms are reduced number or function of Leydig cells, a lower amplitude of luteinizing hormone (LH) secretion, and hypothalamic–pituitary–gonadal (HPG) axis insensitivity (McBride et al., 2016; Vermeulen et al., 1993).
Measurement of testosterone concentrations is complicated by the presence of several fractions in the serum. Only 2% to 3% of TT is unbound, free testosterone (FT; Allen et al., 2002; De Ronde et al., 2006; Paduch et al., 2014). An additional ~60% of TT is specifically bound to sex hormone binding globulin (SHBG) and is physiologically inactive; the active fraction is bioavailable testosterone (BT) that includes the free testosterone and the fraction bound to albumin (38%). In practice, TT is the most common fraction used and FT is usually estimated from TT and SHBG rather than measured directly. It is calculated (cFT) using complex different algorithms (De Ronde et al., 2006; Paduch et al., 2014; Vermeulen et al., 1999) such as the Vermeulen algorithm.
The TT/LH ratios have been previously used (Andersson et al., 2004; Holmboe et al., 2017; Wu et al., 2008) to investigate testicular response and production capacity, that is, Leydig cell function. FT directly exerts the androgenic effect on tissue and is arguably more indicative of the physiological androgenic activity than TT (Beattie et al., 2015; McBride et al., 2016; Paduch et al., 2014); thus, free testosterone/luteinizing hormone (FT/LH) ratios might prove to be a better proxy for Leydig cell function. Few studies to date reported FT/LH (Halling et al., 2013; Priskorn et al., 2016).
Previous research in andrology (Allen et al., 2002; Muller et al., 2003; Paduch et al., 2014; Ravnborg et al., 2011; Shiels et al., 2009; Svartberg et al., 2003; Wang et al., 2013; Wu et al., 2008) has shed some light on various sociodemographic and modifiable lifestyle factors that are associated with concentrations of testosterone in different populations. In most studies to date, TT and FT concentrations decrease in a physiologic, age-dependent fashion, estimated to be about 0.4% to 2% a year after 30 years of age (Andersson et al., 2007; McBride et al., 2016). Relationship and marital status are also well known (Gray et al., 2006; Holmboe et al., 2017; Maestripieri et al., 2014) to be associated with testosterone concentrations as testosterone is widely speculated to be related to human reproductive effort (Gray et al., 2017). The TT/LH concentrations are unaffected by marital status, suggesting unaffected Leydig cell function (Holmboe et al., 2017); No information is available regarding FT/LH ratio. Data regarding other demographic factors associated with sex hormones, such as religiosity and education, remain scarce.
Numerous studies investigated the association between TT and modifiable risk factors such as smoking, alcohol consumption, obesity, and physical activity (PA). Cigarette smoking and testosterone consistently demonstrate (Allen et al., 2002; Shiels et al., 2009; Svartberg et al., 2003; Svartberg & Jorde, 2006; Wang et al., 2013) a rise in TT, FT, SHBG, and LH in smokers, with a dose–response pattern. Most sources describe alcohol and testosterone concentrations as having no or weak associations (Allen et al., 2002; Muller et al., 2003; Svartberg et al., 2003). The body mass index (BMI; and other measures of obesity such as waist circumference) are associated with decreased TT, FT, SHBG, and LH (Derby et al., 2006; Paduch et al., 2014; Svartberg et al., 2003). The association of PA and sex hormones is inconclusive (Allen et al., 2002; Muller et al., 2003; Shiels et al., 2009; Svartberg et al., 2003). Associations of any of the modifiable risk factors mentioned and FT/LH ratios are still unknown.
Ethnic differences in sex hormone concentrations are well-documented in North American and Scandinavian populations (Halling et al., 2013; Lopez et al., 2017; Maestripieri et al., 2014; Rohrmann et al., 2007). Ethnicity was reported to have an effect modification, or interaction, with relationship status (Maestripieri et al., 2014): single men had a higher concentration of TT than their involved counterparts, unless they were Asian American—an ethnic group in which single men had lower testosterone concentrations than non-single men.
Population-based andrological data on Middle Eastern ethnicities, however, are lacking. Israelis and Palestinians living in West and East Jerusalem, respectively, represent two distinct populations—both culturally and socioeconomically. While Israelis and Palestinians have a partial overlap in ancestry, they are regarded as separate ethnicities. Moreover, health-related behavior, such as smoking, obesity, and PA, differs greatly between the two populations, and so do other determinants of health (Kark et al., 2006; Merom et al., 2012).
While substantial differences in habits, social factors, and genetics exist between the two populations, data also point to an overlap in ancestry leading to genetic similarities (Thomas et al., 2002) and shared detrimental health outcomes in light of the regional political conflict. (Ayer et al., 2017)
This study aimed to assess differences in TT and FT/LH ratios between Palestinian and Israeli young men (25–44 years old).
We also aimed to identify associations of sex hormones with sociodemographic and modifiable lifestyle factors; In particular, we also aimed to investigate whether ethnicity modifies these associations.
An additional aim was to assess FT/LH as a measure for Leydig cell function.
Method
Study Population
Since 1967, Palestinians in East Jerusalem are Israeli citizens or permanent residents. As such, they have social security privileges and health insurance, and are registered in the national population registry (Pechter Polls, 2011).
The study population was drawn from the Jerusalem Palestinian–Israeli Middle Eastern Regional Cooperation (MERC) Risk Factor Study. The MERC Risk Factor Study was a population-based cross-sectional study designed to assess and compare cardiovascular risk. Data collection was conducted between 2004 and 2008. The 4,000 planned participants were men and women aged between 25 and 74 years, chosen randomly, based on the national registry, with each sex-age decile including 200 individuals—2,000 Israelis and 2,000 Palestinians. A flowchart of the sample is depicted in Figure 1. Participants were recruited by a letter of invitation and subsequent phone calls. Exclusion criteria included institutionalization or presence of a serious disease or house-bounding condition. A total of 53.7% of Israelis and 76.7% of Palestinians responded and arrived at the two designated hospitals. The Israelis arrived at Hadassah Ein Kerem in West Jerusalem and the Palestinians arrived at St. Joseph in East Jerusalem, comprising a population of 712 Israelis and 970 Palestinians. All patients signed a written informed consent. Ethical approval (No. 28-30.3.01) from the Hadassah Medical Center institutional review board was obtained.

Flowchart of the Sample Enrolled in the Study
A prespecified subgroup of this population, namely, 286 men (124 Israelis and 162 Palestinians) aged between 25 and 44 years, with full sex hormone measurements, was included in this study.
Data Collection
All compliant participants were scheduled for a morning appointment in which they underwent a standardized interview, physical examination, and additional exams. The confidentiality of study participants was ensured by anonymization of all gathered data, using a participant identification code. All patient blood samples were drawn between 08:00 a.m. and 10:00 a.m., following an overnight fast. Samples were frozen and stored at −80°C until analysis of thawed aliquots.
Measures and Variables
Origin was established by paternal country of birth. Smoking status of cigarettes and hookah was estimated from self-report and categorized into never (less than 100 lifetime cigarettes/50 hookahs), former, and current smokers. Alcohol consumption was likewise self-reported and categorized into none, less than once a week, and once a week and greater. Marital status was dichotomized by cohabitation—single versus cohabitant (comprised mostly of married men, with some men reporting “living together with a partner”—hereafter referred to as “married”).
Religiosity was estimated from self-report as Orthodox, observant, or secular; Orthodox Jews were grouped together with observant Jews as “religious Israelis.” Education levels were as follows: primary, high school (HS) attendance but without passing Israeli matriculation exams, HS matriculation (possibly having a nonacademic degree), and academic degree holders.
The BMI was categorized as normal/underweight (<25; only two participants had BMI <18.5), overweight (>25), or obese (>30). Physical activity (PA) estimation was meticulously described in a previous publication (Merom et al., 2012); in brief, The Multi-Ethnic Study of Atherosclerosis (MESA) questionnaire was used to assess PA in the month leading to the interview. The duration of 28 specific activities across several domains (work, leisure, home chores, and volunteering) and respective metabolic equivalent (MET) were used to calculate weekly energy expenditure (EE) in MET-minutes, which were classified as light (<3 METs), moderate (3–6 METs), or vigorous (>6 METs). Moderate or vigorous PA (MVPA), known to be health enhancing (Haskell et al., 2007), was expressed in EE units (min*MET*week–1) and broken into quartiles.
Hormone Assays
All sex hormones serum concentrations were measured by immunoassay in a single laboratory at the Sourasky (Ichilov) Medical Center in Tel Aviv, Israel. The TT, LH, and SHBG concentrations were measured using chemiluminescent immunometric assays performed on automatic auto analyzers (Cobas e411, Roche Diagnostics, Indianapolis, USA for TT; IMMULITE 2000 XPi Immunoassay System, Siemens Health care Diagnostics Product, Llanberis, Gwynedd, UK for LH and SHBG). Intra-assay coefficients of variance (CV) were 1.7% (TT), 3.04% (LH), and 2.5% (SHBG). Inter-assay CVs were 7.4%, 5.11%, and 5.3%, and limits of detection were 2.5 ng/dL, 0.02 nmol/L, and 0.05 mIU/mL, respectively. The Vermeulen formula (De Ronde et al., 2006; Vermeulen et al., 1999) was used to calculate FT. The analyses focused on TT and FT/LH.
Statistical Analysis
Hormone levels were compared between Israelis and Palestinians. The association between categorical variables was tested using the chi-square test or the Fisher’s exact test, with the linear-by-linear procedure for trend analysis. The scale variable correlations were assessed using Spearman’s correlation coefficient as sex hormones distributions were not normal. The comparison of scale variables between two independent groups, such as Israelis and Palestinians, was carried out by using the nonparametric Mann–Whitney U test; for three groups or more, Kruskal–Wallis test was employed to check for differences, supplemented with the Jonckheere–Terpstra test for trend analysis. The analysis of variance (ANOVA), with Tukey’s or Dunett T3 correction for multiple comparisons, was used where appropriate.
Hormone measurements were ln-transformed. “Enter” and “Stepwise” multivariable linear regressions were used for each outcome. Variables were hierarchal, entered in blocks—age and ethnicity (basic model), marital status, religiosity, and education level (demographic model), smoking status and alcohol use (lifestyle model), and BMI and PA (PA and BMI model) were entered in sequence. Interaction variables were then added to the final primary outcome linear regression model alongside main effects. Back transformation (Holmboe et al., 2017; Jensen et al., 2014) of ln-transformed hormone concentrations was used to obtain the percentage change in these variables.
Additional multivariable linear regression models, including different iterations of all the dependent variables (i.e., anthropometric scale variables instead of categorized variables) were also employed for sensitivity analyses.
All tests applied were two-tailed, with α = .05. In the regression models, p values for F statistic were set to .05 for entry and .1 for removal. Interaction was considered significant if p value was .2 or lower.
Results
Sociodemographic Characteristics
Age distribution in our sample was similar for Israelis and Palestinians, with a mean of 36.4 years (Table 1). In contrast, while about a quarter of Israelis were single (n = 32, 25.8%) and were sons to fathers not born in Israel (n = 32, 25.8%), almost all Palestinians were cohabitant (n = 146, 90.7%) and sons to Israel-born fathers, n = 158, 97.5%; p < .001 for (paternal) origin and marital status.
Demographic and Lifestyle Factors Among Israelis (n = 124), Palestinians (n = 162) and the Entire Sample (n = 286).
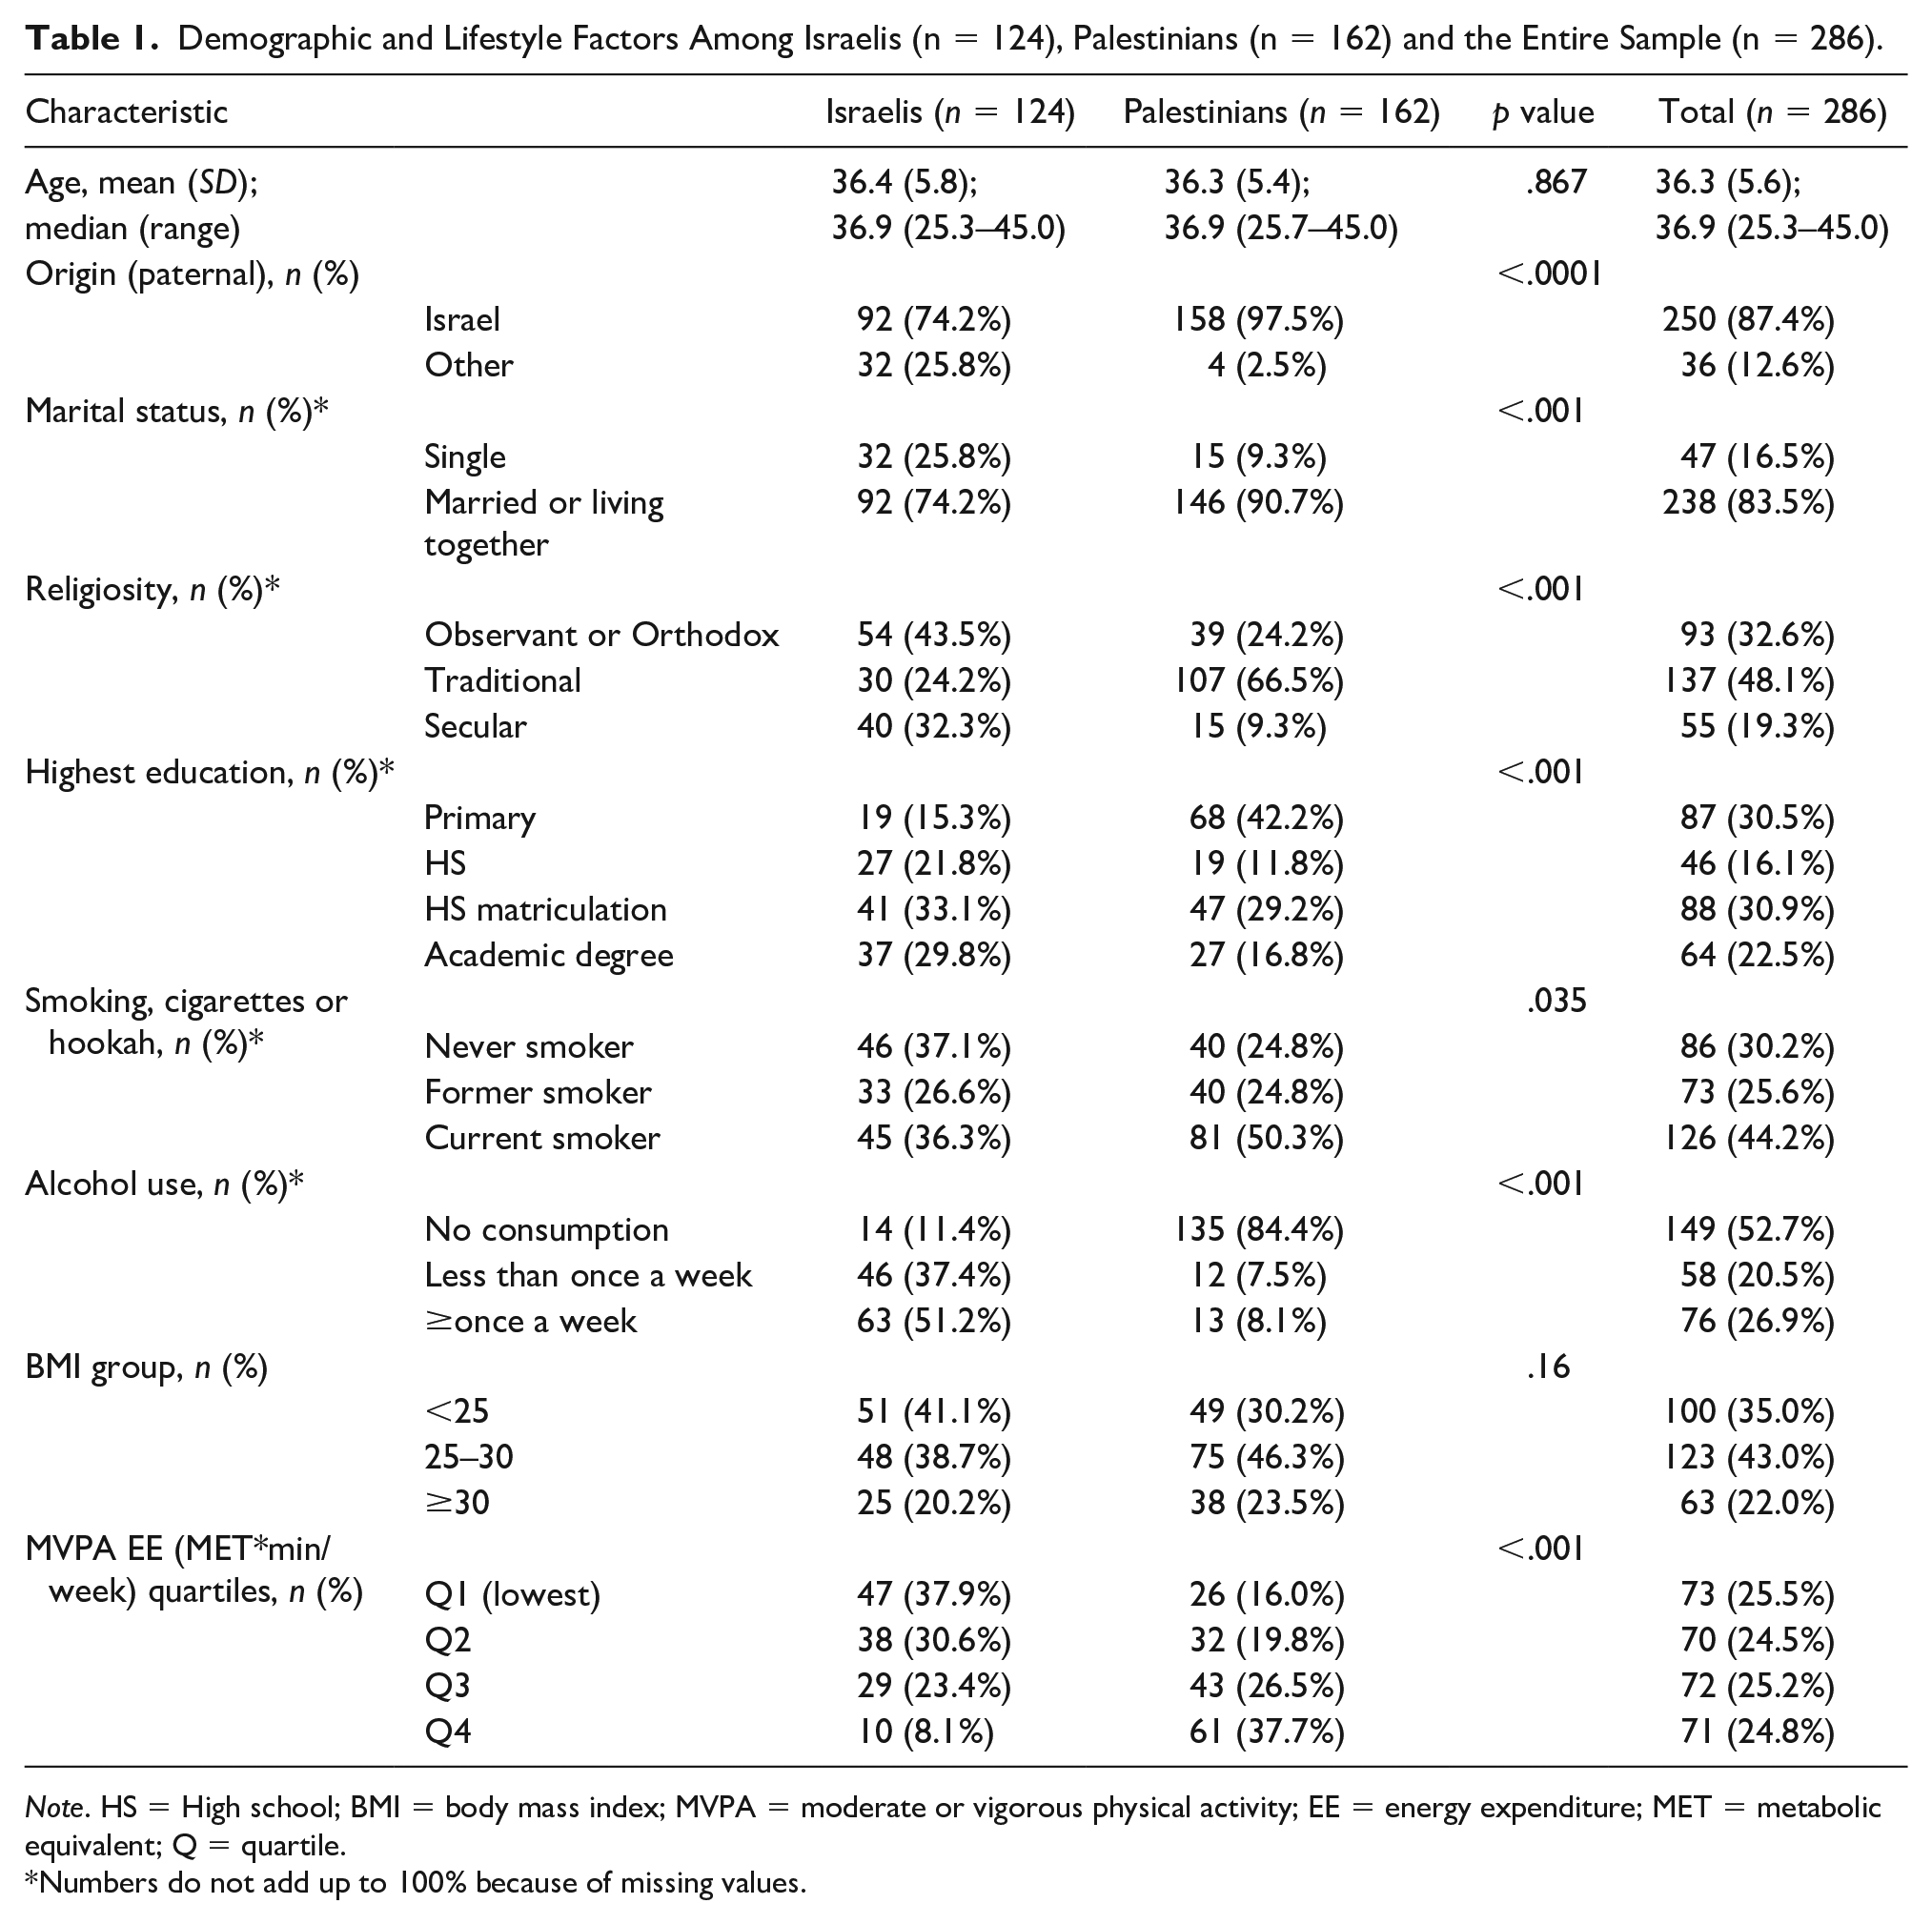
Note. HS = High school; BMI = body mass index; MVPA = moderate or vigorous physical activity; EE = energy expenditure; MET = metabolic equivalent; Q = quartile.
Numbers do not add up to 100% because of missing values.
The Israelis significantly tended to be more secular (n = 40, 32.3% vs. n = 15, 9.3% were secular) and more educated (n = 78, 62.9% vs. n = 74, 46.0% achieved high school matriculation; p < .001 for education and religiosity). Palestinians were heavier smokers than Israelis: p = .035 for smoking status—n = 81, 50.3% vs. n = 45, 36.3% were currently smoking. Palestinians drank less alcohol: p < .001 for alcohol consumption—n = 13, 8.1% vs. n = 63, 51.2% had alcohol once a week or more frequently.
The Palestinians had a higher MVPA EE (n = 104, 64.2% vs. n = 39, 31.5% were placed above the grand median, p < .001). Differences in BMI groups were insignificant (p = .16)—n = 73, 58.9% of Israelis were overweight or obese, compared with n = 113, 69.8% of Palestinians.
Hormone Levels in Israelis and Palestinians
Hormone concentrations box plots are presented in Figure 2, along with means and p values. As depicted, TT and FT concentrations were similar in Israelis and Palestinians. Israelis had lower LH (3.90 vs. 4.96 IU/L, p < .0001) and higher FT/LH ratios (31.2 vs. 25.8 ng/IU, p = .002) than Palestinians.
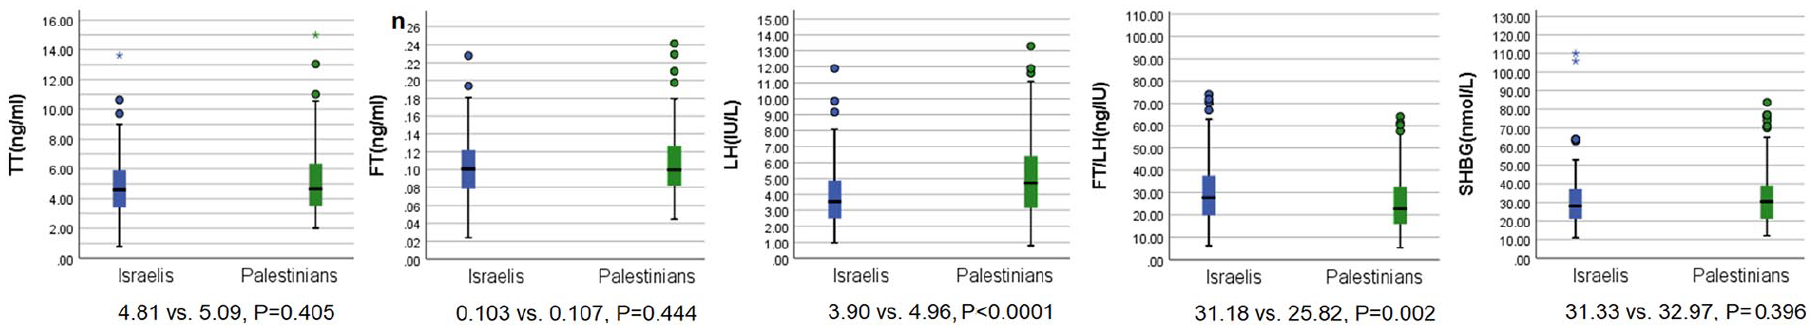
Box Plots of TT (ng/mL), FT (ng/mL), LH (IU/L), FT/LH (ng/IU), SHBG (nmol/L) by Ethnicity
We evaluated (Table 2) the different TT concentration and FT/LH ratio stratified to sociodemographic and lifestyle variables and then to Israelis and Palestinians. The FT, LH, and SHBG levels (Supplemental Table 1; henceforth S1) were not included in this analysis and are briefly mentioned. In both Israelis and Palestinians, age was significantly correlated with TT (p < .001; Spearman’s ρ –.32 and –.30, respectively, not shown). FT/LH was correlated with age only in Israeli men (p = .002, Spearman’s ρ –.278).
Total Testosterone and FT/LH Concentrations According to Sociodemographic and Lifestyle Factors, Stratified by Group.

Note. FT = free testosterone; LH = luteinizing hormone; HS = high school; BMI = body mass index; MVPA = moderate or vigorous physical activity; EE = energy expenditure; MET = metabolic equivalent; Q = quartile.
Numbers do not add up to 100% because of missing values.
Married men had significantly lower TT (4.77 vs. 5.96 ng/mL, p < .001), FT (0.10 vs. 0.12 ng/mL, p < .001), and LH (4.36 vs. 5.23 IU/L, p = .036) levels than their previously or never married counterparts; FT/LH was not different between groups. We discovered that, in both Israelis and Palestinians, marital status was associated with TT but not with FT/LH: married Israelis had a TT of 4.56 ng/mL compared with 5.55 ng/mL in single Israelis, whereas the concentrations in Palestinian men were 4.91 ng/mL and 6.83 ng/mL, respectively.
Religiosity strata were not associated with TT and FT/LH. Education levels had a weak association with TT in Israelis only, which was not significant in the strata direct ad hoc analysis. Smoking cigarettes or hookah was associated with higher TT, FT, and LH, than either former or never smoking. FT/LH ratio was not different across smoking status. The TT, FT/LH findings from the entire sample were replicated in Israelis and Palestinians separately.
A trend-like association was revealed between higher alcohol consumption and lower LH, higher FT/LH ratio (p trend .012 and .003, respectively; FT/LH was 33.8 vs. 26.2 ng/IU in ≥1 drink/week and no consumption). The FT/LH association with alcohol intake was similarly present in Israelis only (35.8 vs. 24.9 ng/IU in ≥1 drink/week and no consumption, respectively; p = .021).
Associations With BMI and Physical Activity
Strong trends were apparent for associations of BMI and MVPA with all the hormones we included in S1 and Table 2. They are succinctly presented in Figure 3.

BMI and MVPA Associations in the Entire Sample, Israelis, and Palestinians.
The TT levels in men with BMI <25 were 6.19 ng/ml in the entire sample, remarkably higher (p < .001) than levels in BMI ≥30 (3.52 ng/ml), and a similar trend followed in all other hormones (S1). This association carried over to both ethnicities (p < .001). Israelis had a corresponding level of 6.05 ng/ml versus 3.06 ng/ml between these groups—almost double. Palestinians’ levels were 6.34 ng/ml and 3.83 ng/ml.
The FT/LH ratios were also remarkably higher for all BMI <25 versus obese men (32.2 vs. 25.9 ng/IU, (p < .001), and more so in Israelis (37.4 vs. 23.4 ng/IU, p = .001). The FT/LH levels were quite similar in Palestinians in all BMI groups (p =.385).
TT rose significantly (p < .0001 for all) between rising MVPA quartiles in the entire sample (4.10–5.77 ng/ml) in Israelis (3.85–5.25 ng/ml) and in Palestinians (4.56–5.86 ng/ml).
Physical activity was positively correlated with all other hormones as well, other than with FT/LH ratio (p = .714). The Palestinians shared this lack of association (p = .491) with minimum differences between Q1 (26.2 ng/IU) and Q4 (26.9 ng/IU). However, Israelis had an association (p = .022) with rising MVPA quartiles weakened by FT/LH levels in Q4 (comprising 10 Israelis—30.0 ng/IU) being lower than Q2 and Q3 (33.3 and 36.8 ng/IU).
Multivariable Regression Models
Hierarchal multivariable regression was used to assess the associations of the independent variables with TT and FT/LH, adjusting for all other variables (Supplemental Tables 2 and 3). As associations were mostly similar throughout the process of addition of other variables, only the final models are reported in Tables 3 to 6. These tables include models generated for Israelis, Palestinians, and for the entire sample, with and without interaction variables. As depicted in summary in Figure 4, the most noteworthy associations identified were in BMI and MVPA.
TT, Final Hierarchical Multivariable Linear Regression Model (Sociodemographic and Lifestyle, PA and BMI), ln Transformed, in the Entire Sample, With and Without Interaction (n = 283).

Note. TT = total testosterone; HS = high school; PA = physical activity; BMI = body mass index; MVPA = moderate or vigorous physical activity; EE = energy expenditure; MET = metabolic equivalent; P-int = p value for interaction with ethnicity; Q = quartile.
TT, Final Hierarchical Multivariable Linear Regression Model (Sociodemographic and Lifestyle, PA and BMI), ln Transformed, in Israelis and Palestinians.
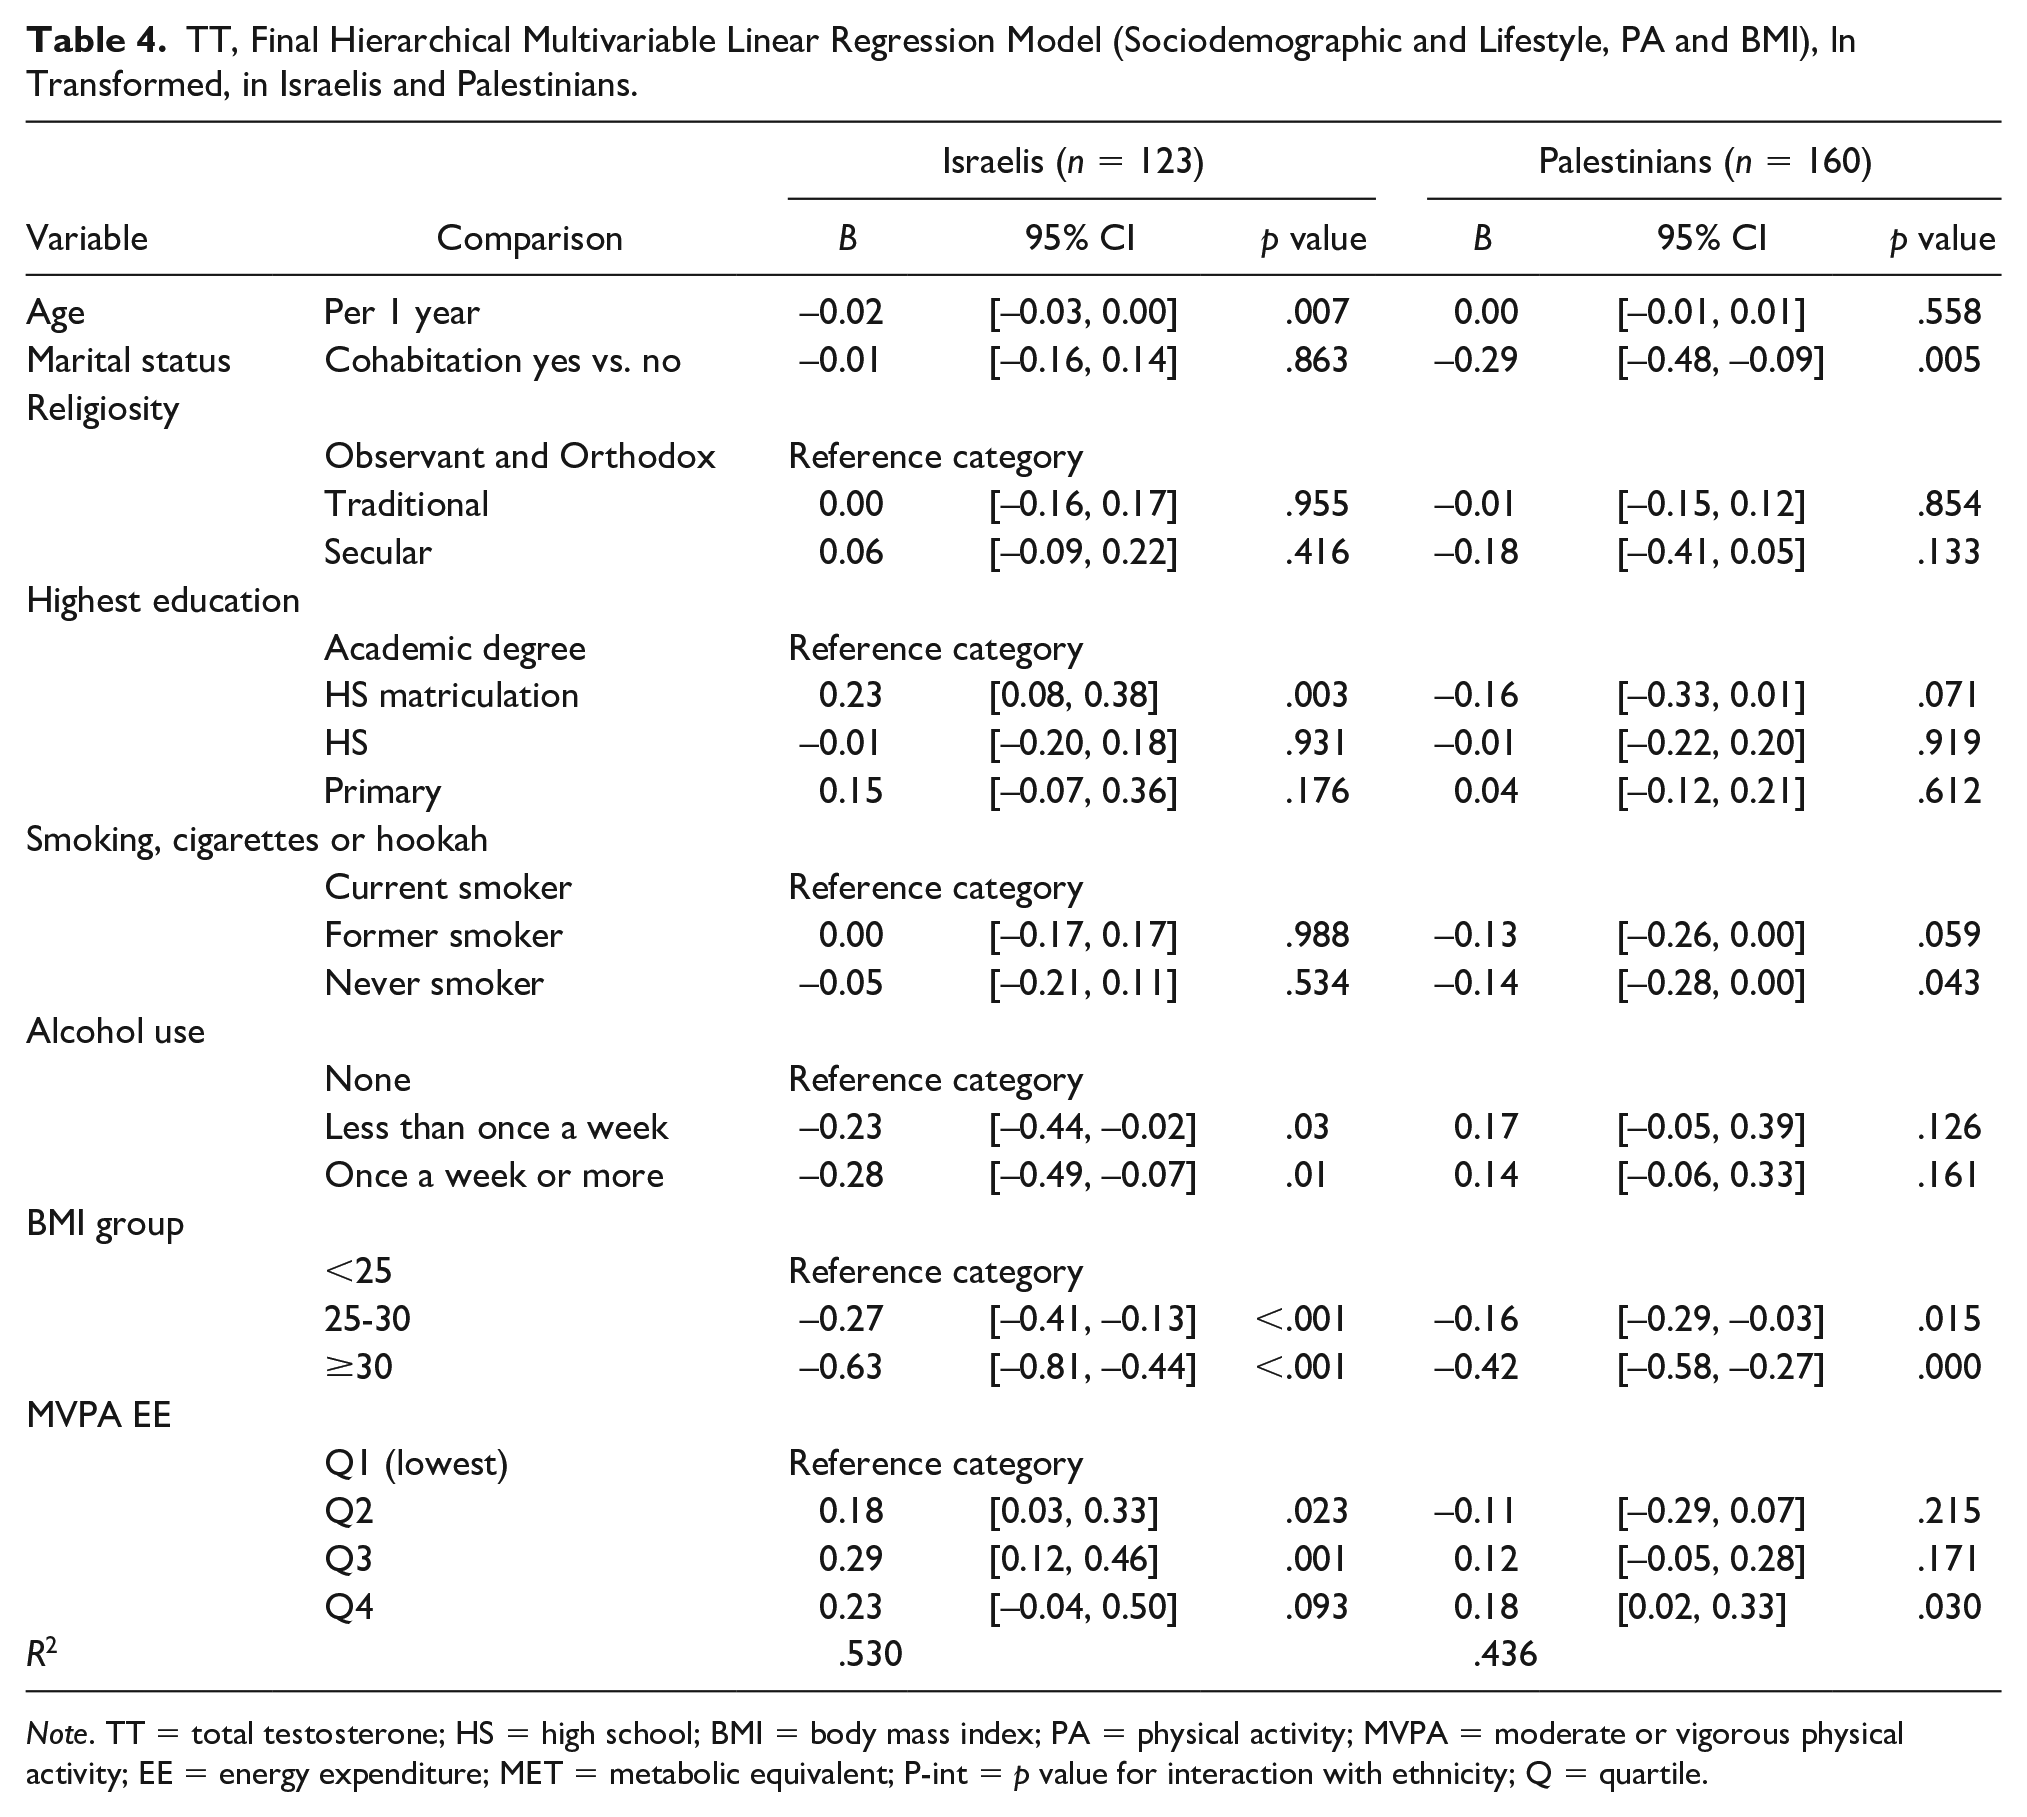
Note. TT = total testosterone; HS = high school; BMI = body mass index; PA = physical activity; MVPA = moderate or vigorous physical activity; EE = energy expenditure; MET = metabolic equivalent; P-int = p value for interaction with ethnicity; Q = quartile.
FT/LH, Final Hierarchical Multivariable Linear Regression Model (Sociodemographic and Lifestyle, PA and BMI), ln Transformed, in Israelis and Palestinians.
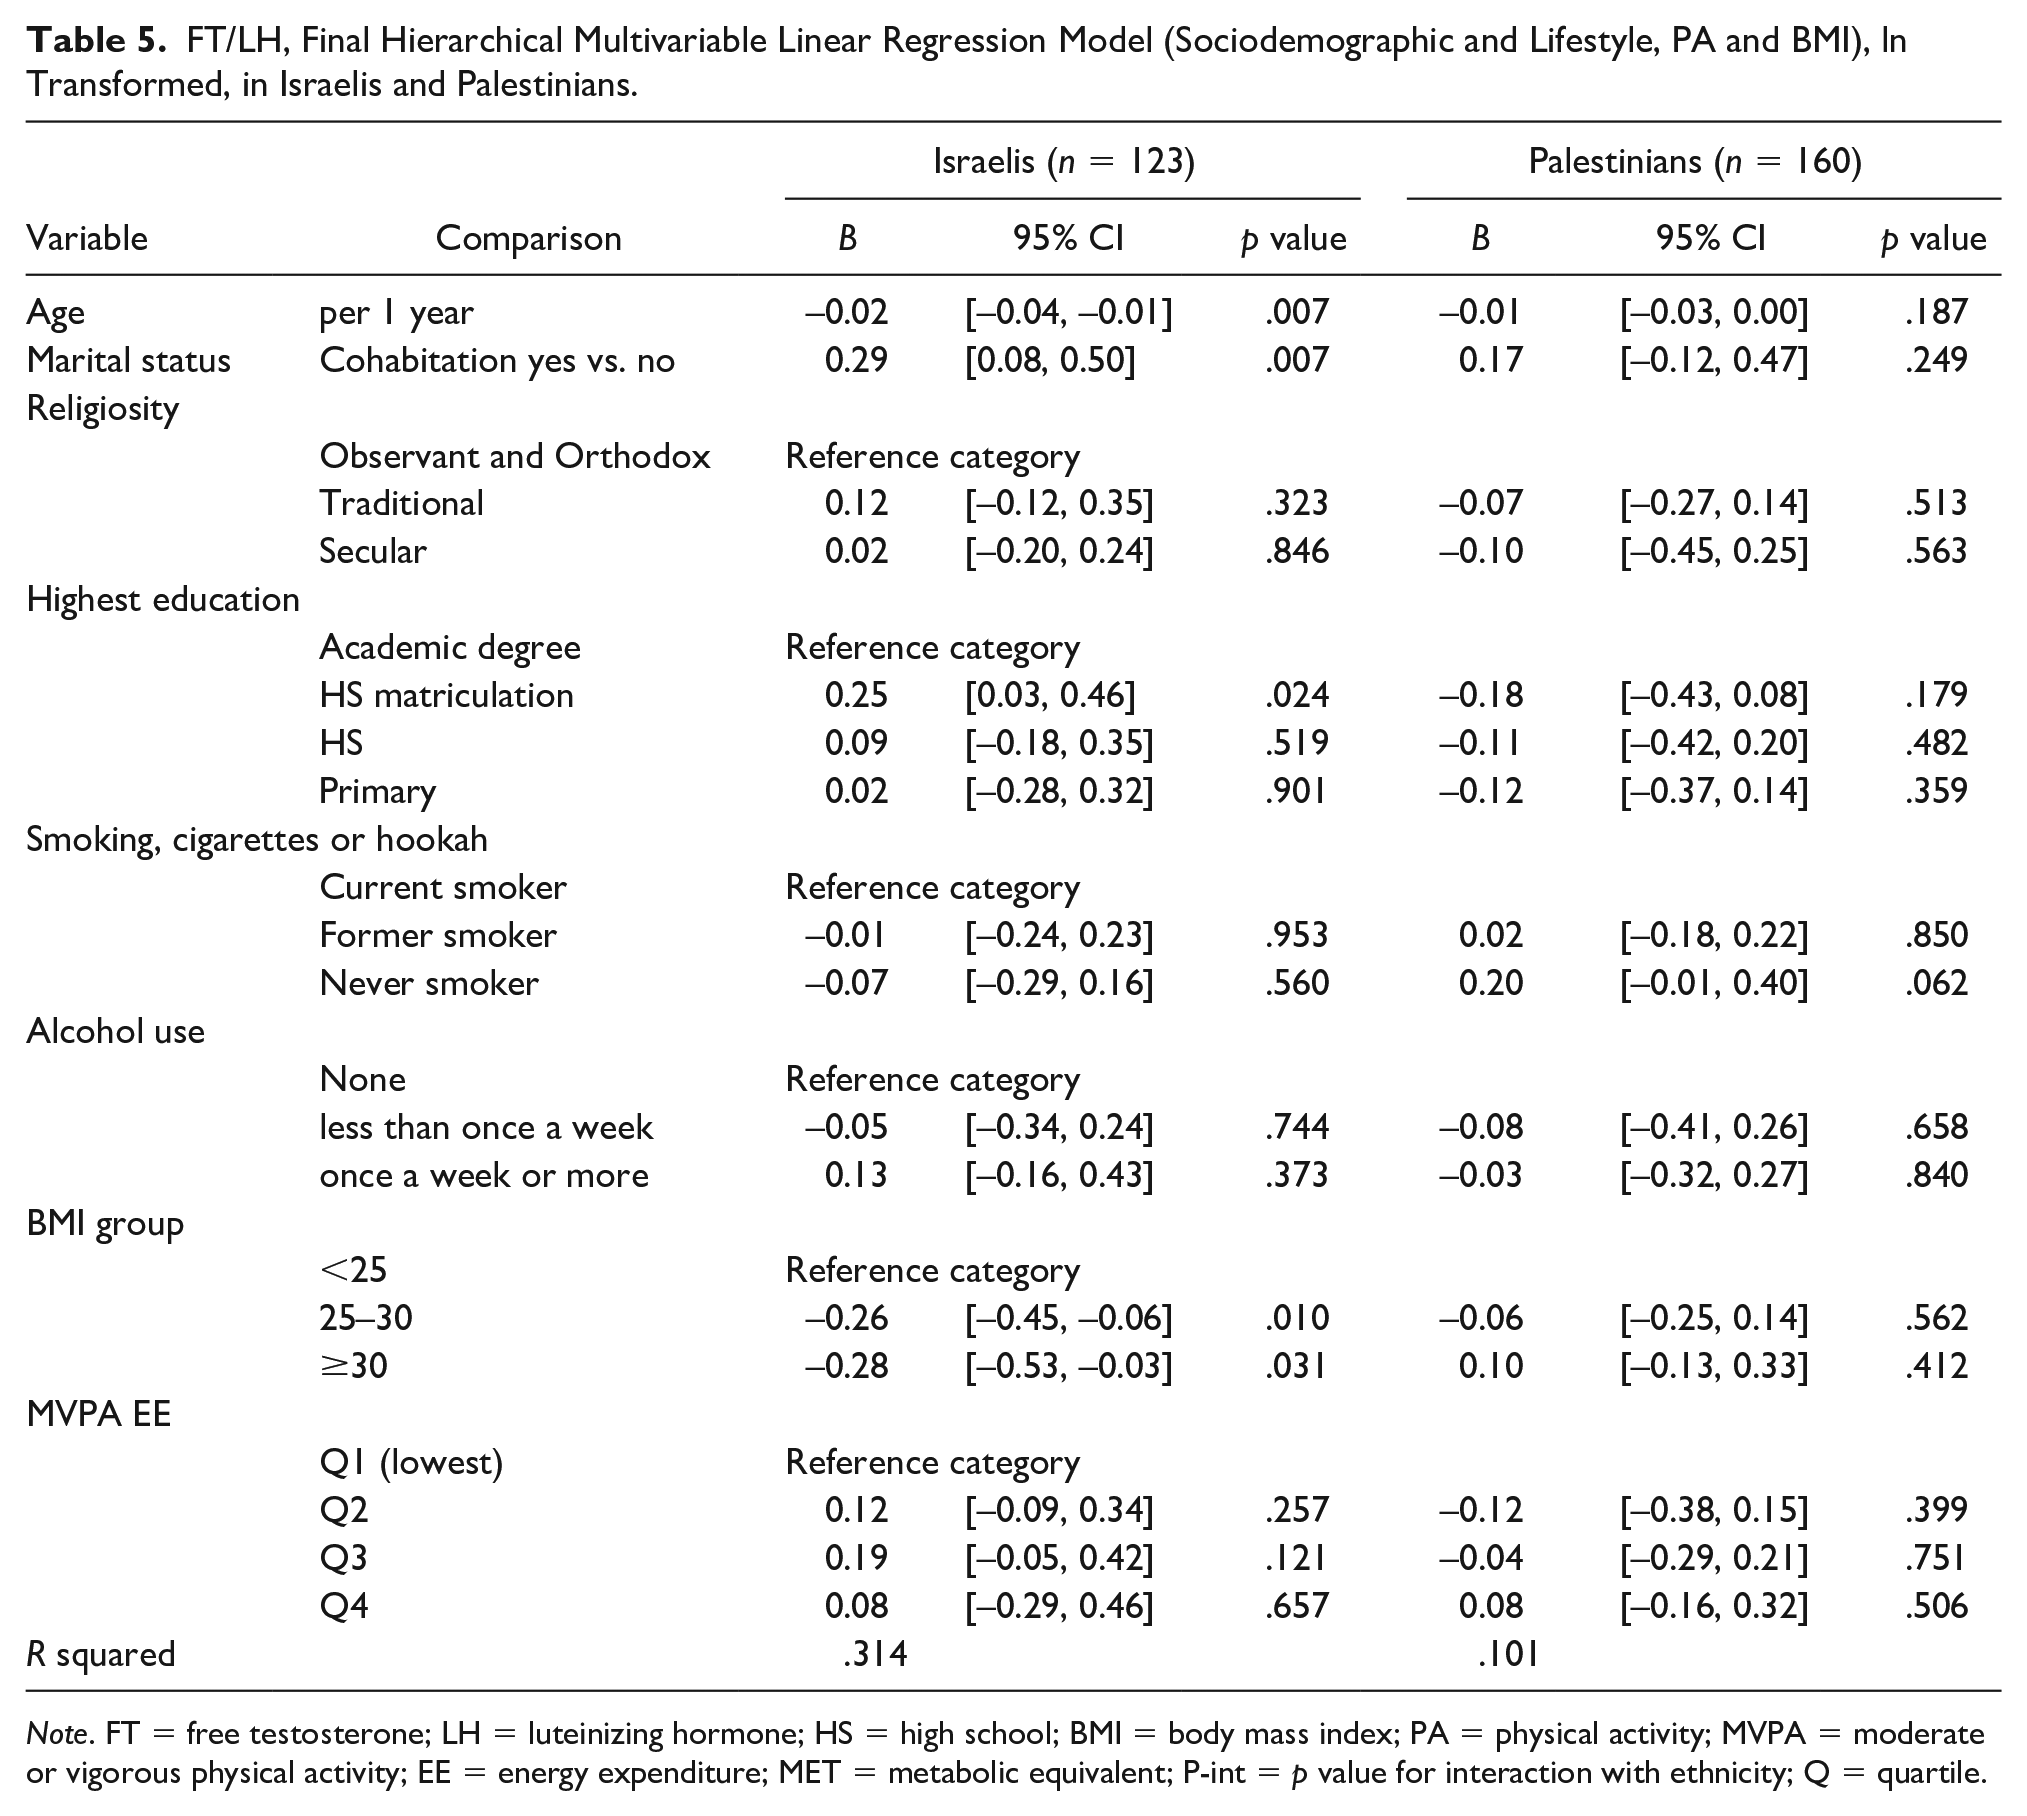
Note. FT = free testosterone; LH = luteinizing hormone; HS = high school; BMI = body mass index; PA = physical activity; MVPA = moderate or vigorous physical activity; EE = energy expenditure; MET = metabolic equivalent; P-int = p value for interaction with ethnicity; Q = quartile.
FT/LH, Final Hierarchical Multivariable Linear Regression Model (Sociodemographic and Lifestyle, PA and BMI), ln Transformed, in the Entire Sample, With and Without Interaction (n = 283).

Note. FT = free testosterone; LH = luteinizing hormone; HS = high school; PA = physical activity; BMI = body mass index; MVPA = moderate or vigorous physical activity; EE = energy expenditure; MET = metabolic equivalent; P int = p value for interaction with ethnicity; Q = quartile.
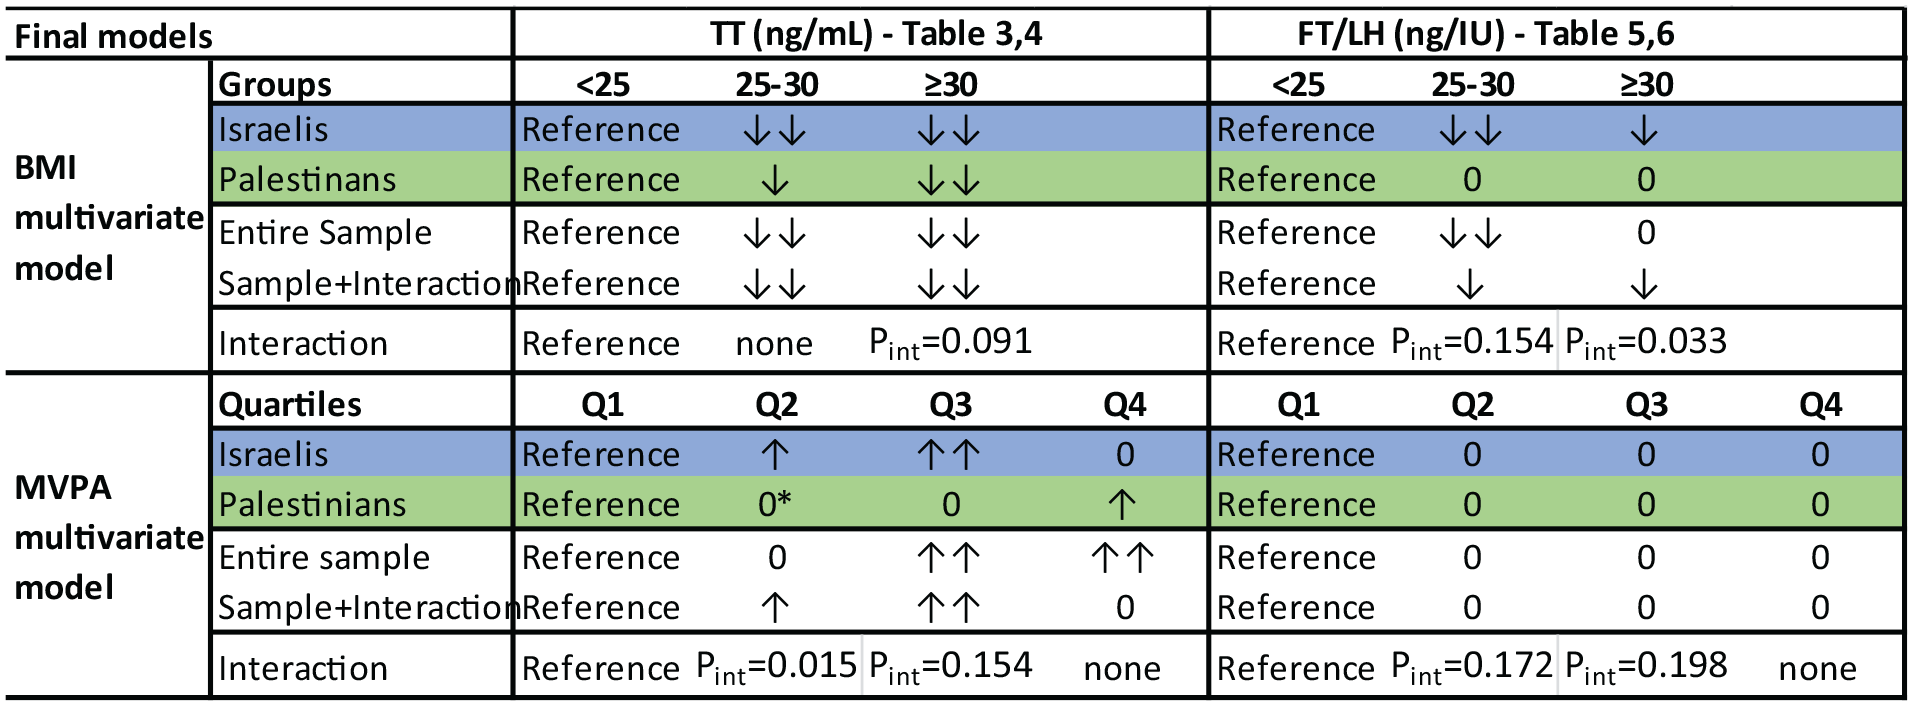
Hierarchal BMI and MVPA Final Models Summary: Associations of BMI, MVPA in Israelis, Palestinians, the Entire Sample, and the Interaction Model
Included as a variable in the entire sample model (Table 3), ethnicity was not associated with lnTT. In Israelis (Table 4), age was associated with lnTT in the final model (B = −0.02 per year, p = .007), and also in the entire sample. In Palestinians, however, age was associated with lnTT only in an adjusted Spearman’s correlation. An interaction was identified (Pint = 0.112). Marital status, on the contrary, was significantly associated in Palestinians (B = −0.29, p = .005) and the entire sample, but was not in Israelis. It lost significance in the interaction model, in which it had a Pint of 0.030.
Religiosity, education levels, and smoking did not have a clear trend regarding associations with lnTT. Alcohol consumption demonstrated a strong negative association in Israelis—B = −0.23, p = .03 in those drinking less than once a week, and B = −0.28, p = .01 in those drinking more than once a week, compared with nondrinkers. Palestinians had no clear association (p > .05) and interaction for both strata between Israelis and Palestinians was pronounced (Pint = 0.004 and 0.009).
BMI was negatively associated quite strongly with lnTT in all four final models generated. Contrasted with BMI <25, with B values of the 25 to 30 BMI group ranging from −0.16 to −0.27, BMI >30 had B values of −0.42 to −0.63 (p < .02 in all analyses). Stronger associations were revealed in Israelis and a mild interaction was identified for the BMI >30 group—Pint = 0.091.
The (positive) association of lnTT and MVPA had a more intricate pattern: With Q1 of MVPA as the reference group, Q2 and Q3 had a significant association only in Israelis, whereas Q4 had a significant association only in Palestinians. As depicted in Tables 3 and 4 and Figure 4 (asterisk), the Palestinian Q2 had an anomaly with a B of −0.11, the only stratum to have a negative association with lnTT. Interaction was identified for Q2 (Pint = 0.015) and less so for Q3 (Pint = 0.154).
The same models were generated for lnFT/LH (Tables 5 and 6), and ethnicity was significantly associated with lnFT/LH, with B = −0.22 in Palestinians compared with Israelis. Remarkably, none of the variables were associated with lnFT/LH in Palestinians. In Israelis, both age and marital status were associated with lnFT/LH (p = .007 for both). Religiosity, education groups, smoking and alcohol consumption, and MVPA were not associated with lnFT/LH.
In Israelis, BMI 25 to 30 and >30 groups had B = −0.26, p = .01 and B = −0.28, p = .031, respectively; this disparity with Palestinians resulted in a notable interaction in both strata: similar pronounced B values in the interaction models with significant interaction variables (Pint = 0.154 and 0.033).
Several sensitivity analyses were then employed to validate findings. As FT and BT are both considered to be physiologically available fractions, analyses were repeated for BT, with no significant differences in associations. Alternative grouping of strata for marital status and religiosity, and the use of BMI and PA as scale variables, were also tested. The waist hip ratio (WHR), a common measure of adiposity, was used as a substitute for BMI, broken into groups as defined by the WHO. Final models revealed similar associations in all cases.
Discussion
In this study, we compared the associations that various sociodemographic and lifestyle factors have with sex hormones between Palestinian and Israeli men in Jerusalem. In the entire sample, as well as in Israelis and Palestinians, several well-known associations of TT with age, marital status, and other sociodemographic and lifestyle factors were seen. Differences in these associations between Israelis and Palestinians were noted, with age, BMI, and PA having a stronger association in Israelis, and marital status having a stronger association in Palestinians. The FT/LH, which represents Leydig cell function, was identified to be associated with age, marital status, and BMI, but only in Israelis, which also had a much higher FT/LH ratio than Palestinians.
Sociodemographic Factors Associated With TT and Role of Ethnicity
Israelis had lower TT than Palestinians, with means lower but comparable to American (Rohrmann et al., 2007) and European (Halling et al., 2013) cohorts, all within the range of 5.1 to 6.3 ng/ml (direct comparisons are not possible due to methodological differences). No Middle Eastern regional data were available other than a small Gazan sample (Yassin et al., 2017) that had a TT of 5.0 ± 2.2 ng/mL, similar to 5.1 ± 2.2 ng/mL in our Palestinian sample.
Increasing age was associated with lower TT Israelis only, similar to previous reports from Denmark and other Western countries (Andersson et al., 2007; McBride et al., 2016; Muller et al., 2003), with a decline of 2% reduction per year. Notably, despite very similar age distributions, Palestinians had no association between age and TT (based on lnTT analyses). An Interaction between age and ethnicity was revealed for TT. While these differences could be related to many environmental or genetic causes, it is possible that effects of aging are variable between different ethnicities in regard to sex hormones.
Differences in TT by marital status were noted for both Palestinians and Israelis in line with studies among men from United States (Holmboe et al., 2017), Denmark (Maestripieri et al., 2014), and China (Gray et al., 2006), with higher TT in single men. Marital status was a stronger predictor of TT in Palestinian men and the entire sample than in Israelis. Interaction proved significant, signaling different effects in Israelis and Palestinians. A possible explanation could be the different proportion of married men in the sample—90.7% in Palestinians and 74.2% in Israelis, allowing for more pronounced effects in Palestinians. This finding could also stem from dissimilarities in reproductive effort (Gray et al., 2017) that might be different in Israelis and Palestinians. Some cultural differences in areas such as sexual behavior and promiscuity have been reported between religions and ethnicities (Adamczyk & Hayes, 2012) and are known to affect male androgen concentrations (Maestripieri et al., 2014). Associations of TT with religion and education, much like in the literature, are unclear in our sample. These associations are weak and insignificant.
Modifiable Lifestyle Factors
Smoking demonstrated a positive association with TT in both groups, with current smokers having higher TT than former and never smokers, consistent with previous literature (Muller et al., 2003; Shiels et al., 2009; Svartberg et al., 2003; Svartberg & Jorde, 2006). The Israeli model demonstrated a milder, nonsignificant association. Possible explanations of the elevated testosterone concentrations in smokers involve aromatase inhibition (Shiels et al., 2009), reducing conversion of testosterone to estradiol, and the shared breakdown pathway of nicotine, androgens, and their metabolites through glucuronidation by the same enzymes (Zhao et al., 2016). Whereas Leydig cell function alteration could also be a possible mechanism (Shiels et al., 2009; Svartberg & Jorde, 2006), FT/LH was not associated at all with smoking.
Alcohol use has been previously considered to have no or positive association with TT (Muller et al., 2003; Shiels et al., 2009), but, surprisingly, a negative association was identified in our Israeli sample for the two drinking groups over the no consumption group. The no consumption group numbered only 14/124 of Israelis, possibly distorting the association. The strong interaction between alcohol and ethnicity (Pint < .01) could be attributed to the widely discordant prevalence of alcohol use as 88.6% Israelis drank alcohol and 84.4% of Palestinians did not.
In both groups and in the entire sample, associations of TT with BMI (negative) and PA (positive) were consistent with most of the literature (Allen et al., 2002; Muller et al., 2003; Shiels et al., 2009; despite limited contradicting evidence; Svartberg et al., 2003). Both BMI and PA associations were more pronounced in Israelis.
Based on B values, Israelis had stronger associations with BMI. Ethnicity was revealed to interact with these associations. Different patterns of obesity in ethnic groups were described by Lopez et al. (2013), attributed in part to differences in visceral and subcutaneous adipose tissue (Carroll et al., 2008). Hill et al. (1999) reported ethnic (White and Black men) differences in tomographic imaging of visceral and subcutaneous adipose tissue, despite adjusting for obesity metrics. Similar analyses have not been done between Israelis and Palestinians. Such differences could explain the interaction in our study as visceral adipose tissue has higher metabolism of androgens than subcutaneous adipose tissue.
Both Israelis and Palestinians demonstrated a known, positive association between PA and TT. The PA quartiles in both groups had different associations: the second and third quartiles were associated with PA in Israelis only (and had corresponding Pint), and the fourth quartile was associated in Palestinians only. Of note, baseline distributions were quite different between the groups—Israelis comprised only 10/71 of men in the fourth quartile of PA. A possible explanation might be a different distribution of types of PA between the groups. The MESA questionnaire used in our sample inquired mainly about aerobic activities. For example, it is known (Eliakim & Nemet, 2006) that anaerobic PA elevates testosterone levels more than aerobic activity.
In addition, as previously published (Merom et al., 2012), activities that constitute PA are different between the ethnic groups: Palestinians had their PA derived primarily from their work (39% vs. 22% in Israelis) rather than leisure. This was demonstrated to be true in sensitivity analyses carried out in our sample as well: ethnic differences in leisure time PA were less pronounced than total MVPA.
Leydig Cell Function and Ethnicity
The FT/LH ratio is a seldom used measure of the HPG axis and Leydig cell function. Its associations with PA were previously described (Priskorn et al., 2016). To our knowledge, this is the first study to evaluate FT/LH ratio in this manner for other factors. Primary differences in sex hormones between Israelis and Palestinians were noted in FT/LH (31.2 ng/IU vs. 25.8 ng/IU) and could be secondary to LH differences (3.90 IU/L vs. 4.96 IU/L). The paucity of Middle Eastern andrological literature allows for limited interpretation of this finding; as noted, the FT/LH ratios are not readily available for comparison in the literature.
The FT/LH ratio was not correlated with any variables in the Palestinian group, which could mean that it is not a suitable metric for some populations. The FT/LH had an association with age in Israelis only, consistent with current literature indicating a reduced Leydig cell function with age. The FT/LH also had an association with marital status (B = 0.29 for married men over single men) in Israelis only. This increase is not evident in Palestinians in Table 5, with FT/LH ratios similar between marital status groups but was significant in the adjusted models (Table 6). This finding also contradicts some of the findings of Holmboe et al. (2017). In their study, TT/LH was used to reflect Leydig cell function, and was not reported to be correlated with marital status. No associations of religiosity, education, alcohol, or smoking with FT/LH were reported. The FT/LH ratios were not associated with PA, corroborating a very similar analysis (Priskorn et al., 2016) of association of PA quartiles with FT/LH.
Different physiological and disease processes are extensively documented between Israelis and Palestinians (Kark et al., 2006; Mahamid et al., 2019; Merom et al., 2012; Weiss et al., 2015). TT proved similar in the two groups. These similarities in hormone concentrations were also described in the NHANES III cohort (Rohrmann et al., 2007) in which TT levels were reported to be similar between non-Hispanic Black, non-Hispanic White, and Mexican Americans, and virtually identical to our Middle Eastern sample. In addition, a variety of ethnic differences in relationships and gender roles between Israelis and Palestinians can also play a part. Cultural differences in sexual behavior and reproductive effort, as discussed above, are prime examples.
Our study has several weaknesses, such as the cross-sectional design, precluding us from inferring casual relationships. It also might have had some recall bias of self-reported behaviors that lead to misclassifications and may weaken associations. Our assessment of hormone measurements and Leydig cell function was based on immunological tests rather than more precise methods. In addition, the possibility of selection bias exists, as the response rate was low, more so among Israelis compared with Palestinians.
In conclusion, similar to previous reports, various factors were identified to be positively associated with TT—young age, being single, lower BMI, and higher PA. Importantly, associations reported in the United States, Europe, and elsewhere were corroborated in our Middle Eastern sample. This was more pronounced in Israelis, with Palestinians having weaker associations. Moreover, FT/LH was a relevant measure of Leydig cell function in Israeli men only. Differences between Israelis and Palestinians are partially explained by the discussed social and behavioral differences. Variant demographics and genetics also play a role. These ethnic differences are to be elucidated in further research.
Supplemental Material
sj-xlsx-1-jmh-10.1177_15579883221106060 – Supplemental material for Different Factors Are Associated With Sex Hormones and Leydig Cell Function in Israelis and Palestinians in Jerusalem
Supplemental material, sj-xlsx-1-jmh-10.1177_15579883221106060 for Different Factors Are Associated With Sex Hormones and Leydig Cell Function in Israelis and Palestinians in Jerusalem by Guy Vishnevsky, Ronit Sinnreich, Hisham Nassar, Dafna Merom, Maya Ish-Shalom, Jeremy D. Kark and Hagai Levine in American Journal of Men’s Health
Supplemental Material
sj-xlsx-2-jmh-10.1177_15579883221106060 – Supplemental material for Different Factors Are Associated With Sex Hormones and Leydig Cell Function in Israelis and Palestinians in Jerusalem
Supplemental material, sj-xlsx-2-jmh-10.1177_15579883221106060 for Different Factors Are Associated With Sex Hormones and Leydig Cell Function in Israelis and Palestinians in Jerusalem by Guy Vishnevsky, Ronit Sinnreich, Hisham Nassar, Dafna Merom, Maya Ish-Shalom, Jeremy D. Kark and Hagai Levine in American Journal of Men’s Health
Supplemental Material
sj-xlsx-3-jmh-10.1177_15579883221106060 – Supplemental material for Different Factors Are Associated With Sex Hormones and Leydig Cell Function in Israelis and Palestinians in Jerusalem
Supplemental material, sj-xlsx-3-jmh-10.1177_15579883221106060 for Different Factors Are Associated With Sex Hormones and Leydig Cell Function in Israelis and Palestinians in Jerusalem by Guy Vishnevsky, Ronit Sinnreich, Hisham Nassar, Dafna Merom, Maya Ish-Shalom, Jeremy D. Kark and Hagai Levine in American Journal of Men’s Health
Footnotes
Acknowledgements
The authors wish to thank the participants of this study for their willingness to participate.
Authors’ Contributions
H.L. conceived the study question, designed it, and takes overall responsibility for the study. G.V. analyzed the data, interpreted it, and wrote the manuscript, with revision by H.L. and critical discussion by all the authors. J.D.K. supervised the Middle Eastern Regional Cooperation (MERC) study, participated in conceiving the study question, and contributed to data analysis. R.S. supervised data collection. H.N. supervised data collection from the Palestinian participants. Sex hormone data were acquired by H.L. and M.I-S. The final manuscript and order of authorship have been reviewed and approved by all authors.
Declaration of Conflicting Interests
The author(s) declared no potential conflicts of interest with respect to the research, authorship, and/or publication of this article.
Funding
The author(s) disclosed receipt of the following financial support for the research, authorship, and/or publication of this article: The work was supported by the USAID MERC Program (Grant No. TA-MOU-01-M21-002) and by the Environment and Health Fund, within the framework of The Hebrew University Center of Excellence in Agriculture and Environmental Health.
Supplemental Material
Supplemental material for this article is available online.
References
Supplementary Material
Please find the following supplemental material available below.
For Open Access articles published under a Creative Commons License, all supplemental material carries the same license as the article it is associated with.
For non-Open Access articles published, all supplemental material carries a non-exclusive license, and permission requests for re-use of supplemental material or any part of supplemental material shall be sent directly to the copyright owner as specified in the copyright notice associated with the article.