
Abstract
This study aims to analyze the prevalence and likelihood of overweight, obesity, and elevated body mass index (BMI) among sexual minority men (i.e., men who have sex with men [MSM], men who have sex with men and women [MSMW], and all sexual minority men), using men who have sex with women (MSW) as the reference group. Studies reporting mean BMIs or prevalence or likelihood of obesity, overweight, or elevated BMI categorized by sexual orientation were included. Data were pooled and analyzed to report mean differences (MDs) of BMIs, prevalence rates, odds ratios (ORs), and their respective 95% confidence intervals (CIs). Forty-three studies were included, with a median of 26,507 participants (median 3.37% sexual minority men). The respective mean overweight, obesity, and elevated BMI prevalence rates among MSM (36%, 23%, and 39%) and MSMW (33%, 27%, and 47%) were lower than those of MSW (44%, 26%, and 55%). This finding was consistent with a significantly lower BMI (MD −1.50 [−1.93, −1.08] kg/m2) and a decreased likelihood of overweight (OR 0.75 [0.64, 0.88]) and obesity (OR 0.84 [0.78, 0.90]). Sexual minority men present with a lower prevalence and likelihood of obesity and overweight than their heterosexual counterparts. The obesity paradox—a sustained catabolic state presenting with lower BMI—is a feasible explanation for this phenomenon, although further research exploring paradoxical cardiovascular findings is granted.
Keywords
Introduction
Obesity is a complex, multidimensional, metabolic disease associated with serious cardiovascular diseases (CVDs), including hypertension, dyslipidemias, and type 2 diabetes mellitus (Flegal et al., 2013; Singh-Manoux et al., 2018). CVD continues to be the leading cause of morbidity and mortality worldwide (Caceres et al., 2020). The body mass index (BMI) is the weight-for-height index most widely used to assess weight status in clinical and epidemiological settings. Despite a better understanding of obesity pathogenesis and management, the prevalence rate of elevated BMI (≥25.0 kg/m2, i.e., combined overweight and obesity) has shown an upward global trend (Dai et al., 2020). Since 1975, worldwide prevalence rates of elevated BMI have tripled; and estimates from 2016 show that 39% of adults had an elevated BMI while 13% were obese (BMI ≥30.0 kg/m2; WHO, 2020). In the United States, the crude prevalence rate of obesity among adults was estimated at 39.8%, an increase by 9.1% from 1999 (Hales et al., 2017).
Obesity prevalence rates peak between 40 and 60 years of age. Adult women in the United States are more likely to be obese than men (Hales et al., 2017; Purnell, 2000). Worldwide, men present with higher mortality rates and more disability-adjusted life years (DALYs) associated with elevated BMI (Dai et al., 2020). Data from the United States indicate that since 1960, the prevalence rate of overweight (BMI ≥25.0 and <30.0 kg/m2) slowly decreased, while the prevalence of obesity and severe obesity (BMI ≥40.0 kg/m2) increased for both genders, more noticeably for men (Fryar et al., 2018).
Among men, a handful of studies have addressed the issue of weight disparities by sexual orientation. Caceres et al. (2017) reviewed 15 studies reporting weight disparities among sexual minority men. The review identified two-thirds of the studies reporting a decreased likelihood of elevated BMI among sexual minority men compared with their heterosexual counterparts (Caceres et al., 2017). The reasons for these disparities can be framed within the Minority Stress Theory, which posits that sexual minority health disparities result in large part from life of stressors induced by nonconformity to a heteronormative environment (Meyer, 2003). These life stressors include general life events (e.g., financial adversity), structural and institutional factors (e.g., laws, policies, and social norms), interpersonal factors (e.g., discrimination, stigma, and violence), and intrapersonal factors (e.g., self-stigma and concealment; Meyer, 2003). Flentje et al. (2020) conducted a systematic review that identified three studies associating 13 minority stressors with changes in the BMI in 31% of these comparisons. Changes in cortisol levels have been posited as a plausible biobehavioral mechanism linking life stressors to poor cardiovascular outcomes (Huebner et al., 2021). The impact of life stressors on biopsychosocial drivers of CVD in general—and obesity in particular—is such that the American Heart Association incorporated them in the conceptual model for cardiovascular health disparities among sexual minority adults (Caceres et al., 2020), and the disparities in obesity prevalence and CVD outcomes are subject of a growing research agenda (cf. VanKim & Laska, 2021).
Sexual minority men seem to present with an overall decreased prevalence of elevated BMI (VanKim & Laska, 2021), which does not necessarily translate into a healthier cardiometabolic status. The obesity paradox in CVD asserts that overweight or class I obese (BMI ≥30.0 but <35.0 kg/m2) persons may have better CVD outcomes compared with normal-weight (18.5 ≤ BMI <25.0 kg/m2) or underweight (BMI <18.5 kg/m2) persons (Antonopoulos & Tousoulis, 2017; Carbone et al., 2019). The poor prognosis for individuals with normal or underweight may be a result of a progressive and sustained catabolic state, with weight loss resulting from disproportionate loss of lean mass (Elagizi et al., 2018). Among sexual minority men, cardiovascular outcomes often associated with obesity—such as hypertension, diabetes, and dyslipidemias (Caceres et al., 2017; López Castillo et al., 2021)—are more prevalent. A first explanation of this paradoxical phenomenon is consistent with life stressors. Sexual minority men report an increased drive for muscularity (Calzo et al., 2013) and more weight-related stigma (Fulton & Srinivasan, 2021; Puhl et al., 2019), which partially explain motivations and behaviors to actively avoid an elevated BMI. A second explanation involves a higher prevalence of HIV infection among sexual minority men. Man-to-man sexual contact continues to be the dominant HIV transmission mechanism (81% of new infections in 2018), with an all-time-high linkage to and retention in antiretroviral therapy (ART; 65% and 49%, respectively) (Centers for Disease Control and Prevention [CDC], 2022). Approximately half of people living with HIV will develop central fat accumulation soon after starting ART (Grunfeld et al., 2010) and both HIV infection and ART are associated with significantly increased BMI, waist circumference, overweight and obesity, and prevalence of abdominal obesity (Nduka et al., 2016; Sarkar & Brown, 2000; Shlay et al., 2007). Cortisol has also been described as a mediator of obesity among people living with HIV receiving ART and developing this Cushing syndrome–like reaction (Stanley & Grinspoon, 2012).
Although previous descriptive work reported disparate prevalence rates of overweight and obesity among sexual minorities (Caceres et al., 2017; Flentje et al., 2020), to date, these disparities have not been quantified using meta-analytic techniques. Given the importance of accurate estimates to advance efforts preventing CVD in populations at increased risk, such as sexual minority men, the current meta-analysis aims to summarize the prevalence and likelihood of overweight, obesity, and elevated BMI among sexual minority men, using men who have sex with women (MSW) as the reference group.
Method
Protocol and Registration
The full keyword search and study research questions were prospectively published in the International Prospective Register of Systematic Reviews (PROSPERO; University of York, United Kingdom; Registration CRD42020213163). The Institutional Review Board (IRB) at the University of Central Florida reviewed the PROSPERO study protocol and determined it did not meet the definition of research involving human subjects and, thus, IRB review and approval were not required (STUDY00002927).
Data Sources and Keyword Search
The keyword search was created, reviewed, and conducted in the following four databases using the native search interface from their date of inception until December 2020: the Cumulative Index to Nursing and Allied Health Literature (CINAHL), PsycINFO, the Web of Science, and PubMed. Keyword variants for the MSM population ([[gay OR bisexual OR homosexual OR heterosexual] AND men] OR [“men who have sex with men” OR MSM]) and for the outcome of interest the keywords “obesity” and “overweight” were used. The reference lists of the selected articles were also manually searched for additional relevant records.
Inclusion Criteria
Only original research articles in peer-reviewed publications were included for analysis. Besides this criterion, the search was not restricted by dates, language, geographic area, participants’ age, or analytic methods as long as the studies complied with the inclusion criteria. Abstracts from the records obtained were reviewed for relevance and included for data extraction if (a) the article analyzed primary or secondary data sources; (b) the population studied included sexual minority men (either as a single, aggregated category or categorized as men who have sex with men [MSM] and/or men who have sex with men and women [MSMW] as separate categories) defined by either behavior, identity, attraction, or a combination of these; (c) the article reported analyses or subanalyses of obesity, overweight, or elevated BMI specific to sexual minority men; (d) the article included a quantifiable population of MSW, defined by either behavior, identity, attraction, or a combination of these, that could be used as a reference group; and (d) regardless of statistical significance, the article reported at least one measure of prevalence, aggregated descriptive measures of obesity, overweight, or elevated BMI (including, but not limited to BMI or abdominal circumference), or inverse variance measures (i.e., odds ratio [OR], prevalence ratio [PR], or their respective regression coefficients [β] in the case of generalized linear regression models). Because nonbinary and/or transgender populations are both small and diverse, records focusing exclusively on these populations were excluded to reduce the risk of misclassification and to avoid underpowered comparisons.
Abstraction Process
Articles were reviewed, extracted, synthesized, and study quality was assessed by four reviewers (SC, DV, NN, and IB). Every record was independently reviewed by at least two reviewers to calculate agreement metrics (i.e., Holsti’s percentage concordance and Cohen’s kappa; Cohen, 1968; Holsti, 1969). Disagreements were resolved by a fifth reviewer (HLC) in consultation with the original reviewers.
When reported, demographic measures of the studies’ samples (including, but not limited to, proportion of men and women included, sampling methods, data source, and distribution by age, race/ethnicity, geographic location, and sexual orientation) were extracted for context to understand the role of potential biases and confounders. The keyword search, data abstraction, and study inclusion followed the Preferred Reporting Items for Systematic Reviews and Meta-Analyses (PRISMA; Liberati et al., 2009).
Measures
Sexual Orientation
Self-reported sexual identity and attraction (whether romantic or sexual) often—although not always—align with self-reported sexual behavior (Wolff et al., 2017). Thus, the sexual minority populations to be included (i.e., sexual minority men, MSM, and/or MSMW) were defined preferably through behavioral measures of sexual orientation and, when other measures of sexual orientation were available (i.e., self-reported sexual identity, sexual or romantic attraction, or a combination of these), these were included and assumed to be mostly concordant.
Overweight, Obesity, and Elevated BMI
The authors extracted data from studies reporting mean (standard deviation [SD]) values for BMI (in kg/m2) or mean abdominal circumference (in cm). Prevalence measures of overweight, obesity, and elevated BMI were extracted from self-reported lifetime diagnosis of overweight or obesity (yes/no), crude and/or adjusted measures of prevalence, and inverse variance measures. All studies used the standard calculation for BMI (weight in kg/[height in m]2) and the agreed-upon categories for overweight (BMI ≥25.0 and <30.0 kg/m2), obesity (BMI ≥30.0 kg/m2), severe obesity (BMI ≥40.0 kg/m2), and elevated BMI (≥25.0 kg/m2, i.e., combined overweight and obesity).
Bias Assessment
Recommendations for bias assessment in observational studies (Hammer et al., 2009) were followed by using a bias assessment tool evaluating the risk of selection, information, and response bias in each article included. In addition, the risk of confounding by four factors (namely, age, education, income, and HIV serostatus) was assessed for each study.
Statistical Analyses
Three, separate meta-analyses were conducted for studies reporting crude or adjusted mean BMI; crude or adjusted prevalence rates of overweight, obesity, or elevated BMI; and crude or adjusted measures of inverse variance. Mean BMIs were pooled and compared using mean differences (MD) with their respective 95% CIs. Prevalence and inverse variance measures were pooled, and weights were assigned to each study using the reciprocal of their variance. All meta-analyses were conducted assuming random effects. As age can operate as a confounder, we conducted an exploratory meta-regression of prevalence and inverse variance measures on age for those studies reporting mean age.
Forest plots were generated by Review Manager v. 5.4.1 (The Cochrane Collaboration; Copenhagen, Denmark) and are presented as supplementary figures following the best practices for forest plots (Higgins et al., 2011). Meta-regressions of prevalence estimates by age were generated with Comprehensive Meta-Analyses v. 3.0 (Biostat, Inc.; Englewood, NJ). Heterogeneity for study comparisons was determined through I2 (Lin & Chu, 2018), and funnel plot analyses were conducted to assess for study heterogeneity, reporting bias, and chance (Sterne et al., 2011).
Results
The keyword and manual search strategy identified 325 unique records. Titles and abstracts independently screened by four reviewers were found with moderate Holsti’s concordance (r = .750) and moderate Cohen’s κ (mean κ = .513; range .445–.578). After resolution of disagreements through discussion and consensus, the full text of 111 records was reviewed for compliance with inclusion criteria. Sixty-eight studies were excluded, mostly due to lack of specific subanalyses of sexual minority men (n = 27) or lack of original research with primary or secondary data sources (n = 17). Supplementary Figure S1 summarizes the PRISMA sequence for screening steps, concluding with the inclusion of 43 studies for meta-analytic comparisons.
The 43 studies included (Table 1) were published between 1996 and 2020; and almost half of them (n = 21) were published within the last five years of that date range (i.e., 2016-2020). Despite the lack of language restriction in this search, all studies were published in English and used secondary data from country- or state-level surveys. Most studies (n = 38) were conducted in the United States, two in the United Kingdom (Calzo et al., 2018; Conner et al., 2004), one each in Canada (Brennan et al., 2010) and Denmark (Frisch & Zdravkovic, 2010), and one multinational study across Brazil, Mexico, and the United States (Nyitray et al., 2019). Twenty-five of the 38 studies conducted in the United States were nationally representative; 12 were conducted at the state level (7 in California, 2 in Washington, and 1 each in Massachusetts, Minnesota, and Oregon), and one at an unspecified northeastern university college. All studies had an observational design and analyzed cross-sectional, single-timepoint data.
Characteristics of the 43 Studies Included in the Meta-Analysis.

Note. GUTS = growing up today study; BMI = body mass index; H = heterosexual; B = bisexual; G = gay; M = men; W = women; NR = not reported; BRFSS = behavioral risk factor surveillance system; H/L = Hispanic/latinx; AA/B = African American/black; GfK = growth from knowledge;
Percentages with one decimal place were directly reported in the study, while percentages with two decimal places were calculated from data reported in the study. bAll numbers reported correspond to observations from repeated-measures longitudinal data. cFor participants 12–20 y, BMI was converted to age- and sex-specific BMI Z-scores using CDC standards. dDefined as BMI ≥25 kg/m2. eDefined as BMI ≥25 kg/m2 but <30 kg/m2. fDefined as BMI ≥30 kg/m2. gCombined for men and women. hFor valid data points reporting BMI; the forest plot in Supplementary Figure 1 only includes the comparisons for 57 H vs. 34 G men reported, and excludes 26 H White and 23 H Black men whose. i Obesity was subclassified as Grade 1 (BMI≥30 kg/m2 but <35 kg/m2), Grade 2 (BMI≥35 kg/m2 but <40 kg/m2), or Grade 3 (BMI≥40 kg/m2). jThe 2011 Money, Sex, and Love Survey (Study 5) does not report measures relevant to this meta-analysis and, thus, was excluded. kGrade 2 and Grade 3 obesity were combined as a single category. l Authors were contacted to verify the absolute numbers of M and W participants.
The number of male participants ranged between 58 (Conner et al., 2004) and 11,767,858 (Deputy & Boehmer, 2010) with a median (interquartile range [IQR]) of 26,507 (5,710, 63,704) participants. The percentage of sexual minority men included in the studies as a proportion of all male participants ranged from 0.07% (Frisch & Zdravkovic, 2010) to 79.64% (Davids & Green, 2011), with a median (IQR) of 3.37% (2.63%, 4.70%).
Mean BMI
Figure 1 presents the forest plot from the 12 studies reporting BMI means and their respective variance for the populations of interest. For these studies, the overall MDs (95% CIs) by subgroups were −2.00 (−4.35, 0.36) kg/m2 for all sexual minority men (Subgroup 1.A), −1.50 (−1.93, −1.08) kg/m2 for MSM (Subgroup 1.B), and 0.12 (−1.55, 1.78) kg/m2 for MSMW (Subgroup 1.C.). Overall, heterogeneity for the subgroup comparisons was high (I2=99%) with a statistically significantly lower BMI (MD −1.42; 95% CI [−1.88, −0.95 kg/m]2) for the pooled subgroup analysis.
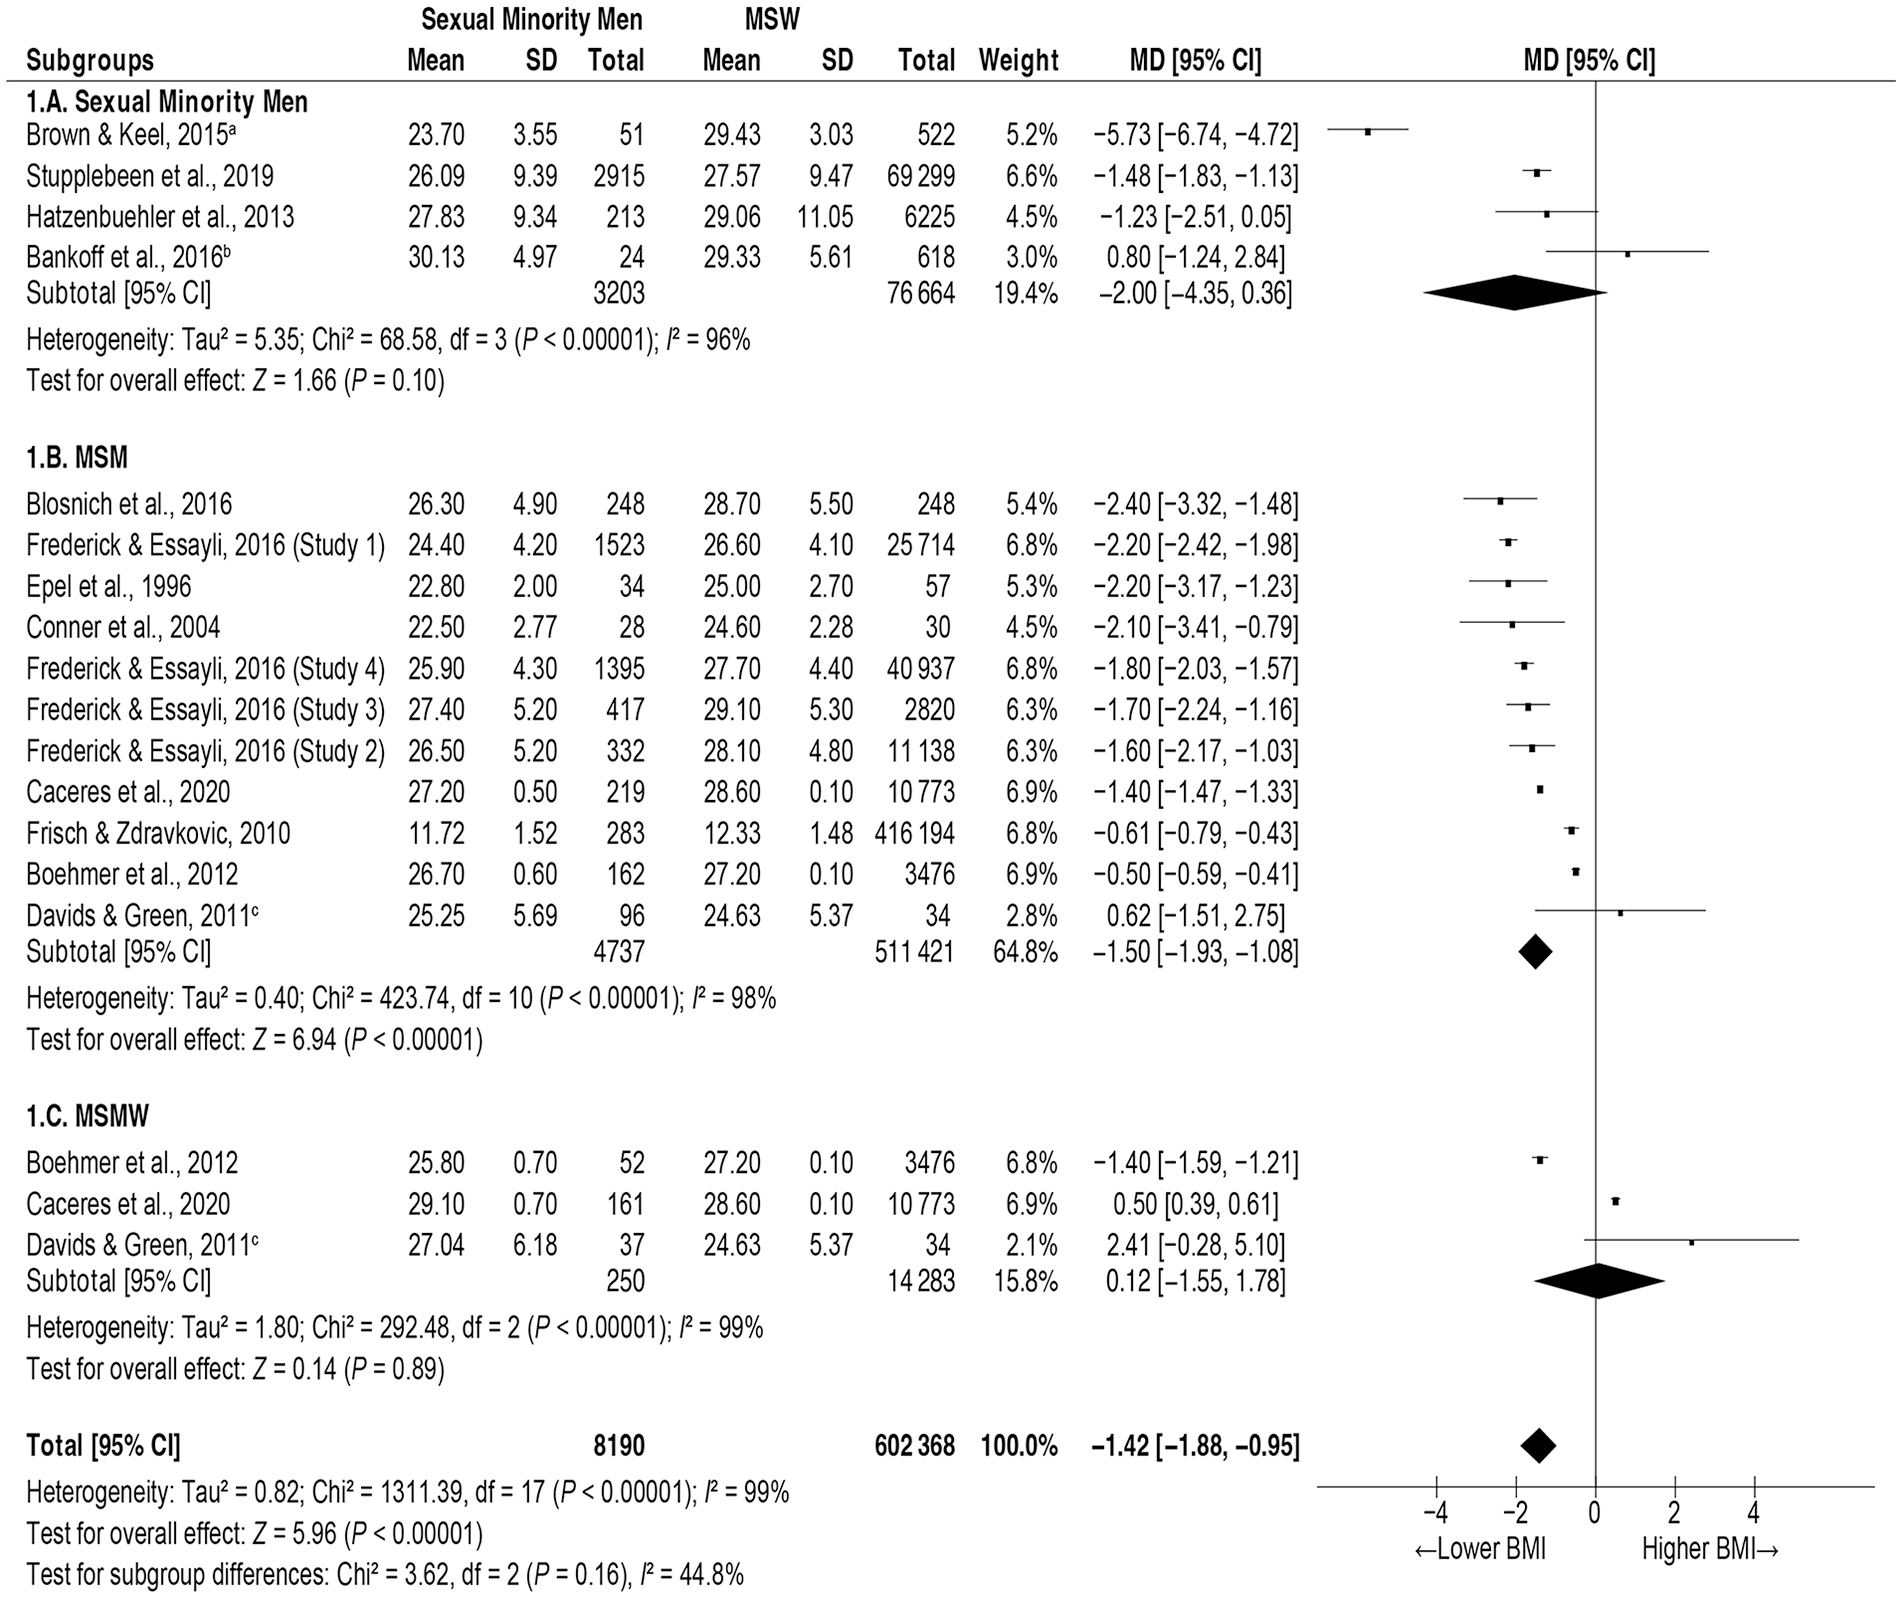
Forest Plot of Studies Reporting Mean Values of BMI Among Sexual Minority Men.
Prevalence Estimates
Table 2 presents a summary of the point estimates of prevalence rates for overweight, obesity, and elevated BMI by sexual orientation for all studies included. Study-by-study forest and funnel plots are presented in Supplementary Figures S2 and S3, respectively.
Prevalence Estimates of Overweight, Obesity, and Elevated BMI by Sexual Orientation.
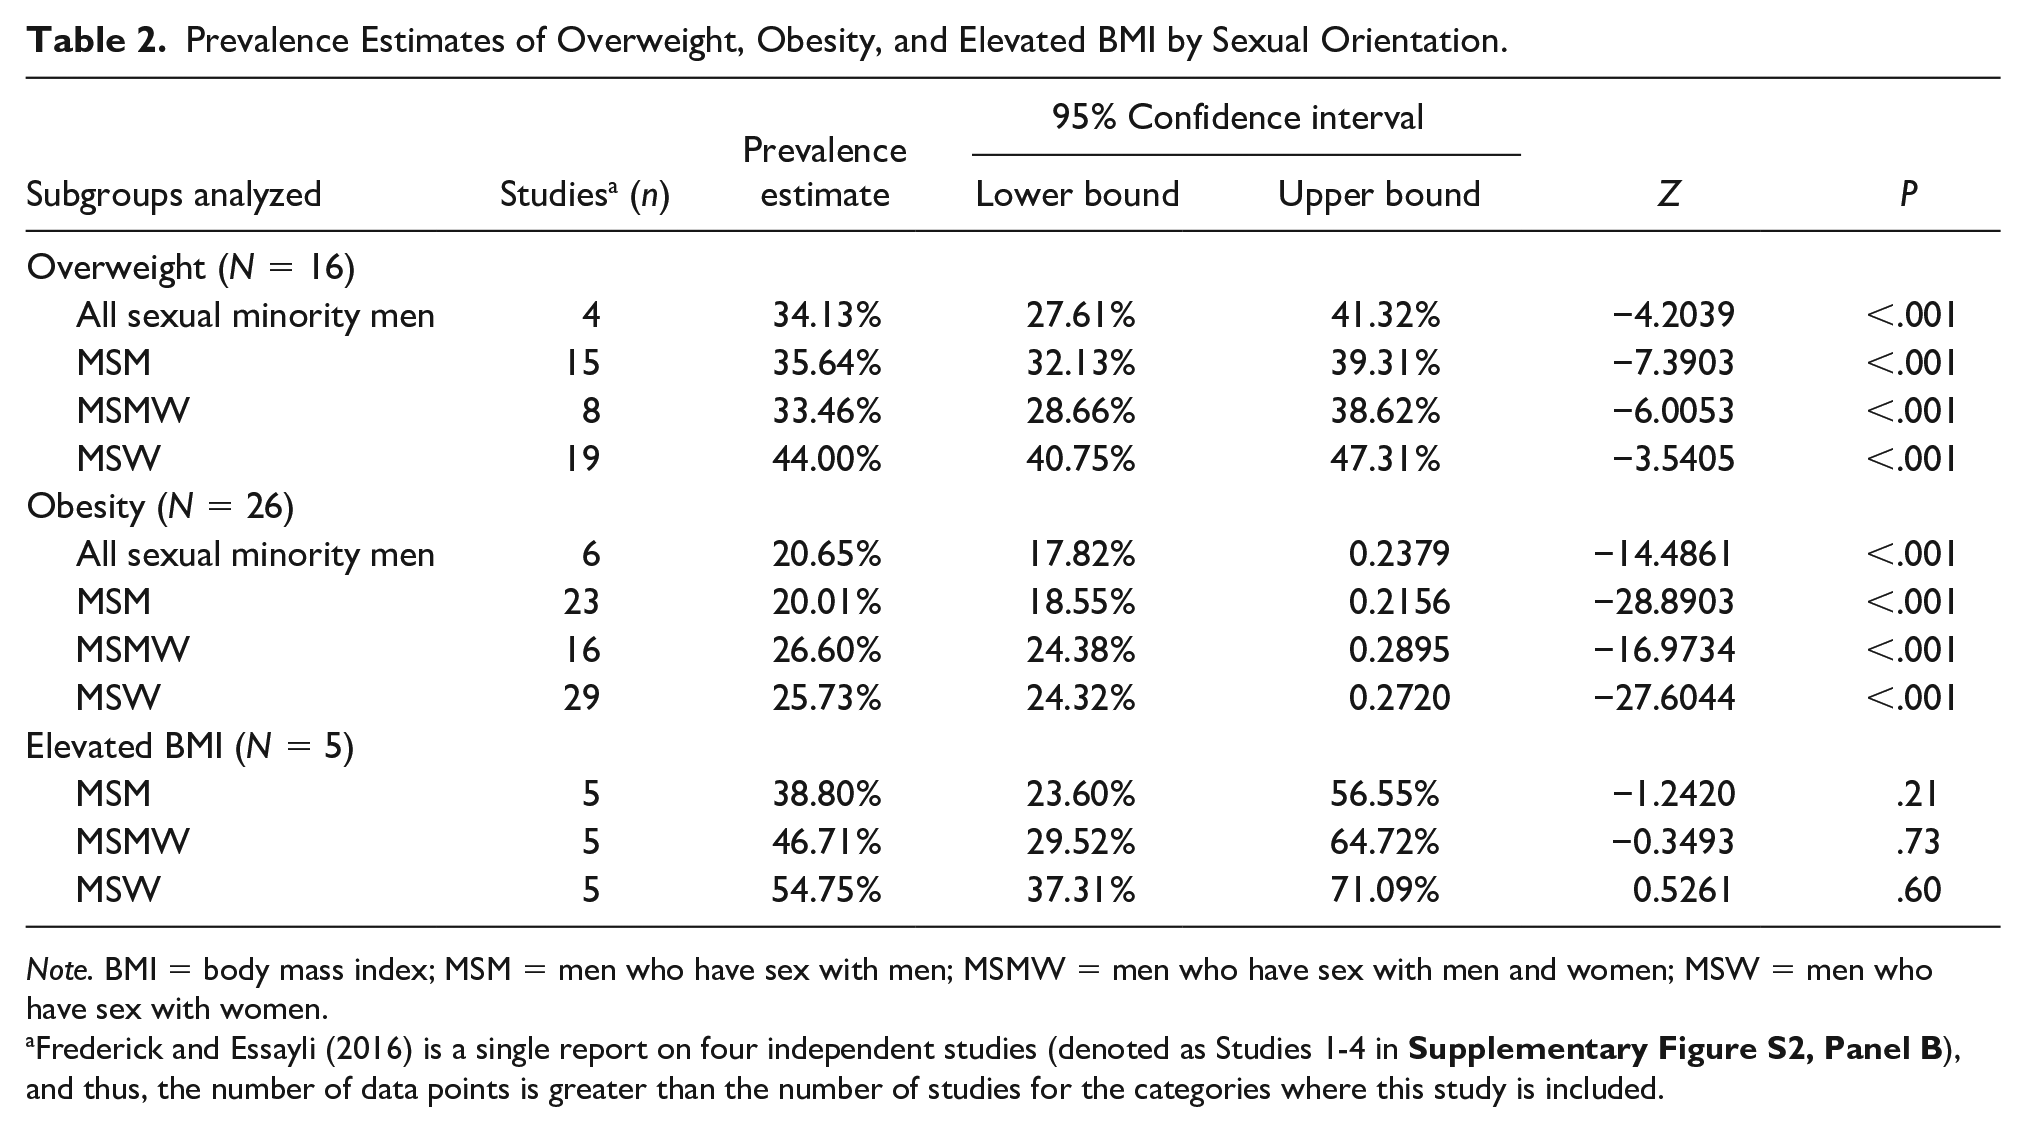
Note. BMI = body mass index; MSM = men who have sex with men; MSMW = men who have sex with men and women; MSW = men who have sex with women.
Frederick and Essayli (2016) is a single report on four independent studies (denoted as Studies 1-4 in
Crude prevalence rates were calculated from the studies reporting sexual orientation-specific data for overweight (n = 16), obesity (n = 26), and elevated BMI (n = 5). Crude prevalence estimates for all three outcome categories (i.e., overweight, obesity, and elevated BMI) for sexual minority men, MSM, and MSMW were consistently lower than the respective outcome estimates for MSW. Statistically significant lower crude prevalence rates were identified for overweight and obesity estimates but not for the crude prevalence rate of elevated BMI.
Given that age can confound prevalence estimates of the outcomes of interest, crude prevalence estimates were adjusted through an exploratory meta-regression across studies reporting mean age using random-effects estimation (Table 3). Meta-regression showed that the effect of age increases with BMI. While age did not show a tangible overall effect on the prevalence of overweight (R2 analog = 0), small and moderate effects were observed for age on the respective prevalence rates of overweight (R2 analog = .27) and elevated BMI (R2 analog = .42). It must be noted, however, that only a small proportion of studies reported age as a mean value that could be incorporated in the meta-regression.
Meta-Regression Models of Prevalence Rates of Overweight, Obesity, and Elevated BMI Regressed on Mean Age.

Note. BMI = body mass index; CI = confidence interval.
Likelihood Estimates
Table 4 presents the summary of the likelihood estimates for overweight, obesity, and elevated BMI by sexual orientation. The respective forest and funnel plots can be found in Supplementary Figures S4 and S5, respectively.
Prevalence Estimates of Overweight, Obesity, and Elevated BMI by Sexual Orientation.

Note. BMI = body mass index; df = degrees of freedom; CI = confidence interval; MSM = men who have sex with men; MSMW = men who have sex with men and women; MSW = men who have sex with women; OR = odds ratio.
The reference group is MSW. bDeputy and Boehmer (2014) reported four unadjusted ORs by race/ethnicity for MSM and MSW, which were weighted and averaged as a single estimate using the same meta-analytic assumptions in this study.
Seven studies presented data on the likelihood of being overweight, either as crude or as adjusted ORs or PRs. The meta-analysis shows that two of the sexual minority men subgroups were significantly less likely to be overweight, namely all sexual minority men (32% less likely) and MSM (37% less likely), while MSMW were not significantly different from MSW in their likelihood of being overweight (OR 0.75, 95% CI [0.52, 1.08]). Overall, all subgroups of sexual minority men were significantly less likely to be overweight (OR 0.68; 95% CI [0.58, 0.80]). Heterogeneity for studies on overweight was variable and most effects operated in the same direction.
Fourteen studies presented data on the likelihood of obesity, either as crude or adjusted ORs (Table 4). Again, sexual minority men and MSM were 33% and 21% less likely to be obese, while MSMW did not reach statistical significance for this comparison. Two were identified as significant outliers (Azagba et al., 2019; Caceres et al., 2018). After removal, the analysis reached statistical significance for the MSM (OR 0.79, 95% CI [0.71, 0.88]) subgroup but not for the MSMW subgroup (OR 0.98, 95% CI [0.92, 1.04]). Removal of outliers yielded an overall lower likelihood of obesity among all sexual minority subgroups pooled (OR 0.84, 95% CI [0.78, 0.90]), not shown in Table 4.
Seven studies presented data on the likelihood of elevated BMI. None of the subgroup comparisons reached statistical significance. Funnel plot analyses did not identify studies that would operate as outliers among these subgroups. Pooled analyses did not reach statistical significance and heterogeneity between studies was important (I2 = 96%).
Risk of bias
Supplementary Table S1 summarizes the bias assessment for the 43 studies included. Most showed a very low risk of participant selection or response biases (n = 40 [93%] and n = 35 [81%], respectively). The risk of information or misclassification biases was less clear, with most studies assessed as uncertain (n = 33 [77%]). While almost half of the studies presented a low risk of confounding by income (n = 19), education (n = 21), or age (n = 26), only three studies included information on HIV serostatus of participants (Blosnich et al., 2014, 2016; Nyitray et al., 2019).
Discussion
The purpose of this meta-analysis was to examine disparities in the prevalence and likelihood of obesity and overweight among sexual minority men. Based on the extensive review employed, it is believed this is the first study to use meta-analytic techniques to achieve this goal, although a narrative systematic review with comparable findings has been published (Caceres et al., 2017). Forty-three studies, mostly conducted in the United States between 1996 and 2020, were included, although representation from other countries must be noted.
This meta-analysis demonstrated a consistently lower mean BMI among all analytic subgroups of sexual minority men compared with MSW, which was also replicated when analyzing crude prevalence rates and the adjusted likelihood of obesity, overweight, and elevated BMI (≥25 kg/m2) overall and across most analytic subgroups.
Various explanations have been posited for the BMI disparities observed among sexual minority men. First, compared with heterosexual men, sexual minority men have more awareness of their body image and watch their weight more closely (Warren et al., 2016). Recent studies suggest sexual minority men and heterosexual women are significantly more prone to body dissatisfaction, which may be due to sustained and pervasive social pressure on body image (Conner et al., 2004; Meneguzzo et al., 2021). Besides awareness of body image, obesity-related stigma and the underlying psychological conditions—such as depression, anxiety, and stress—have been demonstrated as important predictors of obesity among gay men (Conner et al., 2004; Fulton & Srinivasan, 2021; Meneguzzo et al., 2021; Warren et al., 2016). These conditions may ultimately be a result of nonconformity stress—a key element within the Minority Stress Theory (Frost et al., 2015; Meyer, 2003). Although the studies included did not specifically assess for psychological conditions, the significantly lower prevalence rates of obesity among sexual minority men are in agreement with this first explanation.
Although weight status can be evaluated via several methods, all the studies included in this meta-analysis used BMI to determine weight status. Thus, a second plausible explanation for the disparities observed is BMI’s lower predictive value for cardiovascular disease, especially when compared with other anthropometric measures alone or in combination with imaging techniques that have validated cutoff values for men (e.g., waist circumference, waist-to-hip ratio, waist-to-height ratio, sagittal abdominal diameter, or body fat percentage; (Antonopoulos & Tousoulis, 2017). This lower predictive value derives from the fact that BMI does not measure body fat distribution, which in turn varies by sex, age, and race and ethnicity (Deurenberg et al., 2002; Flegal et al., 2013; Jackson et al., 2002). BMI does not accurately distinguish body composition of lean and fat mass, and individuals classified as overweight or obese may indeed have increased muscle mass (Jackson et al., 2002; Oreopoulos et al., 2010), which does not necessarily translate into increased risk of CVD. Studies examining obesity could triangulate multiple assessments of body weight and composition to improve analytic accuracy. In addition, biomarkers associated with obesity, such as markers of chronic low-grade inflammation (e.g., cortisol and high-sensitivity C-reactive protein), markers in the insulin/insulin-like growth factor axis, and certain adipokines (e.g., leptin, adiponectin, and resistin), can also be incorporated to better understand the context of CVD risk (Nimptsch et al., 2019).
While most studies included a reported demographic status of the participants, the intersectional effect of sexual minorities and other statuses on weight cannot be estimated. Thus, the third explanation of weight disparities observed arises from an intersectional framework with other demographic variables. In their systematic review on health outcomes within the Minority Stress Theory, VanKim et al. (2020) identified studies demonstrating plausible interaction effects of sexual minority status with race, ethnicity, age, and educational attainment. These effects were consistent across most health outcomes, including BMI differences when compared with heterosexual populations.
A fourth hypothesis for the weight disparities observed in this study is based on the population study design. All studies included in this meta-analysis used survey data, and most participants self-reported weight and height. Therefore, self-report biases (i.e., recall bias and social desirability bias) cannot be ruled out (Althubaiti, 2016). Two systematic literature reviews analyzed the accuracy of self-reported weight, height, and BMI derived from self-reported measures in studies published between 1982–2005 and 2005–2017 (Connor Gorber et al., 2007; Maukonen et al., 2018). Both reviews concluded that both men and women underestimate self-reported weight and overestimate self-reported height, with the ultimate effect of underestimating BMI calculations. Thus, data collection efforts at the population level should rely only on anthropometry rather than self-report to avoid underestimation of weight and BMI and overestimation of height.
Last, and perhaps most importantly, a lower prevalence of obesity and overweight among sexual minority men may not necessarily translate into a healthier cardiovascular status. The obesity paradox in CVD asserts that overweight or class I obese persons may have a better prognosis after CVD ensues (Antonopoulos & Tousoulis, 2017; Carbone et al., 2019), while individuals presenting with normal weight or underweight have a poorer prognosis from CVD as a result of a progressive and sustained catabolic state with loss of lean mass (Elagizi et al., 2018). A meta-analysis reported that, compared with people having normal BMIs, people with obesity presented with significantly higher all-cause mortality, while people with overweight presented lower all-cause mortality (Flegal et al., 2013). Although the obesity paradox in CVD has been studied in the general population, the current study is the first quantitative study demonstrating the plausibility of this phenomenon among sexual minority men.
We assessed the risk of selection, information or misclassification, and response biases. Misclassification bias is always a possibility given the lack of standardization in research measuring the sexual orientation of participants. Biases associated with self-reported data, such as height and weight, are also potential threats to study validity. Among the four potential confounders included in this study, the role of HIV serostatus is by far the most uncertain, followed by the risk of confounding by education level.
Limitations
This study has some limitations worth noting. First, as it has been stated, several studies relied on self-reported height and weight to estimate BMI, which may drive over- or underestimation of key variables due to social desirability and to idealized body image—especially among sexual minority populations. Second, there are two possible sources of misclassification in the studies included. On the one hand, while population representative samples accurately represent sexual minorities (Grasso et al., 2019), scholarly inquiries are limited due to a recognized lack of clarity and consistency in defining specific sexual minority groups (Legate & Rogge, 2019; Wolff et al., 2017). Studies reported either well-known sexual orientation measures of behavioral, identity, or attraction items or reported new measures, such as same-sex partnership. This heterogeneity introduces the possibility of misclassification bias. On the contrary, some studies estimated the likelihood of elevated BMI, combining overweight and obesity as a single measure. This may partially explain the nonsignificant findings in this comparison. Third, while other potential confounders—such as educational attainment and HIV serostatus—were reported among the publications assessed, only a handful of studies indeed controlled for these differences. It must also be noted that only a small number of studies reports age as a mean value that can be incorporated in meta-regression analyses to understand the effect of sampling distribution by age on the BMI estimates.
Limitations aside, this study has important strengths worth mentioning. Our analyses demonstrated that, compared with heterosexual men, sexual minority men present with a significantly lower prevalence of overweight, obesity, and elevated BMI. This finding has important implications for CVD prevention, which should encourage a healthy control of body weight and composition as one of the American Heart Association’s Life Simple Seven. This study also provides plausible evidence for the presence of the obesity paradox in CVD among sexual minority men, warranting further research efforts to understand CVD outcomes among sexual minorities across diverse BMI statuses.
Conclusion
Compared with heterosexual men, sexual minority men present a significantly lower prevalence of obesity and overweight, as measured by BMI. Several plausible explanations exist for this phenomenon, including increased awareness of body image, predictive limitations of BMI as the only measure of weight-to-height, interaction effects with other demographic minority status, and the obesity paradox of cardiovascular disease. Future studies should address the fact this apparently better cardiovascular health status in sexual minority men may actually be driven by a sustained catabolic state that presents with lower BMI than in MSW but may result in poorer CVD outcomes in the long term. The role of proposed biobehavioral markers, such as cortisol, should be explored among sexual minority populations presenting with the obesity paradox.
Supplemental Material
sj-pdf-1-jmh-10.1177_15579883221095387 – Supplemental material for Paradoxical Obesity and Overweight Disparities Among Sexual Minority Men: A Meta-Analysis
Supplemental material, sj-pdf-1-jmh-10.1177_15579883221095387 for Paradoxical Obesity and Overweight Disparities Among Sexual Minority Men: A Meta-Analysis by Humberto López Castillo, Christopher W. Blackwell and Eric W. Schrimshaw in American Journal of Men’s Health
Footnotes
Acknowledgements
One of the contributors who met the criteria for authorship did not wish to accept authorship of this article citing religious beliefs and has been excluded from authorship at their request and after agreement with the Publisher and author group. The authors would like to thank volunteer students Daniel Vitellaro, Alex Zamora, and Fabiola Ayala-Cardona for their help validating the initial keyword search. The authors also thank Ivan Bahamon, MPH; Noé Navarro, Jr., BS; and Daniel Vitellaro, BS, for their valuable help during the final manuscript screening process. The authors also would like to acknowledge Kim Hong and Camila Diez for their role conducting external data quality assurance.
Declaration of Conflicting Interests
The author(s) declared no potential conflicts of interest with respect to the research, authorship, and/or publication of this article.
Funding
The author(s) received no financial support for the research, authorship, and/or publication of this article.
Supplemental Material
Supplemental material for this article is available online.
References
Supplementary Material
Please find the following supplemental material available below.
For Open Access articles published under a Creative Commons License, all supplemental material carries the same license as the article it is associated with.
For non-Open Access articles published, all supplemental material carries a non-exclusive license, and permission requests for re-use of supplemental material or any part of supplemental material shall be sent directly to the copyright owner as specified in the copyright notice associated with the article.