
Abstract
Team coordination breakdowns (TCBs) generally reflect episodes of ineffective team functioning, resulting in suboptimal team performance. Computational identification of TCBs enables us to examine the underlying characteristics of suboptimal performance and to potentially deliver real-time feedback to teams. Especially in time-critical crisis situations, such feedback can be invaluable. Previous studies found difficulties in distinguishing between coordination patterns that indicate TCBs and patterns that indicated other aspects of teamwork (e.g., shifts in tasks or affective behavior). Subsequently, we examined features capturing underlying characteristics of team coordination, based on multiple physiological signals and coordination measures, to identify TCBs. Our multi-methodological approach allowed us to identify features that are important for TCB identification. We also observed that distributions of (coordination-based) feature data related and unrelated to TCBs were significantly different, indicating that the features captured underlying patterns in team coordination data. In addition, our results indicated that team performance, measured as goal achievement duration, is more severely compromised when TCBs lasted longer. By showing a relationship between TCBs and goal achievement duration, as well as understanding the key features of these TCBs, our study contributes to deepening our understanding of TCBs and provides a basis for future research pursuing timely team support interventions.
Introduction
Teams are social entities consisting of multiple members that organize their interdependent actions towards achieving one or more common goals (Dyer, 1984). Such organization constitutes the emergent phenomenon of team coordination (Malone & Crowston, 1994; Marks et al., 2001; Salas et al., 2005). In many contexts, effective team coordination can play an important role in achieving goals faster and more efficiently (Brannick & Prince, 1997; Burtscher et al., 2011; Fisher et al., 2012). However, for teams operating in stressful high-stakes situations, in which quickly changing demands and environments drive continuous goal changes, maintaining effective coordination can be especially challenging. Teams such as those in medical operating rooms or emergency rooms are known to experience difficulties regarding coordination when encountering unexpected crisis events (Driskell et al., 2018; Stachowski et al., 2009). In those circumstances where teams function ineffectively and fail to coordinate, team performance can become suboptimal, ultimately interfering with the accomplishment of the goal. Such inefficient episodes are referred to as team coordination breakdowns (TCBs; Bearman et al., 2010, 2015). Identifying TCBs provides us with the opportunity to examine the underlying behavioral, cognitive, and/or physiological conditions that occur during suboptimal team performance. Moreover, if we can develop computational systems that can continuously monitor teamwork and reliably identify current or impending TCBs, feedback based on team coordination might even be delivered in real-time (Gorman & Wiltshire, 2024; Wiltshire et al., 2020, 2022).
Previous studies, combining principles from Complexity Science and Cognitive Science, have shown that team coordination and TCBs can manifest themselves across multiple levels and temporal scales (Amazeen, 2018; Gorman, 2014; Likens et al., 2014; Van Eijndhoven et al., 2023). For example, team coordination can involve neural events taking place at the scale of milliseconds and speech occurring over a time span of seconds, whereas the full interaction could last minutes or longer (Hasson et al., 2012). The scientific study of team coordination dynamics focuses on examining patterns within and across such levels and temporal scales, as well as how those patterns form and change over time to assess, predict, and manage how team functioning evolves (Gorman & Wiltshire, 2024; Kelso, 2013). Corresponding approaches consider teams and their cognition as complex dynamical systems. These systems consist of components (i.e., team members) which interact over time and across multiple levels to respond to changes in their working environment (Dunbar et al., 2020; Gorman et al., 2017; Proksch et al., 2022; Ramos-Villagrasa et al., 2018). Levels of a complex dynamical system can be differentiated within a hierarchy of organization (Sales-Pardo et al., 2007). In the current study, we differentiate between levels relevant to joint action and social activities related to teamwork (Eiler et al., 2013). More specifically, we differentiate high- and low team coordination.
High-level team coordination can be considered a collective team cognitive skill that involves the organization of interdependent actions (Marks et al., 2001). These collective skills can be observed in a team’s behavior and/or communication when teams work toward achieving common goals (Kolbe et al., 2013). However, in this study we focus on assessing low-level team coordination, estimated as the covariation between signals from a particular modality (e.g., physiology, movement, or neural activity) across interacting team members as they address changes in their working environment (Demir et al., 2018; Gorman et al., 2010; Kelso, 1994). Thus, while the team member signals considered for low-level coordination operate at temporally and organizationally smaller (i.e., lower) scales, behaviors and communication relevant for high-level team coordination tend to occur over larger (i.e., higher) scales.
Following a team coordination dynamics approach, low-level team coordination can be measured across multiple signals and with a variety of methods (e.g., entropy and synchronization; Hudson et al., 2022). Different combinations of such signals and methods may capture unique high-level team cognitive processes and states (Halgas et al., 2023; Van Eijndhoven et al., 2023; Wiltshire et al., 2020). For example, low-level team coordination of upper-body movements (Chang et al., 2017) and heart rate variability (Henning et al., 2009) were found to reflect self-rated performance, while low-level coordination in inter beat intervals (Gordon et al., 2020) and skin conductance (Behrens et al., 2020) reflected externally rated performance. Low-level coordination based on heart rates was also related to emotion recognition (Murata et al., 2021) and affective behavior (Gordon et al., 2021). Furthermore, low-level coordination between team members’ electrodermal activity was observed to be related to team monitoring processes (Dindar et al., 2019; Haataja et al., 2018). A comprehensive overview of the relationships between different signals, low-level team coordination, and high-level team states and processes is provided in Hałgas et al. (2023).
To achieve effective team functioning and performance, teams have to respond adaptively to changes in their working environment (Gorman et al., 2020). Team adaptation can be reflected in the team’s low-level coordination, which exhibits various states (Wiltshire et al., 2022). For example, when heart rates of two people move up and down similarly, their state can be described with synchrony (i.e., temporal similarity; Palumbo et al., 2017) or low entropy (i.e., order or predictability; Kazi et al., 2021). When heart rates of two people move up and down dissimilarly, this can be described with asynchrony (i.e., temporal dissimilarity; Palumbo et al., 2017) or high entropy (i.e., disorder or randomness; Kazi et al., 2021). Prior research on complex dynamical systems suggests that significant variations in the underlying signals reflecting system coordination can be described as transitions from one coordination state to another (e.g., from synchrony to asynchrony; Kelso, 2013). Such transitions are considered disruptions to the system’s organization. In other words, low-level transitions reflect an episode of temporary disorganization in coordination.
In relation to teams, previous research has also shown that transitions between low-level coordination states can indicate disruptions to effective high-level team functioning in both time-critical and non-time-critical contexts (Amazeen, 2018; Likens et al., 2014; Van Eijndhoven et al., 2023; Zahmat Doost et al., 2024). Given that TCBs are episodes of high-level ineffective team functioning in which teams fail to coordinate, transitions in low-level coordination states have potential to be used for breakdown identification. Dias et al. (2019) provided an illustrative example in their study where they derived low-level team coordination from the heart rate variability time series of a three-member team performing surgery. Their analysis indicated the presence of transitions in synchrony and entropy based on team member’s coordination preceding a near-miss medication event. A further video-based examination suggested that these transitions reflected an episode of ineffective team functioning, where team members were focused on secondary individual tasks instead of primary collective tasks.
While transitions in low-level team coordination may indicate TCBs, they may also indicate the opposite and reflect a team’s effective process of adaptation to changes in their environment or tasks, or other aspects of teamwork, such as changes in affective states (e.g., from negative to positive emotional state; Gordon et al., 2021) or changes between phases within a collaborative task (e.g., from training task to debriefing; Gorman et al., 2016; Proksch et al., 2022). This can be illustrated utilizing the example by Dias et al. (2019). Upon identifying a transition in low-level coordination related to a near-miss medication event, Dias et al. (2019) observed that prior to this transition the team was in a less synchronized state. Following the transition, the teams exhibited a more synchronized state. During this synchronized period, the team functioned more effectively by explicitly coordinating their behavior to correct the near-miss event.
Van Eijndhoven et al. (2023) studied the computational identification of TCBs through low-level time-varying estimates of team coordination derived from team members’ photoplethysmogram (PPG) and electrodermal (EDA) signals. A PPG signal indicates variations in blood volume associated with heartbeats (Castaneda et al., 2018), while an EDA signal reflects the skin’s electrical properties, which are linked to the generation of sweat (Benedek & Kaernbach, 2010). Comparing the manually and computationally identified TCBs, results suggested that up to 96% of manually identified TCBs could also be identified through the computational approach. Despite these encouraging results, precision scores were found to be low (below 30%), indicating there were more computationally identified transition points than those identified manually as coordination breakdowns. To improve precision scores and subsequently be able to more robustly identify TCBs increases the feasibility of providing real-time support to teams based on their low-level coordination. A deeper investigation of the transitions in low-level team coordination that are related and unrelated to TCBs is therefore needed.
The optimization of a classification, such as a classification between transitions related and unrelated to TCB, is one commonly studied in the field of Machine Learning (Soofi & Awan, 2017). Taking inspiration from this field, one approach to further differentiate between TCB transitions and others involves the extraction of features that can capture the characteristics underlying given data. For example, an autocorrelation feature can reflect the correlation between two observations within a variable and a change-related feature can indicate the average change within a variable (Christ et al., 2018). These features can next be used as input for classification models (Christ et al., 2018; Deng et al., 2013). For instance, it could be the case that the average change, as one of many features that can be extracted, of data relating to TCBs differs from the average change of data relating to other types of transitions (e.g., from negative to positive affect).
The current study builds on previous work by van Eijndhoven et al. (2023) to examine the underlying structure of transitions in low-level physiology-based team coordination that do and do not relate to TCBs. More specifically, the aim of the current paper is to determine what features are relevant for computationally identifying TCBs more precisely. To this end, we take on an interdisciplinary approach incorporating Complexity Science, Cognitive Science, and Machine Learning to (1) identify meaningful features, (2) examine the extent to which TCBs can be identified computationally utilizing those features, and (3) interpret the features to gain insights in the underlying patterns of low-level team coordination that closely precede or occur during TCBs.
In addition, the current study expands our insights on the effects of TCBs on team performance. We address this by looking beyond team performance during these specific time-localized instances of ineffective team functioning, to the effect of TCBs on the team goal accomplishment. More specifically, we examine the relationship between the total duration of TCBs and the amount of time it took teams to achieve the main goal. The findings of our study can help better understand how far-reaching the impact of TCBs is with regards to team performance and how patterns in physiological data of team coordination underly TCBs. Combining theory and methods from Complexity Science, Team Cognitive Science, and Machine Learning, our study contributes to deepening our understanding of TCBs. Ultimately, our findings can be used to work towards facilitating feedback in support of effective team functioning and team performance.
Method
The current study is a secondary analysis of an existing data set (Van Eijndhoven et al., 2023). An extensive description of this data, including details less relevant to this study, can be found on the Open Science Framework (OSF; https://osf.io/t9eym). Preregistration and supporting materials for the current study are also available on OSF (https://osf.io/7vkzw/). Minor deviations from the preregistration are described in the Supplemental Note.
Participants
Altogether 47 four-person teams, 188 participants in total (90 females, 97 males, and 1 other; M age = 21.25; SD age = 2.93; age range = 17–33), were asked to play a collaborative game task that was aimed at inducing stressful (time-critical) situations. The majority of students were of Dutch origin (N = 120), and 37 originated from other European countries. Twenty six of our participants indicated they originated from Asian countries, two from African countries, two from South American countries, and one from a North American country. Participants were recruited through the School of Humanities and Digital Sciences’ participant pool of Tilburg University. Subsequently, many participants reported familiarity with their team members. Each of the 188 participants rated their familiarity with each of the other three members in their team, resulting in 564 ratings. In total 10 participants reported a best friend in their team, 31 reported a friend in their team, and 55 reported an acquaintance. All 468 other team members were rated to be strangers. Two participants reported to be familiar with the experimental game task.
To examine the relationship between TCBs and team performance, the data of 33 out of 47 teams met the data quality criteria for inclusion (71 females, 60 males, and 1 other; M age = 21.51; SD age = 3.09; age range = 17–33). The majority of four-person teams consisted of mixed gender (N = 27), but some teams consisted of only females (N = 4) or males (N = 2). The data of a team was excluded if the audiovisual recordings did not allow for TCB annotation, such as when the webcam recording of at least one participant or a teams’ game recording was missing or incomplete. For the purpose of studying features of team coordination, 21 out of 47 teams passed the data quality criteria for inclusion (47 females and 37 males; M age = 21.27; SD age = 2.64; age range = 18–30). Corresponding with the full data set, the gender composition of included teams was predominantly mixed (N = 19). Some teams consisted of only females (N = 2), but there were no teams consisting of only males (N = 0). Twenty-six teams were excluded because one or more team members included missing physiological signals (EDA and PPG) or insufficient signal quality including the presence of artifacts or incomplete audiovisual recordings. These excluded twenty-six teams, also involved the two teams that included a participant with reported familiarity of the experimental game task. Consequently, our analyses did not involve any teams for which team members were previously acquainted with their task.
Experimental Procedure
Prior to the experiment, participants were instructed to refrain from consuming recreational drugs, caffeine-containing drinks, or cigarettes within 5 hours before their participation. Upon arrival at the lab, participants signed informed consent forms and completed initial surveys. In the following 10 minutes, they were provided with information about the experimental game task. Each participant was then supplied with a Shimmer GSR + device, which is a validated wearable for collecting EDA and PPG data (Burns et al., 2010; Ronca et al., 2023). Electrodes were placed on the ring and index finger of their nondominant hand to collect EDA data, and a sensor measuring PPG data was placed on their earlobe and both signals were recorded at 128 Hz. Additionally, participants’ faces and audio were recorded with a webcam and headset microphone, and in-game performance was recorded with OBS Studio software (Bailey, 2012). Participants were seated at computers organized in a 2 × 2 set-up, with two sets of two participants sitting across from each other, ensuring members could see each other and communicate. Approximately 30 minutes after starting the experiment, participants were ready to start playing a game in which they operated a spaceship. The goal of each level of the game was to save five trapped non-playable characters from an enemy as quickly as possible. All teams played four progressively more challenging levels of the experimental game task. Each team played the same levels, provided to them in a fixed order. Participants played the first two game levels, for which the average total duration was 20 minutes and 34 seconds on average (SD = 6 min 20 s), and then completed a round of surveys taking up approximately 10 minutes. Immediately after, they continued with the last two game levels, which together lasted 13 minutes and 46 seconds on average (SD = 3 min 47 s), followed again by a round of the same surveys. After this last round of surveys, participants were debriefed, concluding the experiment after approximately 1.5 hours (see section “Experimental Procedure” of https://psyarxiv.com/p4r6h for more details).
Participants received course credit for taking part in the experiment. In addition, a gift card was provided to the three best performing teams per condition. The experiment was approved by Tilburg University’s Research Ethics and Data Management Committee (REDC#2020/130) and conducted following all relevant ethical regulations and rules.
Task Characteristics
To induce stressful situations, teams played the game Lovers in a Dangerous Spacetime (Hammill et al., 2015). The game characters of all four team members were placed on a spaceship, with which they had to explore the game environment. The teams needed to locate non-playable characters in this environment that were captured by enemies and save them from their prison. Each team member was assigned a role in which they were responsible for specific stations on the spaceship: two weapon stations and the emergency weapon were assigned to Member 1, Member 2 was responsible for the ship’s steering, two other weapon stations and the map station were handled by Member 3, and Member 4 was in charge of operating the ship’s shield. The spaceship and stations can be seen in Supplemental Figure S1. Team members had to cooperate to achieve two task goals: (1) to find and rescue five non-playable characters as quickly as possible and (2) to finish the level before the health of the spaceship depleted due to enemies’ attacks. Ship health, which by default started at 100%, could decrease if the spaceship collided with other objects in the game environment or if an enemy hit the spaceship with their weapons.
Manually Identifying TCBs
In many studies, within and beyond the context of teams, it is common practice for human raters to apply behavioral coding systems to observational data using multiple raters, from which reliability of the ratings is assessed (DeChurch & Mesmer-Magnus, 2010; Georganta & Brodbeck, 2020; Kolbe et al., 2013). In van Eijndhoven et al.’s (2023) work, three raters identified TCBs in the audiovisual recordings of participants combined with the game recordings (Van Eijndhoven et al., 2023). Interrater reliability was found to be good (Cohen’s kappa = .67). Given that the presence of TCBs was assessed at each second, a majority of instances were annotated as a non-TCB. To take this into account, as suggested by Byrt et al. (1993), a Prevalence-Adjusted Bias-Adjusted Kappa (PABAK) was calculated, which indicated that the interrater reliability was very good (PABAK = .94, Prevalence Index = .92, and Bias Index <.001). Annotation discrepancies were discussed among raters until a unanimous decision was reached. TCBs were indicated at time-localized instances of inefficient team functioning, which subsequently generated a negative impact on team performance (see van Eijndhoven et al., 2023; section “Manually Identifying CBs” for more details). In the context of the experimental task, these instances were annotated as TCBs when insufficient actions or communication were taken to address environmental changes, leading to negative consequences regarding performance.
The first component, insufficiently addressing environmental changes, could, for example, be observed when a team’s spaceship had to fly through a ship damaging laser beam, but the team did not respond adequately by setting up a plan or using their ship’s protective shield. The second component, negative performance consequences, could be observed in relation to the team objectives: when a team delayed saving non-playable characters as quickly as possible (e.g., by prioritizing upgrading the ship over locating these characters), and decreases in the health of their spaceship (e.g., by moving through a laser beam without using their shield). Hence, both components needed to be observed to manually identify a TCB. In this way, a moment during which a team failed to protect their ship from a laser beam leading to a health decrease would be annotated as a TCB. On the other hand, a moment during which a team was coordinating their defense in an overwhelming enemy attack, during which one enemy managed to hit the spaceship, would not be annotated as a TCB. On average, eighteen TCBs were identified manually per team (SD = 8.54, N Total = 606). TCBs were observed throughout all four game levels and lasted 7.55 s on average (SD = 7.89).
Computationally Identifying TCBs
Computational identification of TCBs was based on team members’ EDA and PPG signals. Van Eijndhoven et al. (2023) conducted EDA preprocessing following Westerink et al. (2020). Utilizing the pyphysio package (Bizzego et al., 2019), we applied a second-order 10 Hz Butterworth filter to the EDA signals (128 Hz) to remove wideband noise. The EDA signals were then resampled at 10 Hz. A visual artifact identification was performed based on sharp absolute increases and decreases of the EDA signal (within 1 s windows). Artifacts were replaced with linearly interpolated values. Such identification and replacement are a common starting point in EDA preprocessing (Caruelle et al., 2019). Remaining noise was removed, by locating values over three standard deviations away from the mean, which were replaced with linearly interpolated values. Lastly, the EDA signals were standardized, after which phasic and tonic components were derived utilizing the package PyEDA (Aqajari et al., 2021).
To preprocess PPG data (128 Hz), the researchers followed van Gent et al. (2019a). Utilizing their HeartPy package, a third-order 3.38 Hz Butterworth filter was applied, which removed high-frequency noise. Remaining noise was identified as PPG values over six standard deviations away from the mean, to be excluded from additional heart rate estimation. To extract beats per minute (bpm) from the PPG data with the HeartPy package, a sliding window technique was applied. Window size was 30 s (Jennings et al., 1981), and bpm was recalculated at every 1 s (Van Gent et al., 2019b), resulting in bpm time series with a sampling rate of 1 Hz.
To the preprocessed signals, the researchers applied two different continuous measures of coordination: windowed synchronization coefficient (SC; Guastello & Peressini, 2017, 2023) and windowed multidimensional recurrence quantification analysis (MdRQA; Wallot et al., 2016). Van Eijndhoven et al. (2023) chose both of these measures, as each one generates metrics that reflect coordination differently. Windowed SC is a correlation-based measure, with which a team-wide value of synchrony can be calculated, based on correlations between all possible dyads within a team (Guastello & Peressini, 2017). SC indicates various states of synchronization (the degree of similarity in signals over time, see, e.g., Gordon et al., 2020). MdRQA is a recurrence-based measure, with which team member signals can be embedded in a multidimensional phase space (Wallot & Leonardi, 2018). Subsequently, a recurrence plot can be generated, that displays when team member signals in the phase space exhibit similar repeating patterns over time. From this plot, a measure of determinism can be computed, which indicates various states of pattern regularity (the degree of pattern repetition within the signals over time, see, e.g., Dindar et al., 2019). Analyzing different types of transitions in coordination states allowed the researchers to assess which transition types can be associated with TCBs. Windowed SC was implemented in Python based on the available literature (e.g., Guastello & Peressini, 2017), while windowed MdRQA was based on Wallot and Leonardi’s (2018) RQA tutorial in R.
Transitions in the resulting low-level coordination were located through a combination of change point and nonlinear prediction algorithms. The change point algorithm identified transitions, through the minimization of a given cost function over possible amounts and locations of change points within a time series (Killick et al., 2012; Taylor, 2000; Wang & Fan, 2021). This algorithm was applied using the pelt() function from the Python library ruptures (Truong et al., 2018). The nonlinear prediction algorithm computed a predicted trajectory of the team coordination and compared this to the actual trajectory (Sugihara & May, 1990). To apply this algorithm, pyEDM’s PredictNonlinear() function was utilized (Park & Smith, 2022). Transitions were indicated when deviations between the trajectories crossed a certain significance threshold (see van Eijndhoven et al., 2023; for an extensive description of the data set and the computational identification of TCBs, preprocessing code was made available on OSF: https://osf.io/wkqa2, as well as transition detection code: https://osf.io/jp7rv). A detailed description of parameter settings for signal preprocessing, measures of coordination, and transition detection methods can be found in van Eijndhoven et al. (2023).
For the current study, we examined low-level team coordination based on both EDA and PPG data. These signals capture information from both the sympathetic and parasympathetic nervous system comprising the autonomic nervous system (Benedek & Kaernbach, 2010; Nitzan et al., 1998). The two systems are each other’s antagonists; the sympathetic nervous system is responsible for the “fight-flight-or-freeze” bodily response, where the parasympathetic system stimulates the “rest-and-digest” process (Reece et al., 2013). As each component has been associated with different behavioral and physiological responses, examining them can result in obtaining different information on team coordination. Moreover, a systematic review on the potential of wearable-based low-level team coordination to assess team functioning and performance showed that the most prominent correspondence was found for cardiovascular (captured with PPG) and skin conductance (captured with EDA) signals (Halgas et al., 2023). These findings suggest that examining EDA and PPG is a good starting point in exploring the correspondence between low-level coordination transitions and high-level coordination breakdowns. Synchrony between team member signals was calculated with SC, while the determinism of recurrent patterns in team members’ signals (%DET) was based on computation with MdRQA. We also utilized the manually identified TCBs to locate windows of transitions in team coordination that reflect and do not reflect TCBs.
To compare manually and computationally identified TCBs, van Eijndhoven et al. (2023) calculated true positive, false positive, and false negative TCBs. True positives (TPs) were identified in case a computationally identified TCB occurred in a 10 s window before, at the same timepoint as, or in a 10 s window after a manually identified TCB. The researchers chose these time windows, based on previous literature on the timing of low-level coordination transitions (Dias et al., 2019; Gorman et al., 2020), and event-related change in EDA (Wass et al., 2015) and PPG (Jennings et al., 1981) signals. False positives (FPs) could then be computed as the number of computationally identified TCBs minus the true positives. False negatives (FNs) were computed as the number manually identified TCBs minus the true positives. Consequently, recall, precision, and F1-scores were calculated. Recall scores reflected the extent to which manually identified TCBs could be located by computationally identifying transitions in low-level team coordination (
Data Analysis
We examined the effect of TCBs on team goal accomplishment. More specifically, we assessed the relationship between the total duration of TCBs (TCB duration in seconds) and the amount of time it took a team to accomplish their main goal (goal accomplishment duration in seconds) of rescuing five trapped non-playable characters as quickly as possible. TCB duration was chosen, as to some extent it represents the severity of the breakdown more than other TCB descriptors such as frequency, for example, in the case of a team going through only one 20 s long breakdown. We fitted a linear mixed-effects model with goal accomplishment duration as the dependent variable and TCB duration as a fixed effect. We accounted for the multiple observations per team as a random intercept. Even though four levels were played, data of one level was excluded from the current analysis. This level’s goals and game layout were different, resulting in a measure of performance that was not necessarily related to goal accomplishment duration. The difference in performance measure would cause issues for the comparability of performance across all levels. Consequently, data of the three comparable game levels were included for the teams that completed those. If a team did not achieve the goal (i.e., lost all health before saving five nonplayable characters), the goal accomplishment duration and TCB duration values of that level were excluded from the analysis. Of the 33 teams, three goal accomplishment duration values and three TCB duration values per team were included for 28 teams, and two goal accomplishment duration values and two TCB duration values per team for five teams. The outcome variable met the model assumptions. Subsequently, the model was fit using the lmer() function of the R library Lme4 (Bates, 2010), based on 94 observations of 33 teams.
Next, we studied what features were relevant for distinguishing between windows of team coordination that do and those that do not relate to TCBs. We further utilized those features to examine the extent to which TCBs can be identified computationally. In addition, we assessed the features to gain insights into the underlying patterns of team coordination based on physiological signals that closely precede or occur during TCBs. To this end, we set up a data analysis plan as shown in Figure 1. An overview of the steps involved in data analysis.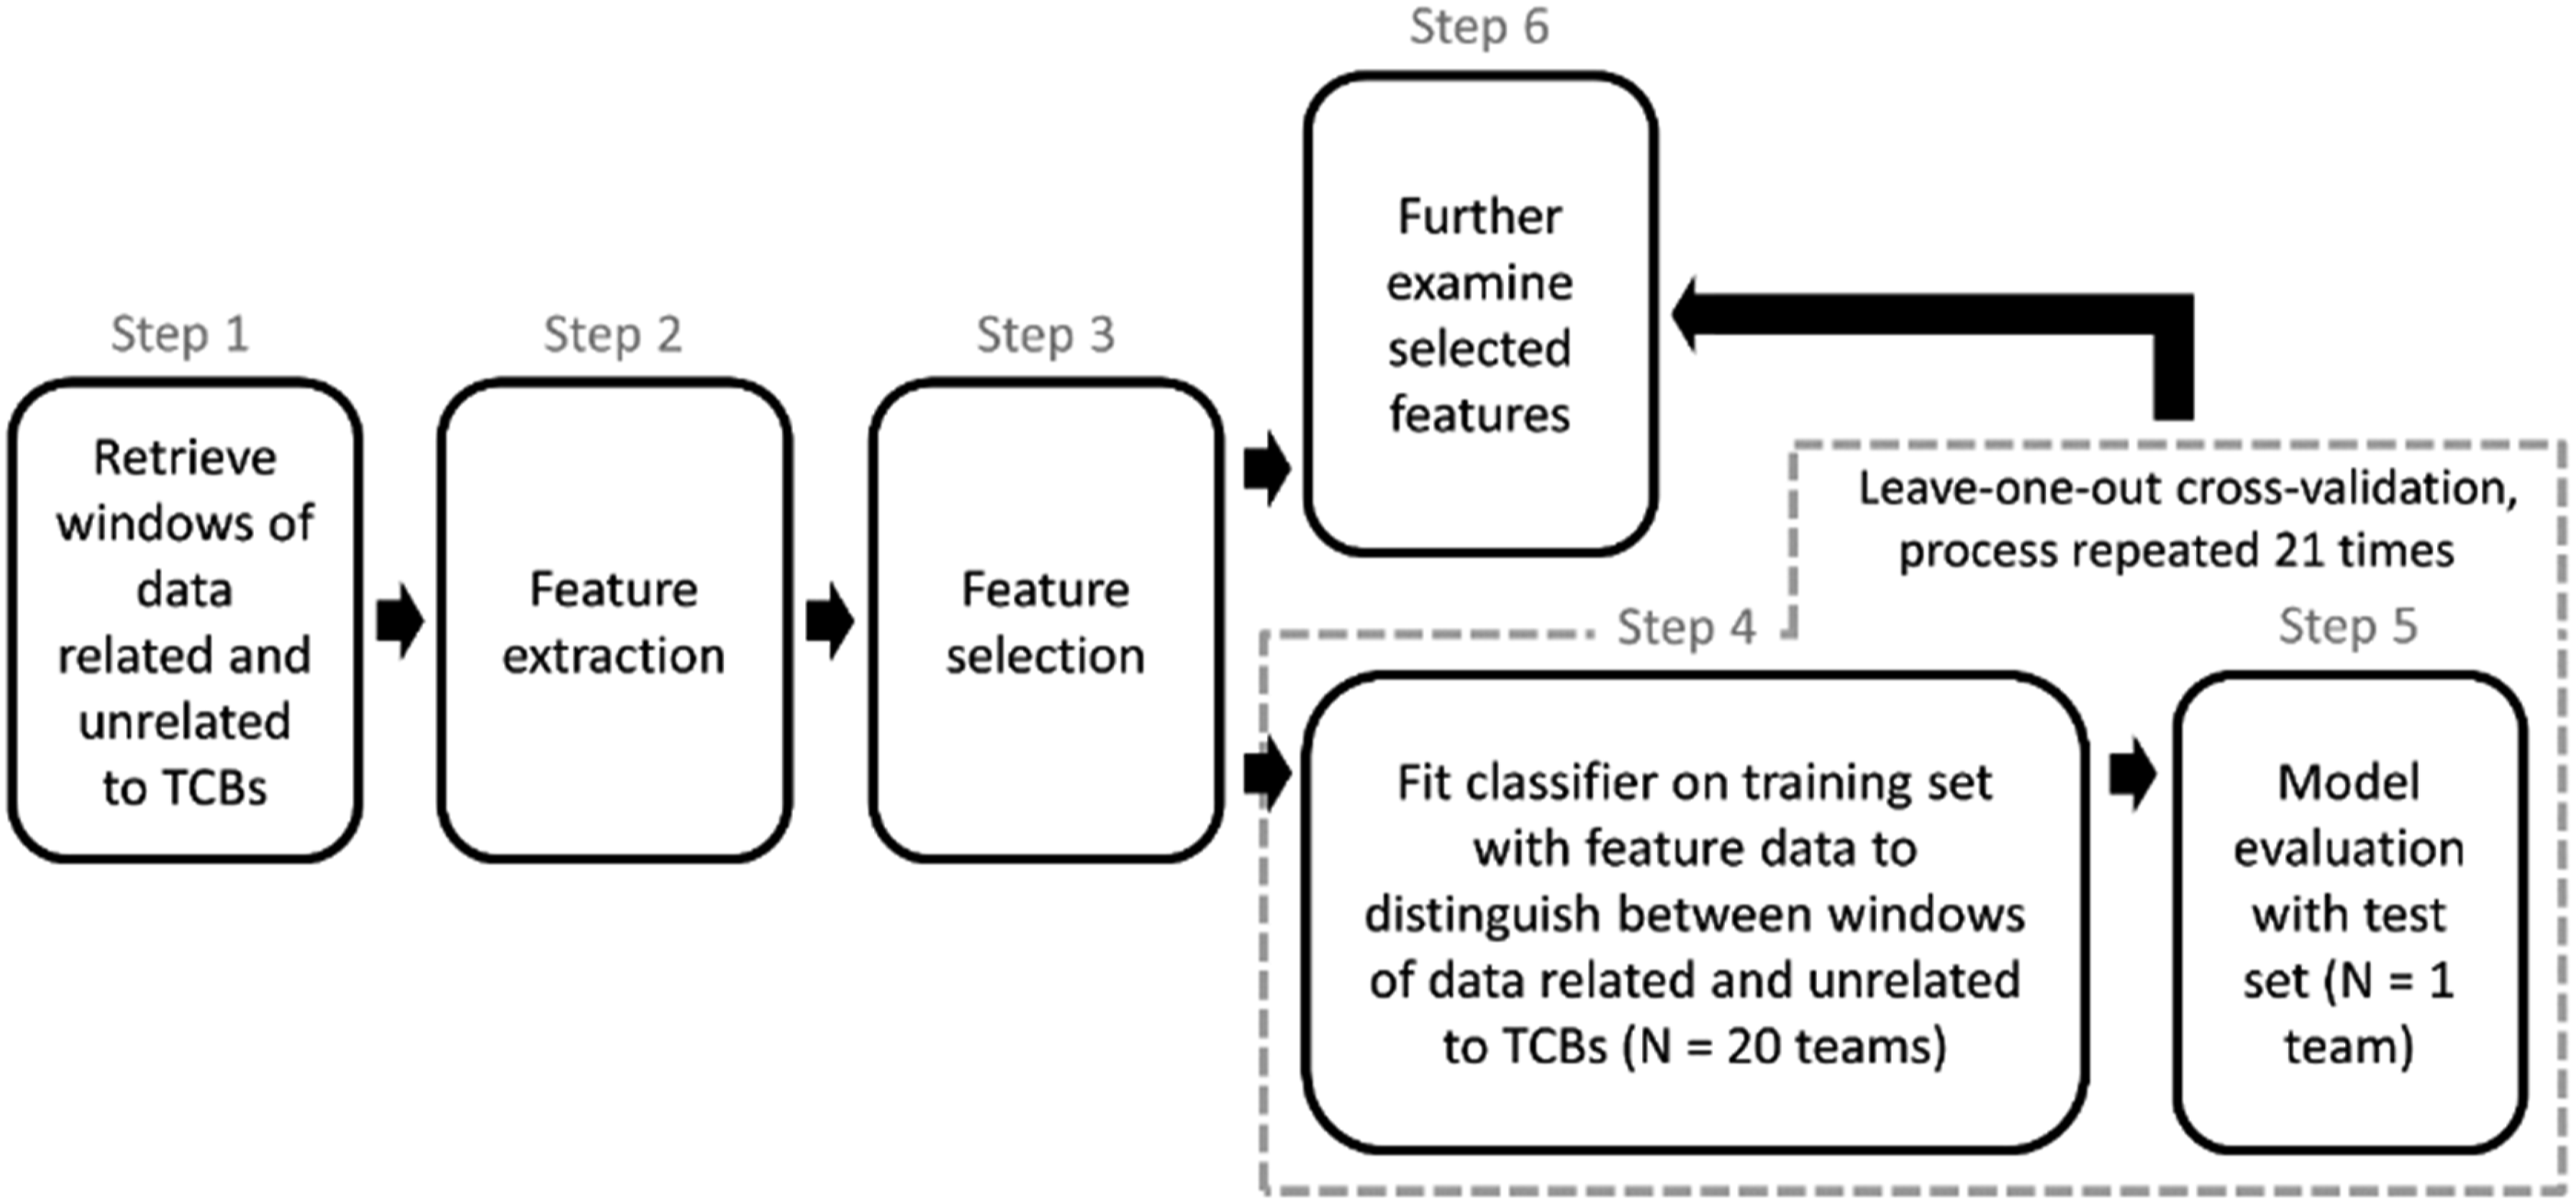
Step 1: Window Retrieval
As Figure 1 indicates, the first step was to retrieve windows of low-level team coordination data that relate, and do not relate, to manually identified TCBs. The retrieval of windows that are not related to manually identified TCBs involves false positives (FPs). FPs are transition points in low-level team coordination that were computationally, but not manually, identified. Figure 2(a) illustrates an FP. An example illustrating the retrieved windows for step 1. Plot a provides an example of a false positive (FP). Plot b shows 10, 20, and 30 s window examples for FP windows. Plot c displays 10, 20, and 30 s window examples for Team Coordination Breakdown (TCB) windows. (a) Example of false positive identification, (b) example of FP windows, and (c) example of TCB windows.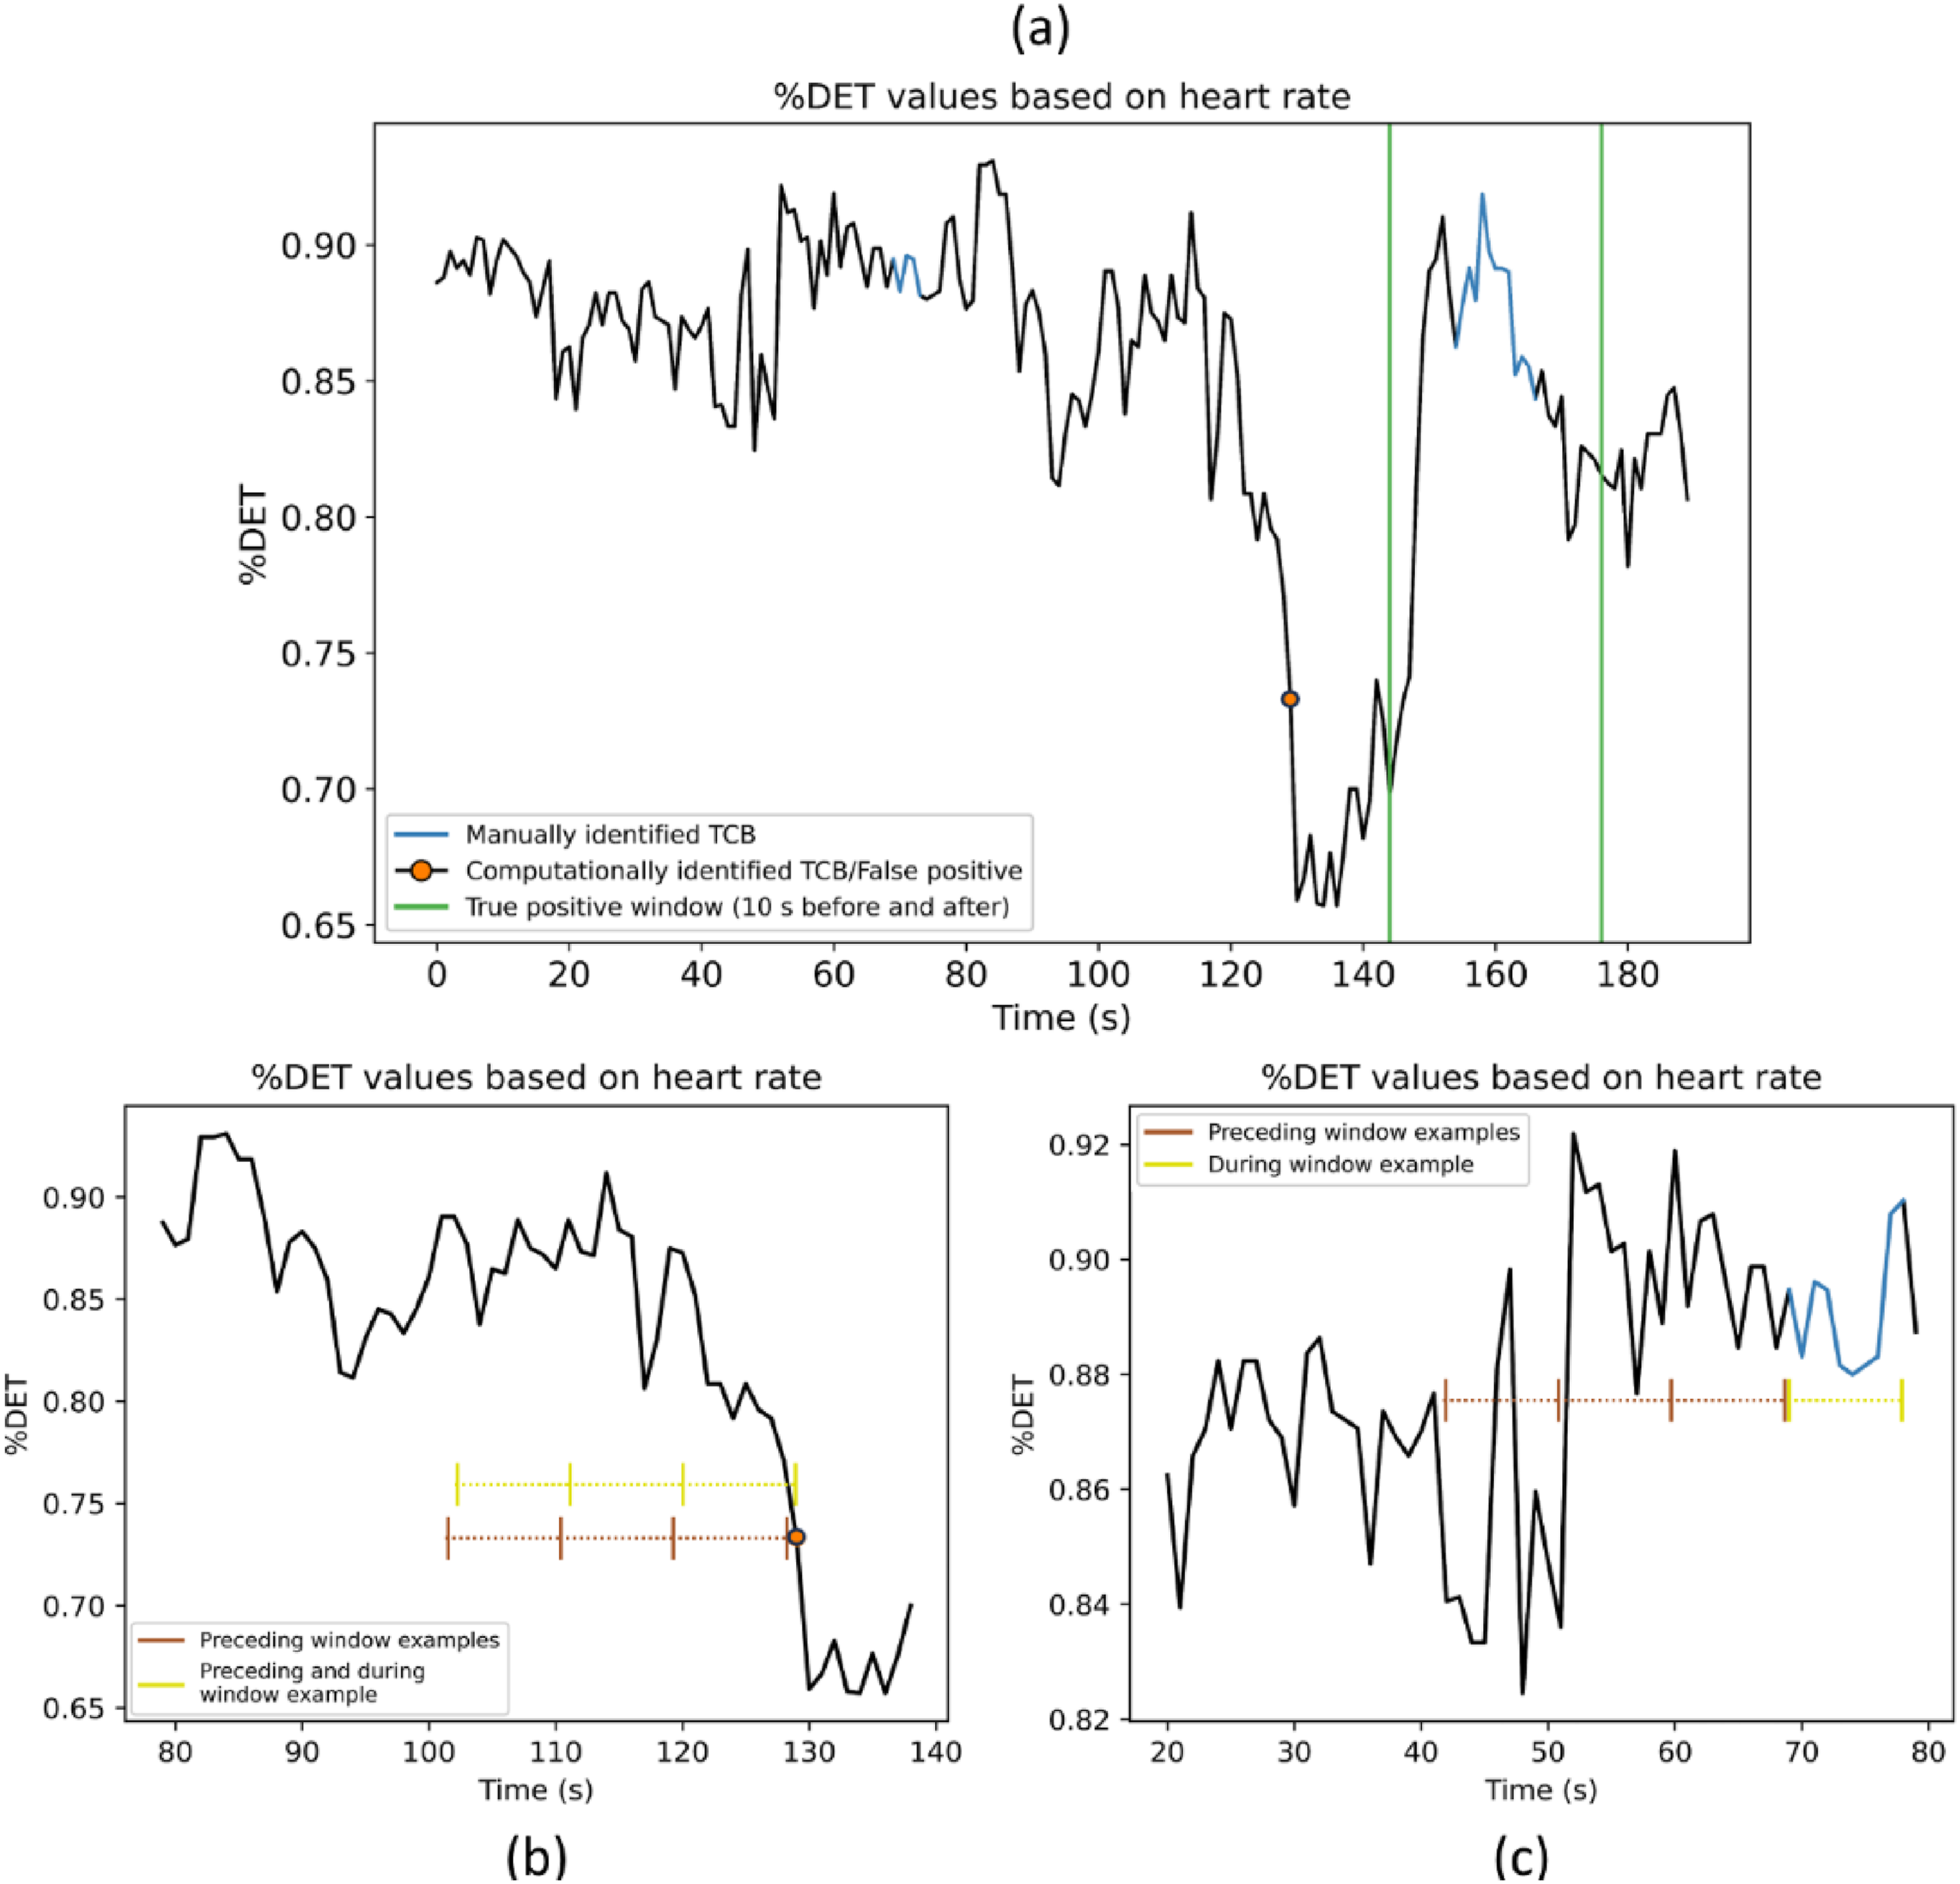
Figure 2(a) shows a segment of team coordination based on heart rate data of an example team, from which the determinism of recurrent patterns (%DET) was derived with windowed MdRQA. A threshold of 10 s before the first and after the last second of a manually identified TCB is represented by the two vertical green lines. The computationally identified TCB falls outside of this threshold, indicating a transition point in the team coordination that was not manually identified (i.e., an FP).
Based on the manually identified TCBs and FPs, window retrieval could further be executed as follows. Windows of %DET and SC data, derived from PPG and EDA signals, not related to a manually identified TCB (also referred to as FP window) include coordination captured up to 10, 20, and 30 s preceding and including FPs and captured up to 10, 20, and 30 s preceding but not including FPs. Figure 2(b) shows an example of these FP windows. Windows related to a manually identified TCB (also referred to as TCB window) include team coordination captured during TCBs that lasted 10 s or longer and captured up to 10, 20, and 30 s preceding TCBs. An example can be found in Figure 2(c). For each team, every TCB lasting 10 s or longer and FP were used for TCB and FP window retrieval of each of the four computed variables of low-level team coordination. An overview of all retrieved windows and which windows were compared in TCB classification (indicated by each curved arrow) can be found in Figure 3. An overview of the retrieved windows. The curved arrows point at window combinations of which data was utilized for distinguishing Team Coordination Breakdown (TCB) windows from non-TCB windows (e.g., a classifier was built to distinguish between data from 10 s windows preceding TCBs and 10 s windows preceding false positives).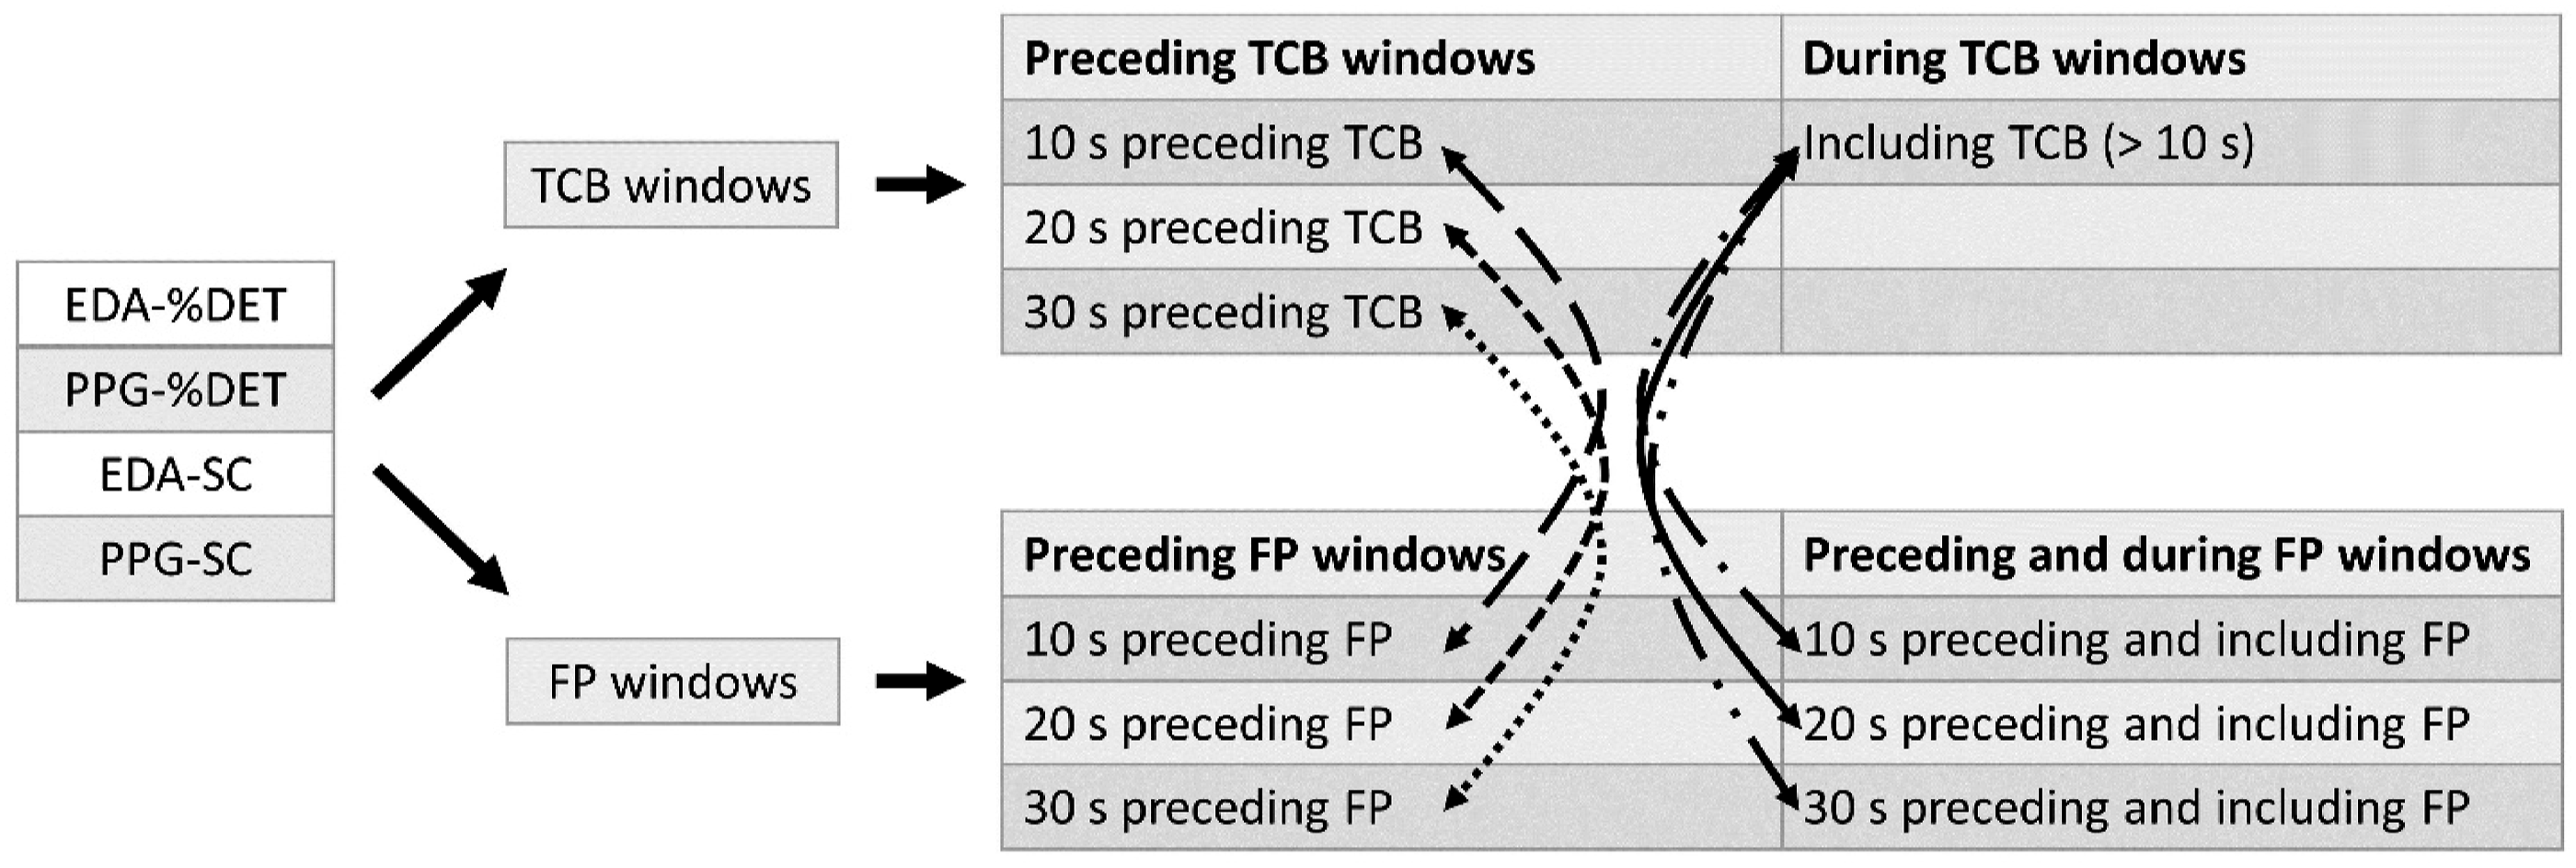
Step 2: Feature Extraction
For step 2, features were extracted from all four low-level coordination data types and six window combinations shown in Figure 3, using the extract features() function from the Python library TSFresh (Christ et al., 2018). This library was chosen, as the features() function allows for quick extraction of a large number of different time series features, suitable for a wider exploration of meaningful features. The features() function extracts 794 features characterizing key properties of a given time series, that can be grouped in eight different categories (Hudson et al., 2021): (1) descriptive statistics such as means, (2) change-related features such as mean change, (3) features related to complexity such as sample entropy, (4) matrix profile statistics, that are informative about repetitions or anomalies within time series, (5) features related to peaks or extreme values such as peak counts, (6) features related to frequency components such as estimates of the cross power spectral density, (7) autocorrelation-based features, such as autocorrelations at different time lags, and (8) features related to how well the data fits a given model such as a linear model.
Step 3: Feature Selection
Feature selection was performed to select the features that were relevant for distinguishing between TCB and FP windows (i.e., non-TCB windows). More specifically, for each of the window combinations shown in Figure 3 the most important features (constituting a feature set) were obtained. For example, the most important features based on the EDA-%DET team coordination were computed for distinguishing between data from 10 s windows preceding TCBs and 10 s windows preceding FPs. In total, 24 most important feature sets were computed (four coordination data types times six window combinations).
Feature importance was computed as an indication of the relative importance of each feature for distinction between TCB and FP windows, by applying the commonly used DecisionTreeClassifier() and feature importances() functions of the Python scikit-learn library (Pedregosa et al., 2011). The goal of applying a decision tree classifier was to create a model that identified the category of the binary target variable (0 = not related to a TCB, 1 = related to a TCB). It did so by iteratively splitting the data into two branches of data through simple decision rules that consider all features in a feature set, which are guided by the Gini impurity index (Gini, 1936).
At each potential split, the Gini impurity index is computed to represent the remaining diversity within the branches. The bigger the decrease in Gini impurity, the higher the importance of the feature (Breiman et al., 1984). All features with importance scores above the 95th percentile were included within the most important features set. Second, to address collinearity, a correlation matrix of the selected important features was computed. This matrix was used to examine whether features were highly correlated. If Pearson’s r values were equal to or bigger than .7 (Dormann et al., 2013), the involved features were considered collinear, and only the feature with the highest importance score was selected.
Steps 4 and 5: Classifier Training and Testing
In step 3, the most important features for each of the 24 coordination data type and window combinations shown in Figure 3 were obtained, resulting in 24 feature sets, one feature set per combination. For steps 4 and 5, 24 feature data sets were generated based on those feature sets. Next, a decision tree classifier was trained and tested on each feature data set, for each of which leave-one-out cross-validation (LOOCV) was performed. This means that each team in a data set was used as the test set for step 5 once, with the data of the other 20 teams forming the training set for step 4. A decision tree classifier was trained on the feature data of the training set, where the labels are known (0 = related to FP, 1 = related to TCB), utilizing the previously referenced DecisionTreeClassifier() function.
The training of the classifier (step 4) involved two stages: parameter optimization and the training of the classifier. For every train-test split of the data, the decision tree parameter “max depth” was optimized. This parameter indicates maximum decision tree depth. A depth of 0 would mean that the decision tree classifier would iteratively split data, until subsequent data subsets only contain data of the same label. The maximum tree depth should be optimized, as values too high could lead to overfitting on the training data, and values too low to underfitting, resulting in bad classifier performance on unseen data. Depths ranging from 1 to 25 were tested for optimized precision scores, which represent the ability of the classifier to only identify windows related to TCBs as TCBs and not windows related to FPs. The focus was on precision scores, as previous research found that while recall scores for identifying TCBs were high (up to .96), precision scores were far lower (up to .29; Van Eijndhoven et al., 2023). In order to achieve robust identification of TCBs, a precise distinction between TCBs and FPs is crucial. Consequently, at every train-test split, the specified range of depths was assessed to find the best value. Assessment was performed by training a decision tree on a randomly chosen 75% of the training data and testing on the remaining 25%. This procedure was repeated 50 times per max depth value, and the average precision score was used to identify the best value. Once the max depth was determined for a given train-test split, the model was trained on the training data, including the optimized parameter value.
At each cross-validation iteration, the trained classifiers were tested by applying them to the unseen feature test data of one team in step 5, so that no information from the test data was included in training that iteration’s classifier. Thus, each trained classifier received the feature data of the test set as input and classified this data as either related to an FP or TCB. The output of each classifier (i.e., the classification) was evaluated against the actual classes. To evaluate the performance at each iteration, precision, recall, and F1-scores were computed, based on unseen test data for that specific iteration’s trained model. Finally, these result scores were averaged to obtain an overall precision, recall, and F1-score. Recall scores provide information regarding the ability of classifier to detect all TCBs. The precision score reflects the ability of the classifier to only find TCBs. Lastly, F1-scores were computed to interpret the balance between precision and recall scores. For each of these result metrics, baseline values were computed following the unfair coin model (see, e.g., Krehbiel, 1993). This model provided chance-level results based on the probability of each label (0 = related to FP, 1 = related to TCB), to which the feature data informed classifiers could be compared to. A more visual explanation of steps 4 and 5 can be found in Figure 4. Visual overview of steps 4 and 5. Plot a shows an example of one team’s low-level coordination data to feature data. Plot b visualizes one train-test split based on leave-one-out cross-validation. Plots c and d illustrate how tree depth gets chosen for each train-test split of plot b Plots e and f explain the different repetitions involved in the overall classification process.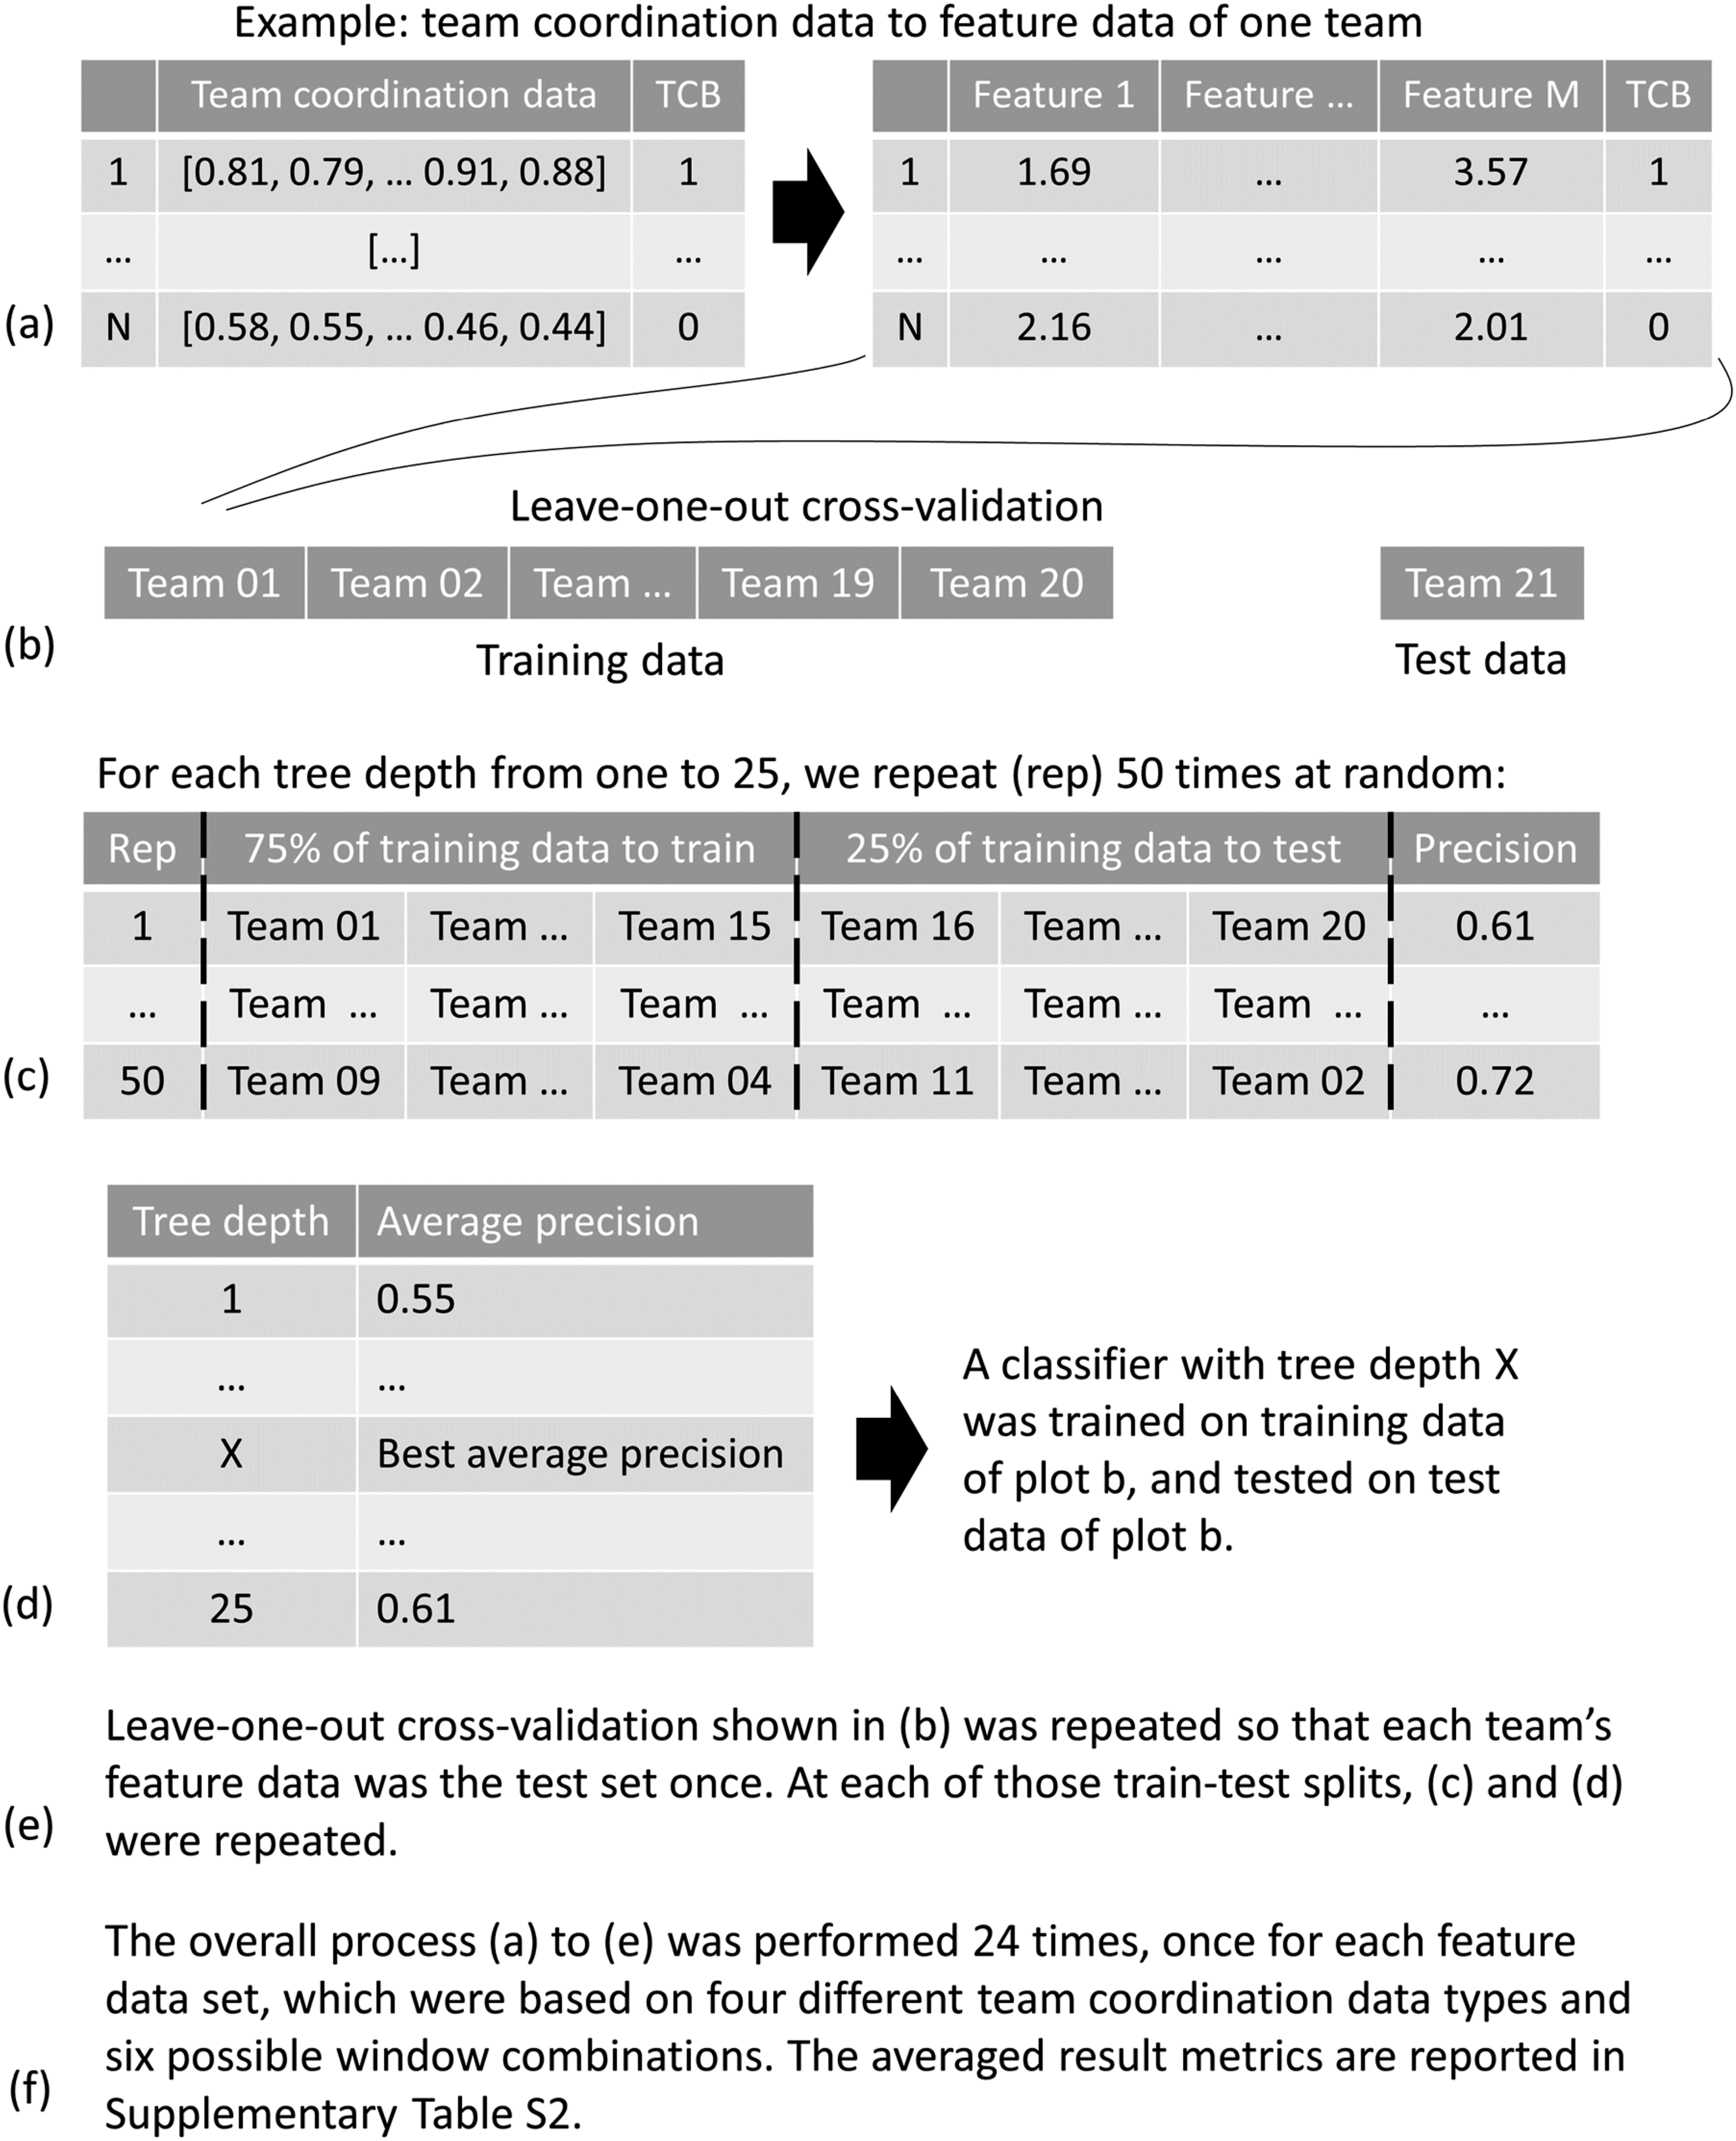
Step 6: Important Feature Examination
The selected important features for the best performing classifiers were further examined in step 6. Each of these features was further highlighted by an exploration of how they were computed, and a comparison of values between FP and TCB related data. To this end, per selected feature, the feature values were grouped according to their label (0 = related to an FP, 1 = related to a TCB). Further visualizations were generated based on each subset. An example of this process can be seen in Figure 5. An example of the subsetting of feature data based on label, and the details of the generated visualizations.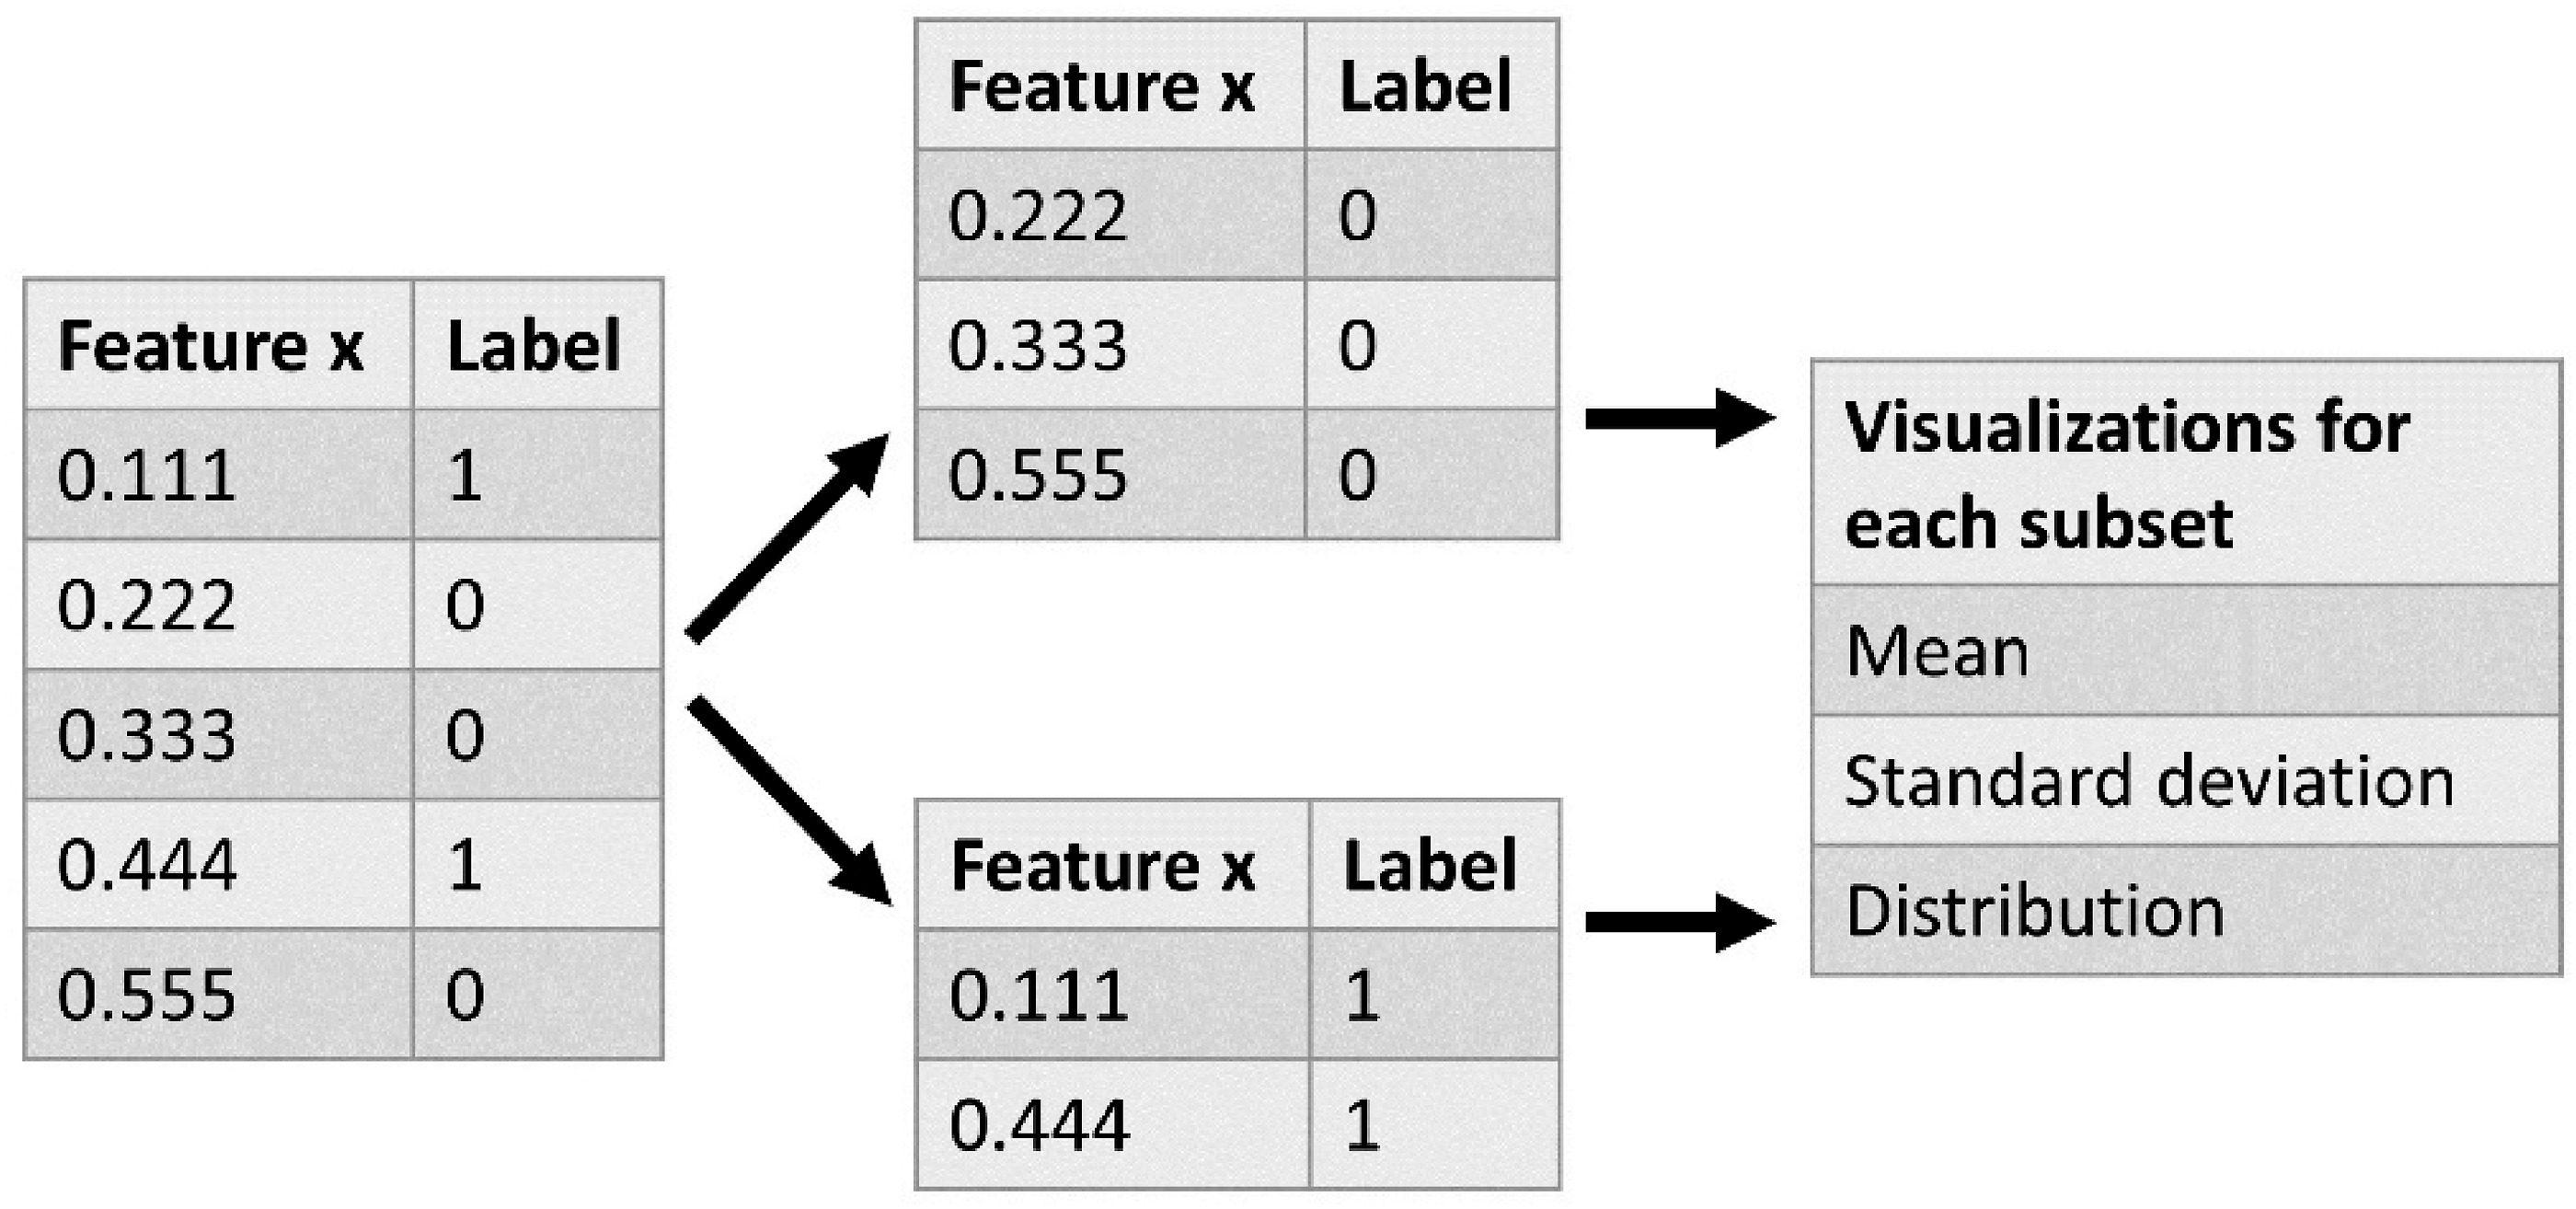
Such visualizations will provide insights into feature values derived from FP and TCB-related low-level coordination data, and their similarities and differences.
Results
The Effect of TCB Duration on Team Goal Accomplishment Duration
We fitted a linear mixed-effects model to predict goal accomplishment duration (M = 494.43, SD = 187.32) with TCB duration (M = 40.04, SD = 35.68), with a random intercept for team. The total explanatory power of the model was found to be large (conditional R 2 = .30), with the fixed-effects alone explaining 9% of the variance (marginal R 2 = .09). The model’s intercept was at 438.87 (95% CI [371.97, 505.77], t(93) = 13.03, p < .001). We observed a moderate positive effect of TCB duration on the goal accomplishment duration (b = 1.80, 95% CI [0.67, 2.93], pseudo β = .34, 95% CI [0.13, 0.56], t(93) = 3.15, p = .002). These findings show that the longer the TCB duration, the longer it took teams to achieve their main goal, that is, rescuing five non-playable characters as quickly as possible. More specifically, with every second spent in TCBs, it took teams nearly double the time to accomplish their main goal.
Classification Based on TCB and FP Windows of Team Coordination
As indicated in Figure 4, a total of 24 classifiers were trained and tested, one for each feature data set, which were based on four different low-level team coordination data types and six possible window combinations. The resulting precision scores ranged from 0 to 55.71% (M = 23.51, SD = 14.15). Recall scores ranged from 0 to 86.36% (M = 48.78, SD = 23.16). Finally, F1-scores ranged from 0 to 50.38% (M = 28.58, SD = 13.70). A general overview of all the results can be found in Supplemental Table S1. In addition, baseline values for precision, recall, and F1-score were the same, ranging from 5.98 to 26.11% (M = 18.66, SD = 5.79).
Since we aimed to assess approaches that can robustly and precisely identify TCBs, we report on those with the highest precision scores. We found that the top four highest precision scores all followed from the classification of low-level team coordination windows containing TCBs and that occurred 10 s prior to and during FPs. The results of this approach are displayed in Figure 6. An overview of the best classification results in terms of precision scores based on Team Coordination Breakdown (TCB) windows and windows that occurred 10 s prior to and during false positives (FPs), per coordination data type (PPG: photoplethysmogram; EDA: electrodermal activity; SC: synchrony coefficient; %DET: determinism). Baseline scores are indicated with the oblique lined areas, and the error bars represent each score’s 95% confidence interval. Photoplethysmogram (PPG); electrodermal activity (EDA); synchrony coefficient (SC); determinism (%DET).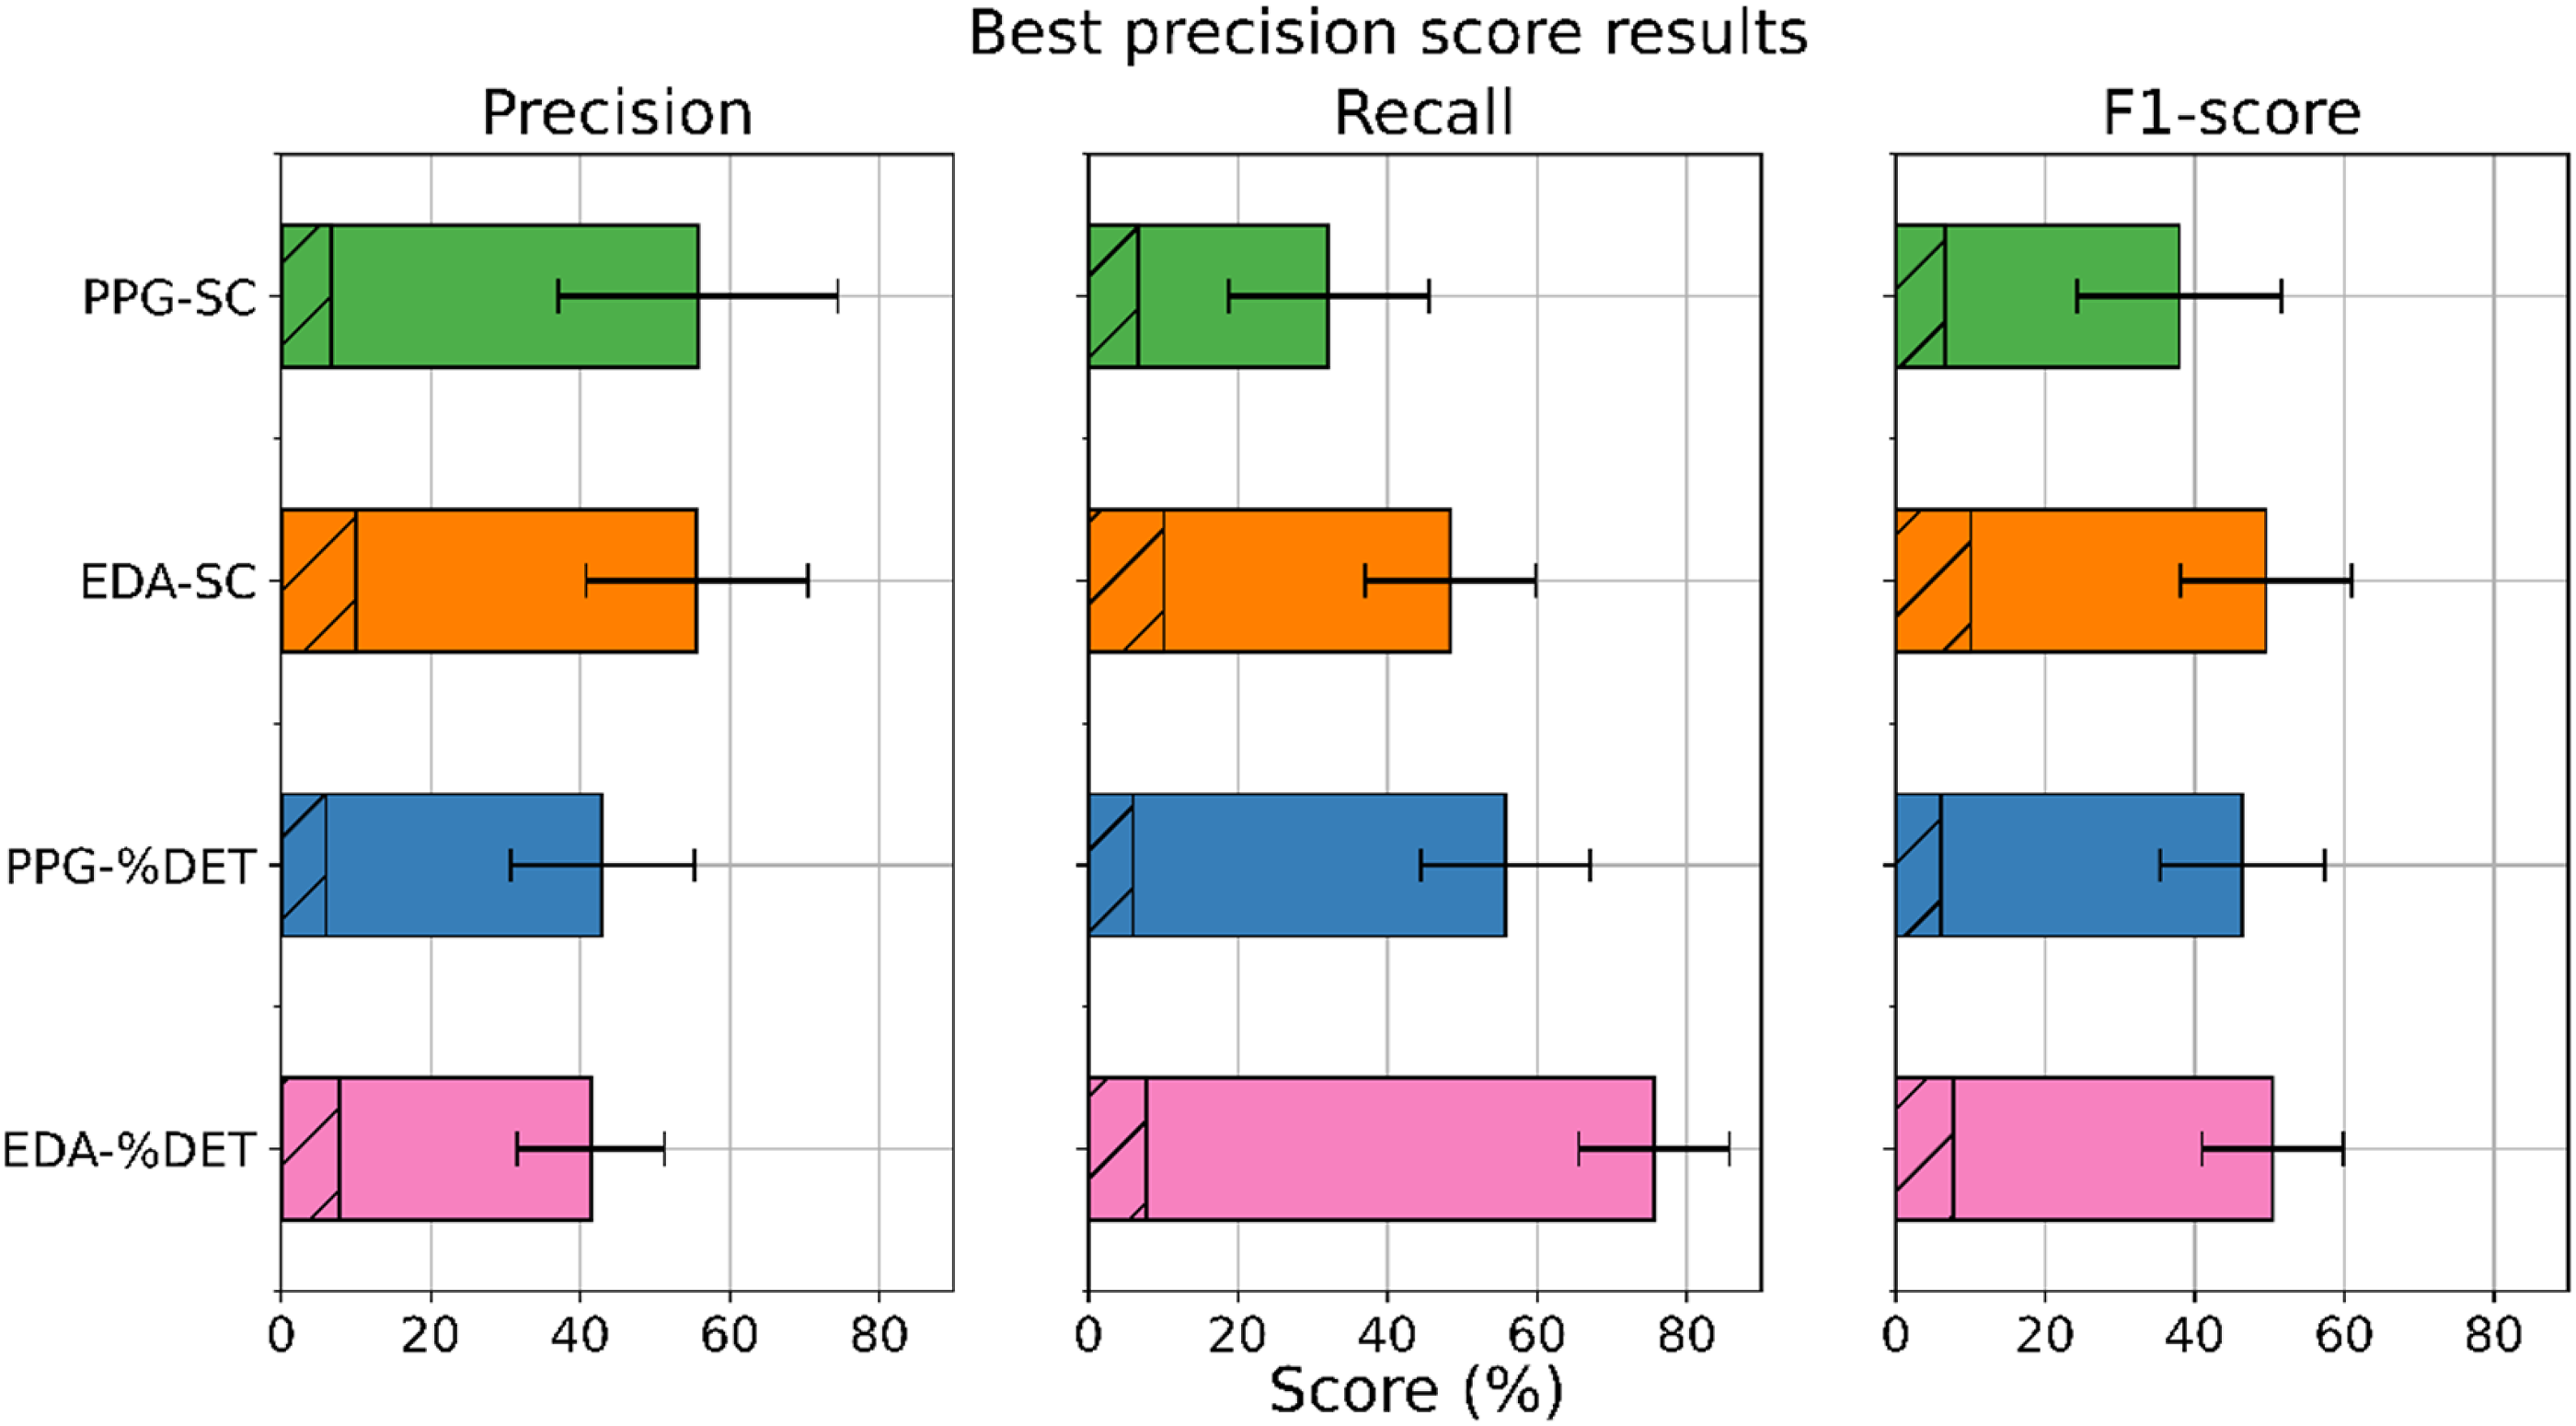
Our results in Figure 6 show that overall, higher precision scores are paired with lower recall scores, and vice versa. All scores exceeded the baseline scores, indicating that our classifiers performed above chance levels. In terms of precision scores, a classification based on features derived from PPG-SC signals resulted in the highest score. With this classification, up to 55.71% of our instances classified as TCBs were actual TCBs (precision score). On the other hand, in terms of both recall and F1-score, a classification based on EDA signals and %DET resulted in the highest scores. With this classification, we were able to identify up to 86.36% of all TCBs (recall score), and to obtain a balance between precision and recall scores of up to 50.38% (F1-score).
Examining Selected Features
Based on the team coordination data types and window combinations that resulted in the highest precision scores, their classifier features and subsequent importance scores for each feature were identified (see Figure 7). An overview of classifier features and importance scores. A description of all features can be found in Table 1.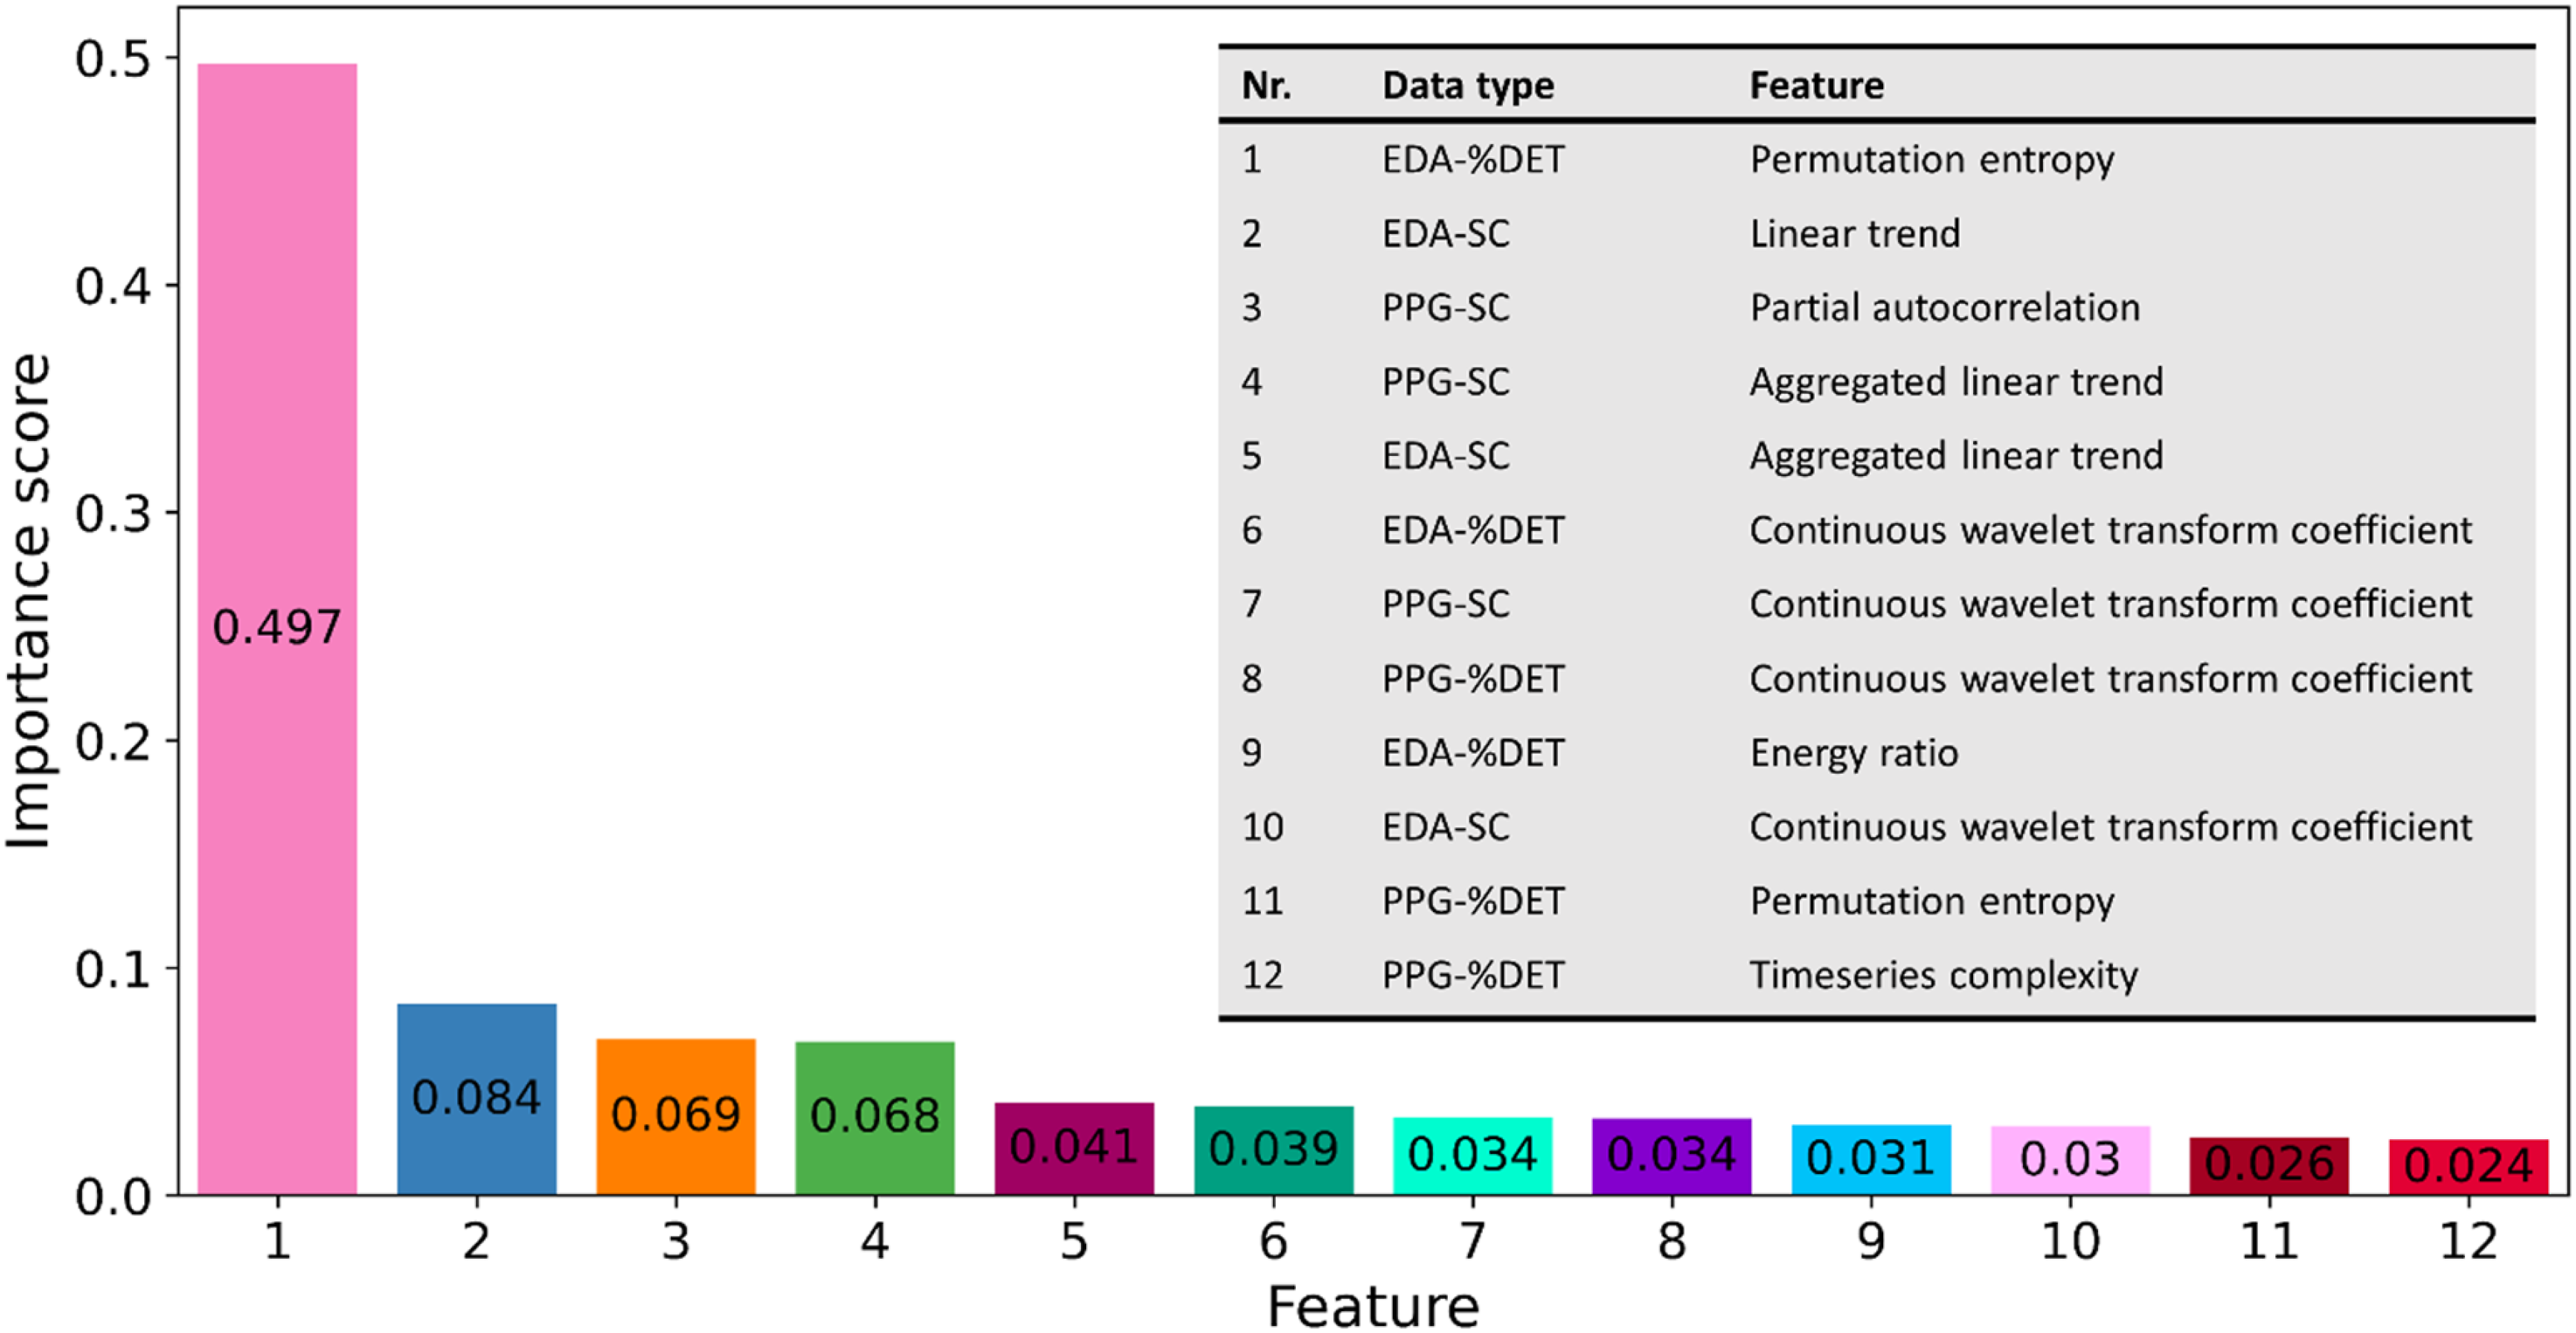
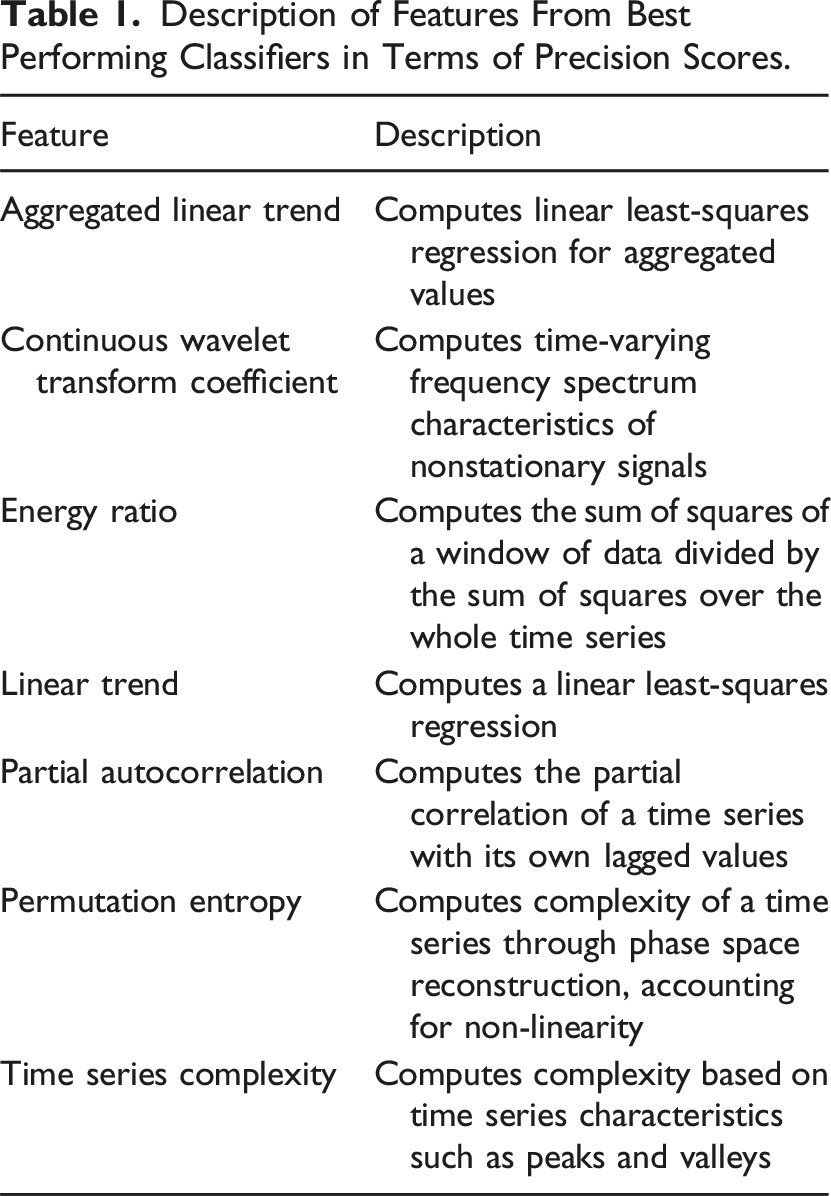
Description of Features From Best Performing Classifiers in Terms of Precision Scores.
For each important feature, values were grouped according to their label (0 = FP/not related to a TCB, 1 = related to a TCB), after which further visualizations were generated per label subset (see Figure 8). Violin plots visualizing feature values per window type (FP: false positive; TCB: Team Coordination Breakdown) and coordination data type (PPG: photoplethysmogram; EDA: electrodermal activity; SC: synchrony coefficient; %DET: determinism). Feature values more than three standard deviations (SDs) away from the mean were excluded from the plots for visualization purposes.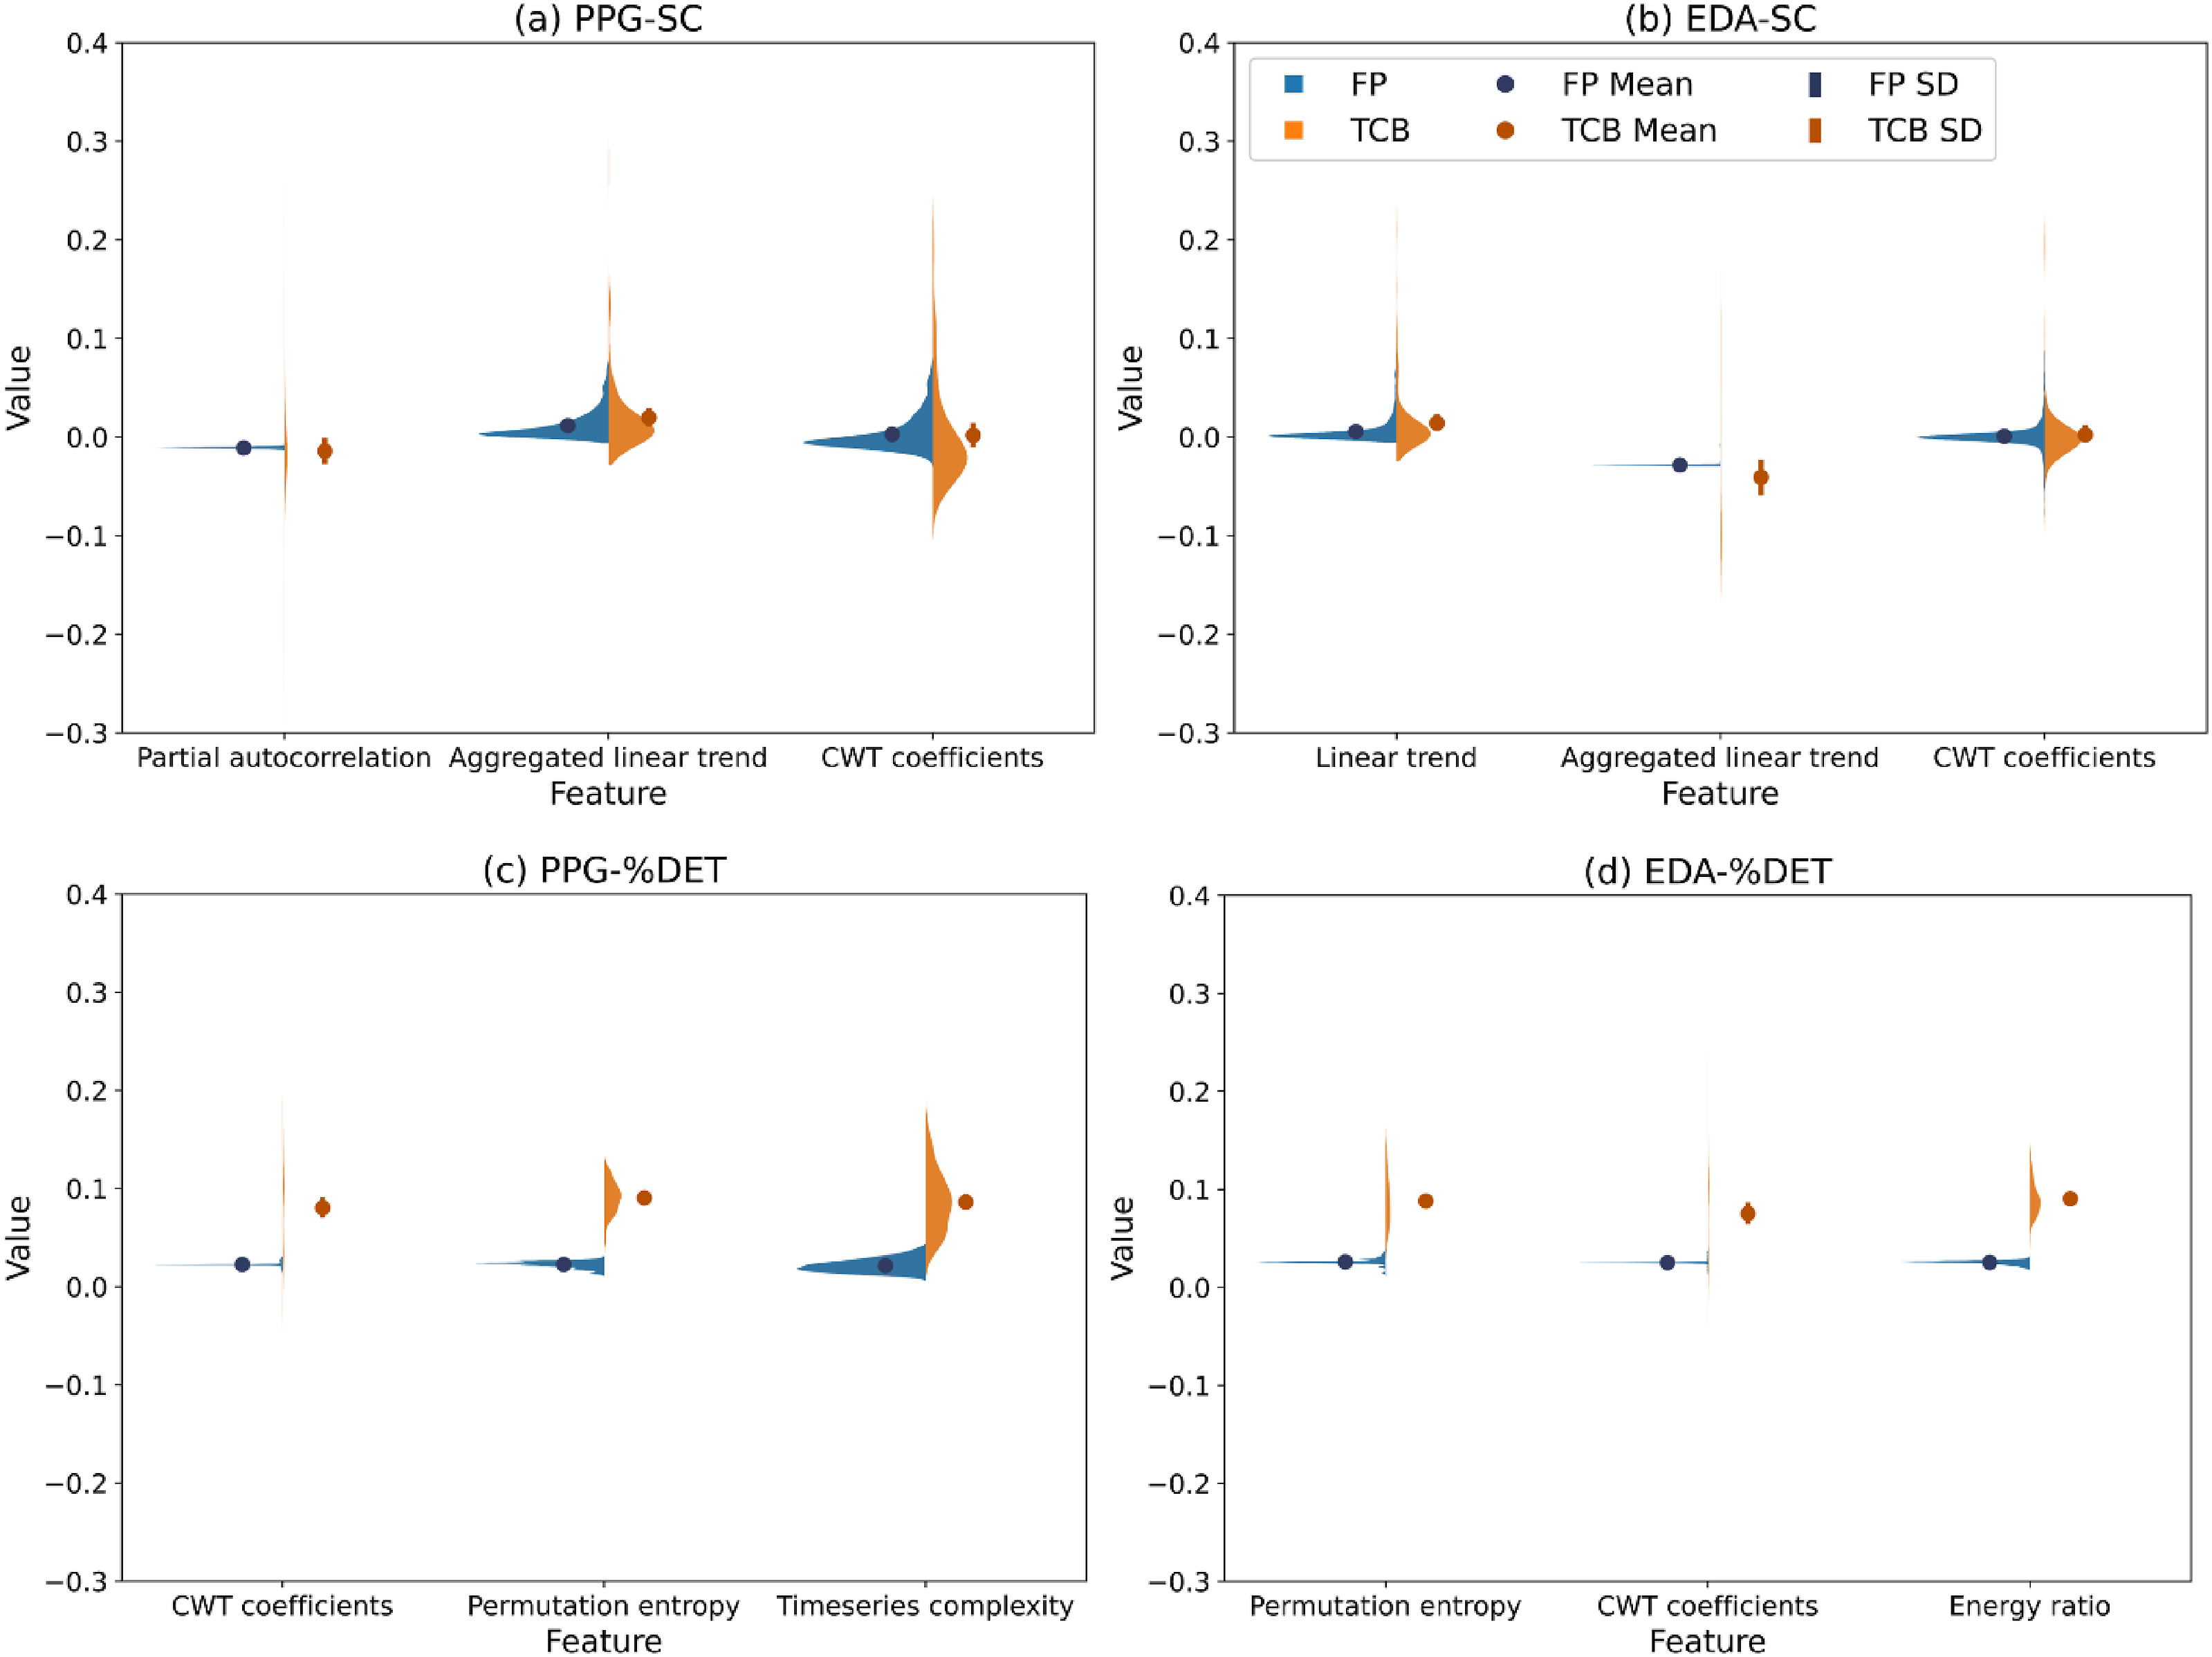
Overview of Descriptive Statistics and Kolmogorov–Smirnov Test Results per Feature.
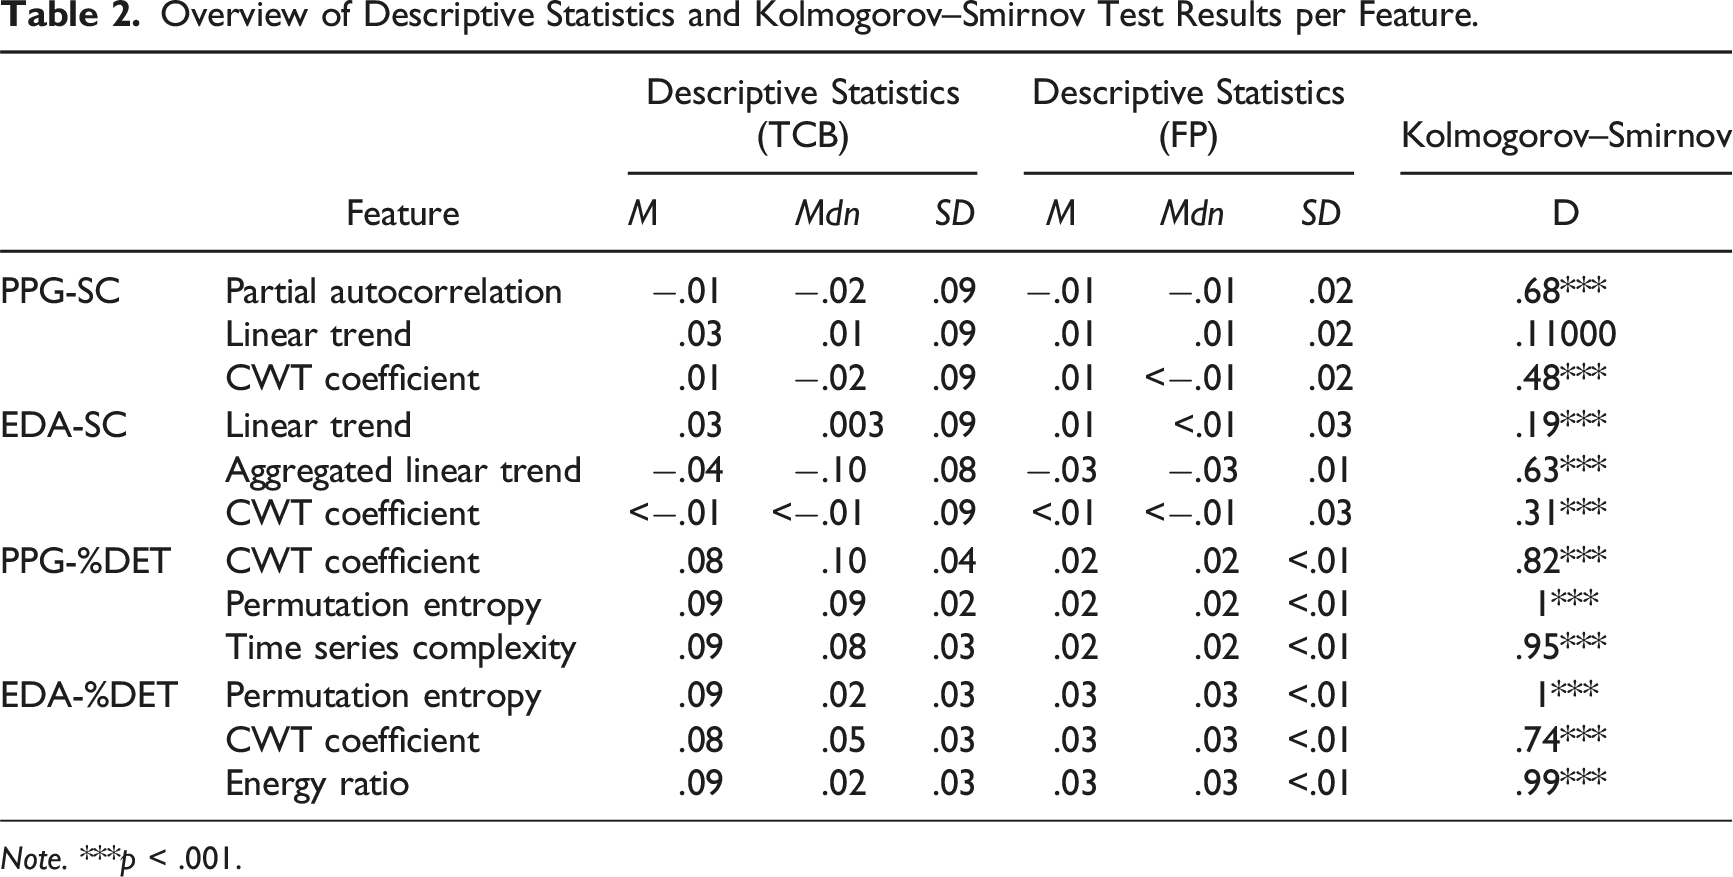
Note. ***p < .001.
The results in Table 2 show that for all features, except linear trend derived from PPG-SC data, the distribution of TCB feature values was significantly different from the distribution of FP values. This finding was consistent among all three statistical tests.
Discussion
The current paper aimed to assess TCBs captured during a time-critical collaborative task, how they relate to team performance, and their underlying structure. First, we studied the effects of TCBs on team performance. To this end, we examined how TCB duration related to goal accomplishment duration. We observed that TCBs critically delayed team’s goal accomplishment. These findings highlight the importance of understanding and identifying TCBs for efficient team performance. Subsequently, we aimed to examine the underlying structure of physiology-based team coordination that related to TCBs, through an interdisciplinary approach incorporating Complexity Science, Cognitive Science, and Machine Learning. More specifically, we investigated what features are relevant for more precisely identifying TCBs. Our findings suggest that several features are of importance to distinguish between low-level coordination that relates and does not relate to TCBs. Regardless of the signal and measure of coordination that the estimate of team coordination was based on, cross wavelet transform was found to be important for distinguishing between TCB and FP windows. Interestingly, this cross-wavelet feature (Likens & Wiltshire, 2021), as well as partial autocorrelation (Dakos et al., 2012), permutation entropy (Li et al., 2014), and time series complexity (Olthof et al., 2020), has been applied previously to examine change in coordination time series. Whereas the extracted features in these studies were based on raw individual signals, and treated as estimates of coordination, the current study extracted these features from previously calculated estimates of coordination. This suggests that both changes in the raw individual signals, as well as in team-level coordination, can be captured with these features. Features related to linear trend and energy ratio were also found to be of importance.
Further interpreting the important features to gain insights into the underlying patterns of TCBs, we found an indication of how feature values related to TCBs differ from those unrelated to TCBs. Our results showed that, with the exception of EDA-SC linear trend, distributions of TCB related and unrelated feature data were significantly different from each other. This provides support for the generation of features to capture and gain an understanding of underlying patterns in team coordination based on physiological signals. In turn, such information can be useful in future approaches to more robustly and precisely identifying TCBs. To examine the extent to which TCBs can be identified computationally utilizing our identified important features, we trained and tested decision tree classifiers. We focused on the approaches that resulted in the highest precision scores because we were interested in more precisely identifying TCBs. Our results showed that the top four highest precision scores all followed from classification between windows of coordination data that occurred during TCBs larger than 10 s, and that occurred 10 s prior to and during FPs. This indicates that distinguishing features underlying physiology-based team coordination are best captured by such short windows that include only TCBs, or also FPs. These top four findings include precision scores of up to 56%, recall scores of up to 76%, and F1-scores of up to 50%. Computational identification of TCBs in van Eijndhoven et al.’s (2023) work resulted in higher recall scores (up to 96%) but lower precision scores (up to 29%) and F1-scores (up to 36%). Our classifiers, that were focused on achieving higher precision scores of TCB identification rather than recall scores, based on PPG signals and %DET distinguishing between TCB and FP windows, resulted in a precision score that was approximately 93% higher, although our recall scores were around 21% lower. In part, this could be due to our parameter optimization that favored precision scores. To achieve increased precision and recall scores, future research should assess whether combining an approach with higher recall scores and lower precision scores (Van Eijndhoven et al., 2023), and one with higher precision scores and lower recall scores such as ours, could be merged into a more robust approach resulting in both higher recall and higher precision scores.
Comparing features’ importance scores and classifier outcomes, we found that while EDA-%DET permutation entropy was almost six times higher than the second most important feature, the decision tree based on this feature data did not achieve the highest precision score. Instead, it was the combination of the second to fifth most important features that achieved the highest precision score (as well as the closely following second highest precision score), although these had lower recall and F1-scores. So, ultimately, as decision trees split data in increasingly homogeneous subsets based on decision rules that can involve multiple features, the inclusion of one very important feature may be less relevant for precise TCB identification than the inclusion of multiple equally important features.
A limitation of the current research is that for the assessment of the effects of TCBs on team performance, five observations were omitted. As team performance was measured as the amount of time it took teams to achieve the main goal, teams that did not succeed had no relevant time score. Thus, those scores could not be used in our calculations. Even though our analysis and results provide important insights, the question how TCB duration relates to the worst performing teams (i.e., teams that did not achieve the main goal) was not explored in the current study. In addition, our study explored low-level coordination data of teams working on a time-critical collaborative game task. The assessment of real-world time-critical contexts, such as medical teams collaborating during resuscitation or firefighters working together to put out a fire, as well as non-time-critical contexts, such as pilots navigating through unforeseen weather circumstances or astronauts repairing a lunar vehicle malfunction, was beyond the scope of this study. Future research should consider these contexts, to obtain a more complete insight into TCBs occurring under real-world circumstances. Given that we incorporated a LOOCV approach, testing our classifier on unseen team data from a completely separate data set, as well as on data from different contexts, might also provide further insights into our approach’s generalizability. Concurrently, to further understand the impact of TCBs, researchers should focus on how different root causes of TCBs (e.g., insufficient problem verbalization and insufficient task delegation; Xiao et al., 1998) relate to the duration of TCBs, as well as how these affect team performance.
A second limitation is that we merely utilized two different physiological signals and measures of coordination, resulting in four types of coordination data capturing temporal alignment. Previous work on low-level team coordination (Halgas et al., 2023; Kazi et al., 2021) has identified a multitude of other suitable signals and coordination measures that can capture coordination differently (e.g., lead-lag relationships and division of labor). Given that our findings show different precision, recall, and F1-score patterns for different types of coordination data, future research should explore other signal and coordination measure combinations. Taking into account that our results were obtained only based on low-level physiological signals from wearable sensors, less readily available, higher-level measures of coordination (e.g., annotations of speech) might further improve results. Future research should investigate whether such assessment can provide additional insights regarding the correspondence between low- and high-level team coordination. Furthermore, for our classification algorithm, we utilized one simple algorithm (decision trees). With an increasing amount of classifiers available, future research should incorporate different, and perhaps, more complex methods. One option to further explore involves ensemble methods. Ensemble methods refer to a set of techniques used to build multiple models whose individual decisions are combined to improve result metrics over those of individual models (Dietterich, 2000). This approach has been frequently applied when working with imbalanced data sets (e.g., with few instances of TCBs and many of no TCBs; Wegier et al., 2022). Leveraging ensemble methods that optimize balanced results for both precision and recall scores might lead to increased overall results in computational TCB identification. Additionally, while the current approach evaluates individual features, we did not include combinations of features, for example, operationalized with a linear dimensionality reduction technique called Principal Component Analysis. Such a combination of features could potentially enable predictive abilities beyond those of individual features, leading to a more accurate detection of TCBs (Lin et al., 2015).
A third limitation relates to the timing of our analysis in relation to the provision of real-time feedback. In the current study, we have retroactively analyzed data. However, to support teams with meaningful and timely feedback, TCB identification has to transpire in real time. Though various aspects of van Eijndhoven et al.’s (2023) approach are suitable for real-time analysis (e.g., windowing techniques for the measurement of low-level coordination), it also partially relies on the full physiological signals for several computations. For example, the estimation of the radius parameter for MdRQA was conducted based on the full physiological signals from start to end, rather than per window. To deploy the analysis explored in the current study in real time, future research should assess whether parameters requiring full physiological signals could be predefined (e.g., based on the parameter values we computed). Similarly, future research should assess whether the identified important features of low-level team coordination could be predefined and subsequently whether a TCB classifier could be pretrained to enable real-time analysis. If we are able to identify the occurrence of TCBs in real time, we gain critical knowledge regarding episodes of ineffective team functioning, during which feedback can make a meaningful impact. In addition, to be able to provide impactful feedback, future studies should assess which information should be conveyed to teams through what modality (e.g., visually) to positively impact team functioning and performance. Previous research suggests that these studies take into account the objective behind providing feedback to decide on which information teams should receive and whether that should be delivered at an individual or team level (Wiltshire et al., 2022). Nevertheless, with our study, we contribute to the body of research that can be used as a foundation for real-time TCB identification.
Building on our current findings to further establish the types of interrelationships reported on here would provide us with a robust way to monitor teams. Moreover, such monitoring techniques could enable the creation of real-time feedback capable of benefiting high-level team coordination. Previous research found that for teams operating in time-critical and stressful situations, during which they often deal with shifting demands and environments, effective team functioning is particularly difficult to maintain (Driskell et al., 2018; Stachowski et al., 2009). Especially for such teams, timely feedback may prove helpful (Gabelica et al., 2012; Wiltshire et al., 2022). Thus, to support teams operating under stressful circumstances, we contribute towards an approach to monitor team low-level coordination and TCBs, which can be used to trigger team feedback. This feedback system aims to support effective team functioning, with the goal of ultimately improving overall team performance. We approach this by examining more robust computational identification of episodes of ineffective team functioning (i.e., TCBs), based on an examination of underlying physiology-based team coordination features.
Conclusion
Our paper has established the relevance of understanding and identifying TCBs, observing that TCBs negatively affect time-critical team performance. Our subsequent analyses identified and assessed important features for more precisely detecting TCBs, which were captured during a time-critical collaborative game task. We found that our multi-methodological approaches resulted in more precise identification of TCBs when compared to a simple baseline and previous work (Van Eijndhoven et al., 2023). In addition, our approaches present a multidisciplinary methodological procedure for generating theoretical and empirical insights into low-level team coordination and breakdowns therein. Ultimately, we contribute to advancing research towards more robust and precise computational identification of TCBs and enabling the provision of support to teams in time-critical high-stakes settings.
Supplemental Material
Supplemental Material - Team Coordination Breakdowns: Examining Physiological Features Underlying Transitions in Coordination Dynamics
Supplemental Material for Team Coordination Breakdowns: Examining Physiological Features Underlying Transitions in Coordination Dynamics by Kyana H. J. van Eijndhoven, Travis J. Wiltshire, Elwira A. Hałgas, Josette M. P. Gevers, and Max Louwerse in Journal of Cognitive Engineering and Decision Making
Footnotes
Acknowledgments
We kindly thank Dr. Paris Mavromoustakos Blom for the helpful discussions.
Author Contributions
Kyana H. J. van Eijndhoven: conceptualization, data curation, formal analysis, investigation, methodology, software, visualization, original draft preparation, reviewing, and editing. Travis J. Wiltshire: conceptualization, methodology, supervision, original draft preparation, reviewing, and editing. Elwira A. Hałgas: investigation and reviewing. Josette M. P. Gevers: conceptualization, supervision, and reviewing. Max Louwerse: conceptualization and supervision.
Declaration of Conflicting Interests
The author(s) declared no potential conflicts of interest with respect to the research, authorship, and/or publication of this article.
Funding
The author(s) disclosed receipt of the following financial support for the research, authorship, and/or publication of this article: This work was partially funded by the Dutch Research Council (NWO) as part of the NWO Complexity and Creative Industry: Grip on Transitions and Resilience program with project number 645.003.003.
ORCID iDs
Supplemental Material
Supplemental material for this article is available online.
References
Supplementary Material
Please find the following supplemental material available below.
For Open Access articles published under a Creative Commons License, all supplemental material carries the same license as the article it is associated with.
For non-Open Access articles published, all supplemental material carries a non-exclusive license, and permission requests for re-use of supplemental material or any part of supplemental material shall be sent directly to the copyright owner as specified in the copyright notice associated with the article.