
Abstract
During crisis situations, teams are more prone to coordination breakdowns that are characterized by a temporary, diminished ability to function effectively as a team. However, team research currently lacks robust approaches for identifying transitions from effective team functioning to coordination breakdowns. With the current study, we aimed to develop such robust approaches, and to deepen our understanding of how team coordination dynamics across various physiological signals reflect coordination breakdowns. Consequently, we used audiovisual data from four-person teams involved in a stressful collaborative game task to manually identify coordination breakdowns. Next, we set out to computationally identify coordination breakdowns by applying continuous measures of team coordination (windowed synchronization coefficient and multidimensional recurrence quantification analysis) to photoplethysmogram and electrodermal activity data obtained during the task, and identifying transitions therein with change point and nonlinear prediction algorithms. We found that our computational coordination breakdown identification approaches can identify up to 96% of the manually identified coordination breakdowns although our results also show that the precision of our approaches falls far behind. Our findings contribute theoretically and methodologically to the systematic investigation of coordination breakdowns, which may ultimately facilitate the support of teams in responding to and mitigating negative consequences of crisis situations.
Keywords
Introduction
Today’s society faces a wide variety of crisis situations ranging from a global pandemic to natural disasters and cyber-attacks. During these crises, complex challenges occur that require rapid and adequate responses under high-pressure conditions (Walker et al., 2013). Typically, crisis response involves professional teams, such as firefighting crews and police Special Forces that have to operate effectively under highly unstable circumstances. Shifting environments and changing demands require these teams to constantly monitor and adapt their collaborative processes to maintain effective team functioning (Baard et al., 2014; Burke et al., 2006; Christian et al., 2017; Maynard et al., 2015), while at the same time performing tasks involved in responding to the crisis (Fiore & Wiltshire, 2016). Previous research has shown that, especially under stressful conditions, the effectiveness of team adaptive performance may be compromised (Driskell et al., 2018; Stachowski et al., 2009). To support teams in responding to and mitigating negative consequences of crisis situations, it is crucial to examine the team processes that underly effective team adaptive performance as well as ineffective dynamics indicating breakdowns of team coordination.
To broaden our understanding of such team processes and ineffective team coordination dynamics, a critical phenomenon to identify and examine are team coordination breakdowns. On the one hand, team coordination is generally defined as a team process in which two or more team members work interdependently to achieve a common goal (Salas et al., 1992), which is crucial to attain effective team functioning (Kozlowski & Bell, 2013). Thus, by contrast, a coordination breakdown (CB) occurs as a result of unsuccessful coordination, and subsequently leads to a temporarily diminished ability to function effectively as a team (Bearman et al., 2010). Consequently, by identifying team CBs, significant moments within team processes underlying ineffective team adaptive performance can be located, providing a means to further analyze these points in time. Moreover, if team coordination can be measured in real time, and CBs can be identified through computational methods rather than manually, relevant and timely feedback regarding team coordination can be delivered to improve effective team adaptive performance during crisis situations (Wiltshire et al., 2022).
Examining transitions in team coordination dynamics may provide a means to identify team CBs. Team coordination dynamics describe the self-organized coordination of interacting team members within a team, to attain a larger objective that dynamically changes based on environmental cues (Demir et al., 2018; Gorman & Amazeen, 2010; Kelso, 1994). Such coordination dynamics can be measured in real time (e.g., through wearable technology) across multiple signals such as electrodermal activity (Haataja et al., 2018), heart rate variability (Henning et al., 2001), movements (Chang et al., 2017), and neurophysiology (Stevens et al., 2009), and importantly, coordination in these signals has been found to be a predictor of team functioning and performance (for extensive literature reviews, see (Hałgas et al., 2022; Kazi et al., 2021; Palumbo et al., 2017).
Team functioning involves team member interaction over time and across contexts through processes of team coordination, to meet dynamical task demands driven by their environment (Kozlowski & Ilgen, 2006). Predictive relationships exist between multiple signals from which team coordination dynamics were derived, and processes underlying team functioning. For example, studying dynamics through heart rate variability Henning et al. (2009) found that correlations between the team members’ signals predicted their self-rated ability to work together as a team. Moreover, capturing the similarity in frequency of signals, coherence in heart rate variability predicted team members’ empathy and understanding (Järvelä et al., 2014). Utilizing neural signals to model dynamics through symbolic complexity, Stevens et al. (2013) show a predictive relationship to team uncertainty and stress. Fusaroli et al. (2016) studied speech and movement-based coordination dynamics, using cross-recurrence quantification analysis. They found a predictive relationship from self-reported competence to group relatedness. Using the same measure of coordination, Mønster et al. (2016) studied team coordination dynamics obtained through electrodermal activity, induced with positive emotions. These dynamics predicted the adoption of new routines in a production task. Hence, many different operationalizations of team coordination dynamics research have been found predictive in relation to team functioning.
Similarly, predictive relationships between multiple signals, team coordination dynamics, and team performance were studied. Team performance represents the extent to which a team is able to realize a shared goal (Hackman, 2005). Numerous researchers have studied its relationship to team coordination dynamics. For example, coherence and cross-correlations derived from heart signals, electrodermal activity, and breathing, predicted different components of team performance such as task completion duration (Henning et al., 2001) and the amount of task errors (Henning & Korbelak, 2005). Dynamics based on symbolic complexity from neural signals showed to predict inaccuracies during a navigation task (Stevens & Galloway, 2014). Correlations between team members’ breathing data revealed that those dynamics could predict high or low accuracy of team performance and team movement velocity (Elkins et al., 2009).
Thus, findings from team research suggest that team coordination dynamics are linked to and could be utilized to predict team functioning and performance (Palumbo et al., 2017). Given that team CBs are instances of ineffective team functioning, which can affect team performance, the relationship between team coordination dynamics and team CBs should be further examined for the purpose of prediction. However, these findings also suggest that the different signals used to derive team coordination dynamics from, and the different measures to achieve this, determine what component of team functioning and performance can be predicted (Hałgas et al., 2022). Consequently, an important step in identifying team CBs, is examining which signals and measures of coordination are meaningful (Wiltshire et al., 2020). Then, the signals can be further quantified in terms of specific phases of team coordination dynamics (e.g., synchrony to asynchrony, or pattern stability to instability), and transitions therein can be identified that could indicate team CBs (Amazeen, 2018; Likens et al., 2014).
In previous research, team coordination dynamics have typically been studied through fixed windows of interaction resulting in an aggregate measure (Wiltshire et al., 2020; see Kazi et al., 2021 for an overview of such measures), for example, from a trial of a collaborative game or a specific task (Henning et al., 2001; Walker et al., 2013). However, to examine team CBs, it is crucial to study continuous measures of coordination that are able to provide instantaneous estimates of coordination and reflect transitions therein. To analyze team coordination dynamics from multiple signals wearable technology has increasingly been recognized as valuable. It allows for non-obtrusive collection of multi-signal data while enabling real-time measures (Kalampratsidou & Torres, 2018; Kisselburgh et al., 2015; Zhou et al., 2020).
To continuously measure coordination, existing aggregate coordination measures can be combined with a windowing method where a window of a specified length slides over a time series. At each specified window step, (e.g., at each new data point) a coordination metric is computed based on the data within that window, resulting in a sequence of coordination values (e.g., windowed cross-correlation, Boker et al., 2002, Moulder et al., 2018; windowed multiscale synchrony, Likens & Wiltshire, 2021; windowed recurrence quantification-based analyses, Amon et al., 2019, Gorman et al., 2020, Marwan et al., 2007). However, team research implementing such continuous measures is scarce (cf., Dias et al., 2019; Stevens et al., 2009). Considering that different continuous measures of coordination can provide an insight into specific aspects of coordination (e.g., synchrony, leader-follower relationships, recurrence), it is crucial to examine if and how outcomes of different measures of coordination reflect breakdowns.
Transitions within the dynamics resulting from continuous measures of coordination could be used as indicators of CBs (Amazeen, 2018; Likens et al., 2014). For instance, previous studies have deployed entropy-based methods (Likens et al., 2014; Shannon, 1948; Stevens & Galloway, 2019; Wiltshire et al., 2018) where peaks in entropy were found to indicate transitions (Stephen et al., 2009). A different method for capturing transitions is the dynamic complexity-based method (Olthof et al., 2020) where fluctuation intensity and distribution randomness values exceeding a given threshold are used as indicators of transitions. A third method involves change point algorithms (CPA), which are computed through the minimization of a given cost function over possible amounts and locations of change points within a time series (Killick et al., 2012; Taylor, 2000; Wang & Fan, 2021). A transition is detected if the cost (in terms of reduced fit between a generated model and the actual data) of including a given point as a change point is lower than the cost of not including that point as a change point. A last example is nonlinear prediction algorithms (Gorman et al., 2020), where a predicted trajectory of a time series is generated and compared to its actual trajectory, deviations between the two exceeding a threshold are considered to be transitions (Kantz & Schreiber, 2004; Sugihara & May, 1990). As each transition identification method approaches transitions differently, it is important to study which approaches can robustly identify team CBs.
In essence, team CB research entails three crucial aspects: 1) the physiological signals reflecting interaction that underly team coordination dynamics, 2) the measures of coordination that translate signal data into team coordination dynamics, and 3) the methods of identifying transitions in team coordination dynamics, indicating potential team CBs. With a growing number of methods to study continuous team coordination dynamics, and the availability of quickly advancing wearable technology, new opportunities arise in the domain of team CB research. Yet, examinations of robust measures and methods, and meaningful signals to computationally identify (without human intervention) when teams transition from functioning effectively to a CB, are currently lacking. With the current exploratory study, we aim to address this gap by 1) collecting multi-signal physiological data of teams coordinating under stressful circumstances, 2) applying multiple measures of coordination, and methods that have been shown to computationally identify transitions in coordination dynamics, and 3) comparing the results to manually identified team CBs to examine which physiological signals, measures and methods are robust and meaningful for identifying team CBs. By doing so, we address the following research questions (RQ):
To what extent can computational approaches involving multiple physiological signals, team coordination dynamics measures, and transition identification methods, be used to identify manually identified team CBs?
How do computational approaches involving multiple physiological signals, team coordination dynamics measures and transition identification methods, compare to each other in terms of performance? Our findings contribute both theoretically and methodologically to the systematic investigation of team coordination breakdowns, which may ultimately facilitate the support of teams in responding to and mitigating negative consequences of crisis situations. Methods and materials were pre-registered and are available on the Open Science Framework: https://osf.io/vyg6p/.
Method
Participants
We conducted an experiment with 47 four-person teams consisting of students (that received a reward, but participation was voluntary) and other volunteers. Due to the nature of our sample, several participants knew each other from study activities. Out of 564 reports of familiarity where each person rated their familiarity with three other team members, 10 reported having their best friend in the team, 31 reported their teammate as a friend, and 55 as acquaintance. All other teammates were rated as strangers. Only two participants indicated familiarity with the experimental task (video game used for the study). For the present purposes, 21 teams met the data quality criteria to be included in these analyses (47 females and 37 males; Mage = 21.27; age range = 18–30). The inclusion criteria were 1) good physiological signal quality (electrodermal activity; EDA and photoplethysmogram; PPG), 2) presence of video recording of each participant, 3) presence of the game’s recording. Participants were instructed not to consume recreational drugs, caffeine-containing drinks, or cigarettes within 5 hours prior to the experiment, as these could affect the physiological signals we are interested in analyzing (e.g., Davidson & Smith, 1991; Groppelli et al., 1992).
Experimental Procedure
Upon arriving to the lab, participants were informed about the experiment and the procedure, after which informed consent was requested. Next, each participant sat down in front of their own computer, to which the experimenter had access to. Then, each participant was supplied with a Shimmer GSR+ wearable (Burns et al., 2010). Participants were instructed to wear the device on their non-dominant hand for the duration of the experiment. Electrodes were placed on their ring and index finger to collect EDA data, and a sensor measuring PPG data was placed on their earlobe. Participants were informed about the task and their individual roles in the game, after which they completed initial surveys. Finally, the experimenter launched the game with the multiplayer option, so that all participants played the same game simultaneously from their individual station. Since all participants were in the same room, where they could hear and see each other, they had the opportunity to communicate with each other freely. Throughout the experiment, participants’ faces and utterances were also recorded with a webcam, and in-game performance was registered with OBS Studio software on the experimenter’s computer. The experimental procedure and the conditions therein are visualized in Figure 1. The experimental procedure for the control and perturbation conditions. Gray arrows show the control condition procedure, black arrows show the perturbation condition procedure.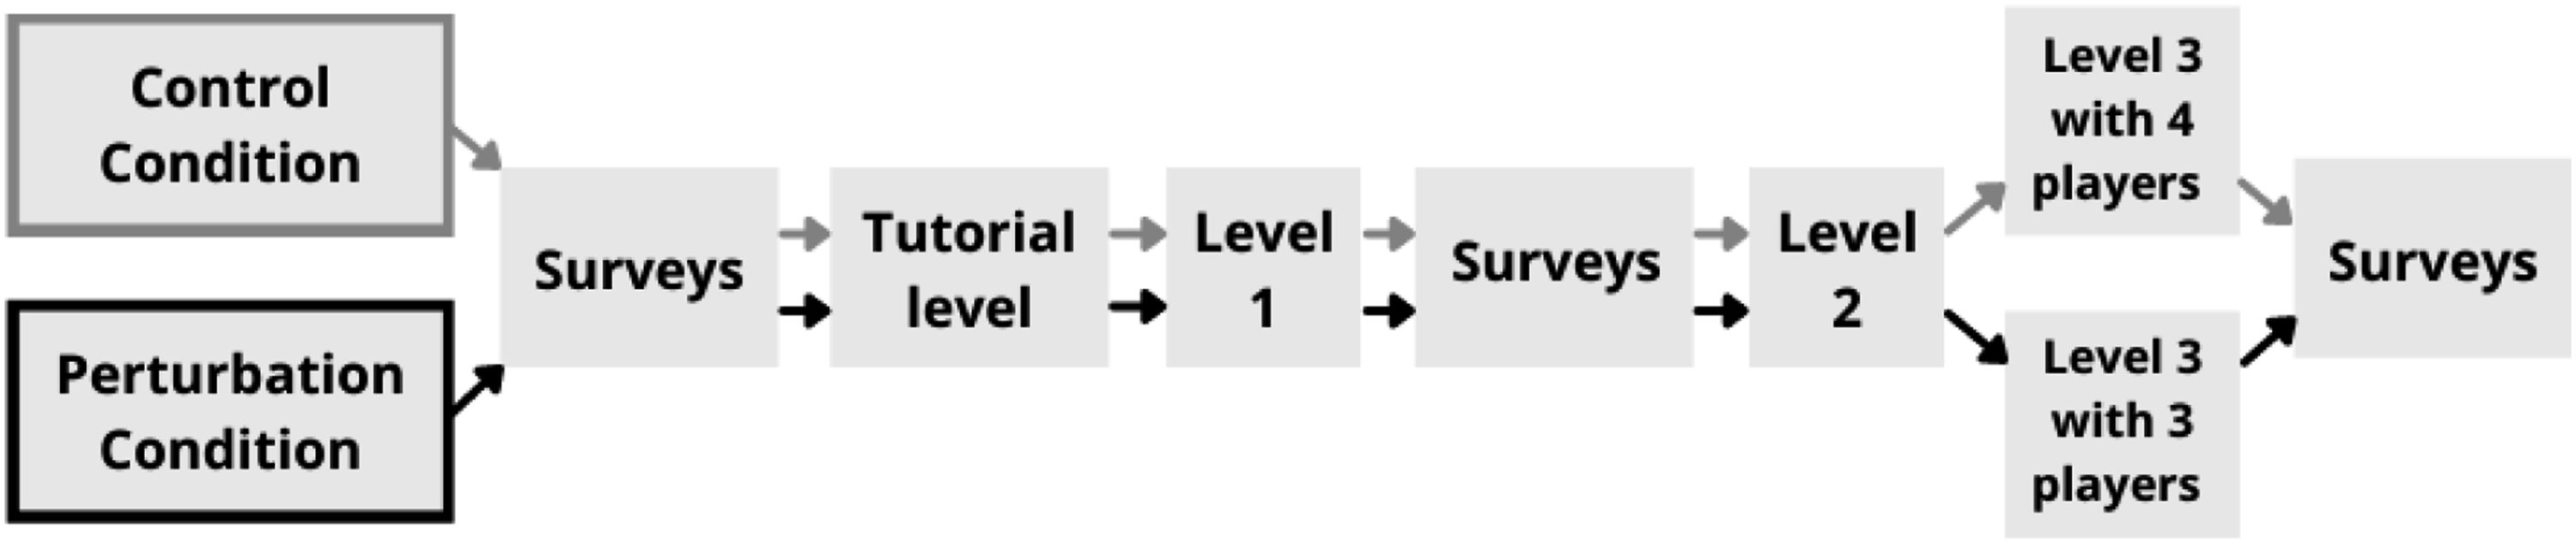
All teams completed a tutorial and three levels of the experimental game task (see Task Characteristics section for further details), lasting approximately 1.5 hours. Teams were split into two conditions, a control condition (N = 10) and perturbation condition (N = 11). For the perturbation condition, prior to the beginning of the third level, teams were informed about “technical difficulties” with one participant’s computer. These teams were informed that this participant could not play the game anymore but could communicate with the team. Differences between conditions are to be examined in another study that is part of the overarching project (other work related to this project are Hałgas et al., 2022; Wiltshire et al., 2022). After the first half and at the end of the game, participants completed a series of surveys that were not the focus of the current study. Finally, participants were debriefed, and the experiment was concluded.
Student participants were rewarded with course credits. Additionally, the participants of the three best performing teams per condition received a gift card. The experiment was approved by the local Research Ethics and Data Management Committee and conducted following all relevant ethical regulations and rules.
Task Characteristics
To simulate crisis situations, participants played four levels of the game Lovers in a Dangerous Spacetime (Hammill et al., 2015) divided in two rounds. The first round consisted of a tutorial level and level one. The second round included the second and third level of the game. Teams of four players were placed on a spaceship, where they were under attack by the enemies while saving non-playable characters. The spaceship had various stations to be operated, including shield, steering, emergency weapon, map, and four shooting stations. For the experiment, we assigned each participant to specific stations to assure all team members cooperated to achieve the task goals. These goals were 1) find and save five non-playable characters as quickly as possible, and 2) finish the level before the health of the spaceship depleted (e.g., due to enemy attacks).
While the game is not the same as a real-life crisis situation, it has several features in common contributing to the external validity of the task. During real-life crisis situations, responding teams work towards achieving an overall goal. For example, firefighters work towards saving a person from a burning building. In the game, the overall goal was to save five abducted non-playable characters (i.e., space-bunnies) as quickly as possible. In real-life crisis situations, teams also experience difficulties while working towards their goals because of rapidly changing environments and shifting demands. Changing environments in real life, such as a sudden fire blocking a passageway, have their counterpart in the game by, for example, changing levels of gravity while trying to move through the game environment. In real life, a shift in demands can be a shift from trying to save a person from a burning building to clearing a passageway to reach that person. In the game, shifting demands are incorporated by, for example, shifting the demand from saving an abducted space-bunny to fending off attacking enemies. Additionally, both in real-life crisis situations, and in the game, coordination is of crucial importance to achieve task goals. Thus, Lovers in a Dangerous Spacetime resembles real-life crisis situations in multiple ways, but unlike real-life crisis situations the experiment takes place in a controlled environment where no lives are at stake.
Manually Identifying CBs
To manually identify CBs within the audiovisual recordings of the collaborative game task and the participants, a codebook was developed (a detailed codebook with CB subtypes is included in Appendix A). Team CBs were defined as episodes of diminished ability to effectively function as a team, that occur as a result of unsuccessful coordination (Bearman et al., 2010). The first component is unsuccessful coordination, which in the context of the game task was defined as insufficient communication or actions being taken to address a situation. For example, a team does not address an enemy attack with multiple enemy spaceships shooting at their ship, or the passage through a damaging laser beam, by not putting the shield in place to protect the ship. The second component is diminished effective team functioning, which could be observed in two ways: when teams prioritized something else (e.g., exploring the game environment) over saving already located non-playable characters, causing a delay in saving at least five of these characters as quickly as possible (i.e., the main overall objective), and when teams had difficulties responding or adapting to in-game stimuli (e.g., while trying to escape attacking enemies, the space ship hits an object), possibly leading to a decrease in ship health. Hence, both components should be observed to manually identify a CB.
Manual identification of CBs was conducted by evaluating audiovisual recordings of the game and the participants. Annotations were implemented using Adobe Audition 2022 (version 22.2) at resolution of 1 s. While we distinguished between different types of CBs for the manually identified CBs, we focused on the computational identification of any team CB for the current study. This means that CBs were not broken down into further CB subtypes. Additionally, separately annotated CBs were combined if they related to the same event, such as a stimuli response, or if they did not regain effective team functioning between CBs (Bearman et al., 2015). Subsequently, on average 20 CBs were identified manually per team (SD = 7.23).
Intercoder reliability between three coders was first established based on the annotations of a 19% subset of audiovisual team recordings (N = 4). Subsequently, the remaining recordings were coded. Annotations of the 10th and 20th team were used to calculate subsequent intercoder reliability values, to ensure that coding remained reliable. Manually identified CBs were annotated with a code from the codebook and marked for onset and offset. To determine intercoder reliability, Cohen’s Kappa (κ) was computed. Additionally, given that the presence of a CB is assessed at every second for the duration of the experiment, the observed number of instances without a CB were much more prevalent than the number of observed CBs. For this reason, we also report the Prevalence-Adjusted Bias-Adjusted Kappa (PABAK), the Prevalence Index (PI), and Bias Index (BI), as suggested by Byrt et al. (1993). Overall, intercoder reliability of the presence of a CB based on κ was good (κ = .67). As anticipated, the PI score indicated the presence of prevalence for the non-CB instances (PI = .92). The subsequently calculated intercoder reliability based on PABAK was found to be very good (PABAK = .94). Very little bias was present (BI <.001).
Computationally Identifying CBs
The Shimmer wearables recorded the EDA and PPG physiological signals. The EDA signal reflects the electrical properties of the skin, which is correlated with sweat production. From this physiological signal the phasic component was extracted, which is proposed to be a straightforward indicator of event-related sympathetic activity, as opposed to the slowly varying tonic component reflecting long term fluctuations in EDA (Benedek & Kaernbach, 2010). The PPG signal reflects the relative blood volume changes arising from heart beats, based on blood vessels close to the skin (Castaneda et al., 2018). It is proposed to be an indicator of both sympathetic and parasympathetic activity (Nitzan et al., 1998). Heart rate was calculated from this signal.
By examining EDA and PPG signals, information from the two components comprising the autonomic nervous system (i.e., sympathetic and parasympathetic nervous system) could be captured. Researching the two components could provide different information regarding coordination, as each of these relates to different behavioral and physiological responses to challenges within the body (e.g., distress) and the environment (e.g., cues of threat; see Porges, 2021). For example, the parasympathetic nervous system has been found to reflect a shutdown response to such challenges, while the sympathetic nervous system is suggested to reflect a fight or flight response.
Conversions were provided by Shimmer’s ConsensysPRO software (version 1.6.0, Shimmer Sensing, Dublin, Ireland). The physiological signals were recorded at 128 Hz. Pre-processing and further data analysis were conducted in Python.
Pre-Processing
EDA data were pre-processed similarly to an approach by Westerink et al. (2020), using the PyPhysio package (Bizzego et al., 2019). The EDA signals were resampled at 10 Hz, and a 10 Hz Butterworth filter was applied to remove wideband noise. Next, artifacts were identified based on the size of absolute increases and decreases of the signal within 1 s windows and replaced with new values obtained through linear interpolation. To further remove noise, a moving average filter was applied at 1 Hz, and EDA values more than three standard deviations away from the mean were replaced with linearly interpolated values. Finally, data were standardized, and phasic and tonic components were derived from the EDA signal utilizing the package PyEDA (Aqajari et al., 2021).
The pre-processing approach for PPG data was similar to that used by van Gent et al. (2019), for which we utilized their HeartPy package. A 3.38 Hz Butterworth filter was applied to eliminate high frequency noise, and then extreme outliers were identified as PPG values more than six standard deviations away from the mean. Peak enhancement was performed without taking the identified outliers into account. Data were resampled at 1 Hz. Finally, a sliding window technique was applied to calculate heart rate in beats per minute (bpm), with a window size of 30 s (Jennings et al., 1981), and heart rate was recalculated at every 1 s (van Gent et al., 2019). As a result, a continuous sequence of heart rate values at 1 Hz was obtained.
Measures of Coordination
After pre-processing, two continuous measures of coordination were applied: windowed synchronization coefficient (SC) analysis (Guastello & Peressini, 2017), and windowed Multidimensional Recurrence Quantification Analysis (MdRQA; see Wallot & Leonardi, 2018). Windowed SC is based on correlations between all possible dyads within a group, calculated over a given window. A team-wide measure of group synchronization, the synchronization coefficient, is further calculated based on a matrix of the dyadic regression coefficients. As a result, for each window, one unbounded SC value is provided. The lag parameter was set to 1 s (Guastello & Peressini, 2017). SCs were standardized to make the results between teams comparable.
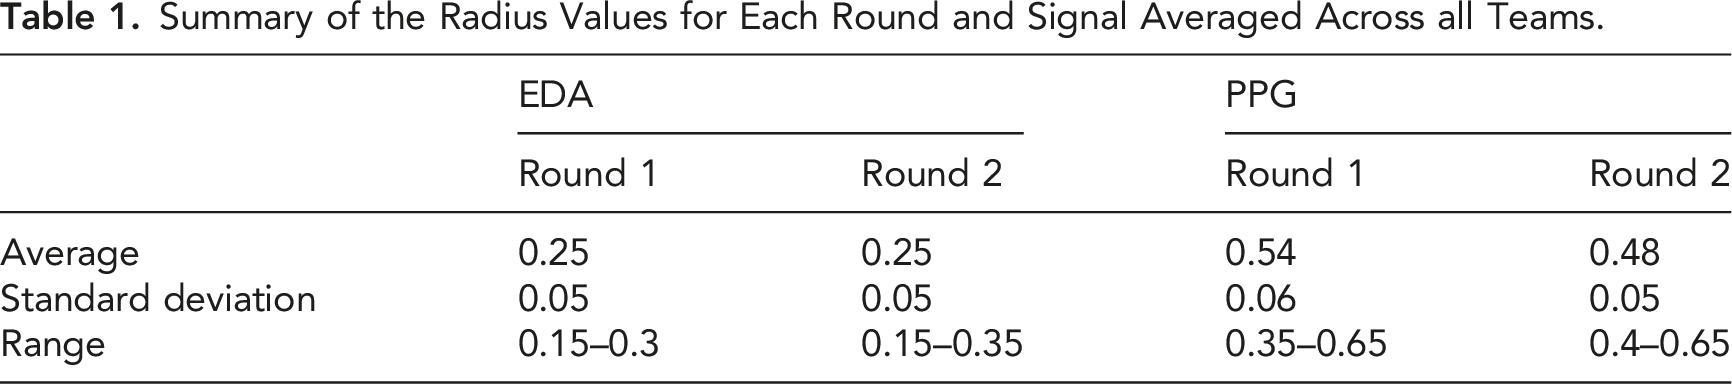
MdRQA approaches the continuous physiological signals of a team as a system, where individual signals interact with each other to self-organize into different, recurring states. This measure takes as input the desired time series from a team and embeds them in a multidimensional phase space representing the systems’ coordination dynamics (Takens, 1981). The recurrence of system states, as well as repeating sequences of those states, are used to quantify characteristics of that systems’ coordination dynamics (Wallot & Leonardi, 2018). States are considered recurrent if their similarity falls within a set threshold: the radius. Typically, similarity is based on defining the radius parameter at which all states with a Euclidian distance lower than the radius will be classified as recurrent. This generates a recurrence matrix that can also be visualized as a recurrence plot to show the recurrent states.
Thus, for our analyses, for each window of the physiological signals, a recurrence plot was generated using the multiSyncPy package (Hudson et al., 2022), from which multiple properties can be derived. An overview of the properties is provided by Wallot (2019). Similar to Gorman et al. (2020), who used recurrence-based analyses to study transitions in communication patterns, the current paper focusses on Determinism (DET). The DET variable quantifies the proportion of sequences consisting of diagonally adjacent recurrent points. This variable was calculated by dividing the sum of diagonally adjacent recurrent points (with a minimum length of 2), by the sum of all recurrent points in the multidimensional recurrence plot. As a result, for each window, a DET value was estimated ranging between 0 and 1. For example, if out of 20 recurrences, 15 recurrent points form diagonally adjacent patterns, the DET would be 15/20 = 0.75. This indicates that a majority of recurrent points are part of longer sequences of recurrent values.
Summary of the Radius Values for Each Round and Signal Averaged Across all Teams.
For EDA data, a 120 s sliding window was chosen, and an estimate of the team coordination value was computed every 1 s (Haataja et al., 2018). For PPG data, a 60 s sliding window was applied (Sobocinski et al., 2021). Again, an instantaneous value for the team coordination was calculated every 1 s.
Transition Identification Methods
The team coordination dynamics values resulting from the measures of coordination were examined to identify transitions. We used two distinct methods: a change point algorithm (CPA) based on the Pruned Exact Linear Time (PELT) method (Killick et al., 2012) and a windowed nonlinear prediction algorithm (NLPA) based on S-Map (Sugihara & May, 1990). These methods were chosen as both were previously successfully applied to time series reflecting dynamics to detect transitions (Gorman et al., 2020; Viol et al., 2022). Additionally, each method employs a distinct way of identifying transitions. Applying these different methods provides deeper insights into the nature of transitions in team coordination dynamics.
The PELT method is based on an algorithm by Jackson et al. (2005) that computes optimal partitions within data by satisfying a fitness function. The points separating optimal partitions are denoted as points of transition. The PELT method additionally incorporates pruning to decrease computational costs, which was found to render exact and fast results (Killick et al., 2012). To apply the PELT method with the Ruptures package (Truong et al., 2018), four parameters must be selected. The cost function “Radial Basis Function” was chosen to identify changes in the distribution of the data. As the minimal number of datapoints between consecutive CBs can be 0, the minimum segment length was set to 0. The jump parameter was set to 1 to generate a subsample at every new datapoint. A range of values was tested for the penalty parameter, which quantifies how much improvement of a fitness function is needed to indicate a change point. The lower the penalty, the less restrictions there are for indicating a change point, resulting in increasing numbers of change points. The sums of computed change points for each penalty value were plotted in an elbow plot, after which the optimal penalty value was determined per team and per approach.
The NLPA (Sugihara & May, 1990) splits data in two parts. The first part of that data is used to create a nonlinear model with S-Map, which maps data into a phase space and generates a model that uses nearest neighbors to make predictions. The subsequent model is then used to predict the values of the second part of the data, which are compared to the actual values of the second part to evaluate that model. Evaluation is conducted based on Root Mean Square Error (RMSE). The threshold for identifying a transition was set at two standard deviations away from the mean RMSE value. For the current study, NLPA was applied within windows of 42 s, utilizing the S-Map function of the PyEDM package (Park & Smith, 2022). This window length was heuristically chosen after applying different lengths ranging from 30–60 s with increments of 6 s to a randomly chosen sample of four teams. At each 1 s increment of the sliding window, the data within the window was split in two 21 s parts to generate a nonlinear model to be evaluated with RMSE. If the RSME value for that window was two standard deviations above the mean RMSE for a given team, a CB was identified at the split of that window (21 s after the start of the window). The embedding dimension and theta parameters for each window were chosen based on which parameter values corresponded with the highest rho (used to evaluate prediction skill). Higher theta values correspond to a smaller vicinity in which neighbors can be found to base the predictive model on. A visualization of the physiological signals, measures of coordination, and transition detection methods can be seen in Figure 2. An overview of the computational approaches to identify team CBs. The dashed line represents the components of EDA-SC and subsequent joint approaches. This representation is indicated with a dotted line for EDA-MdRQA, a wavy line for PPG-SC, and a solid line for PPG-MdRQA.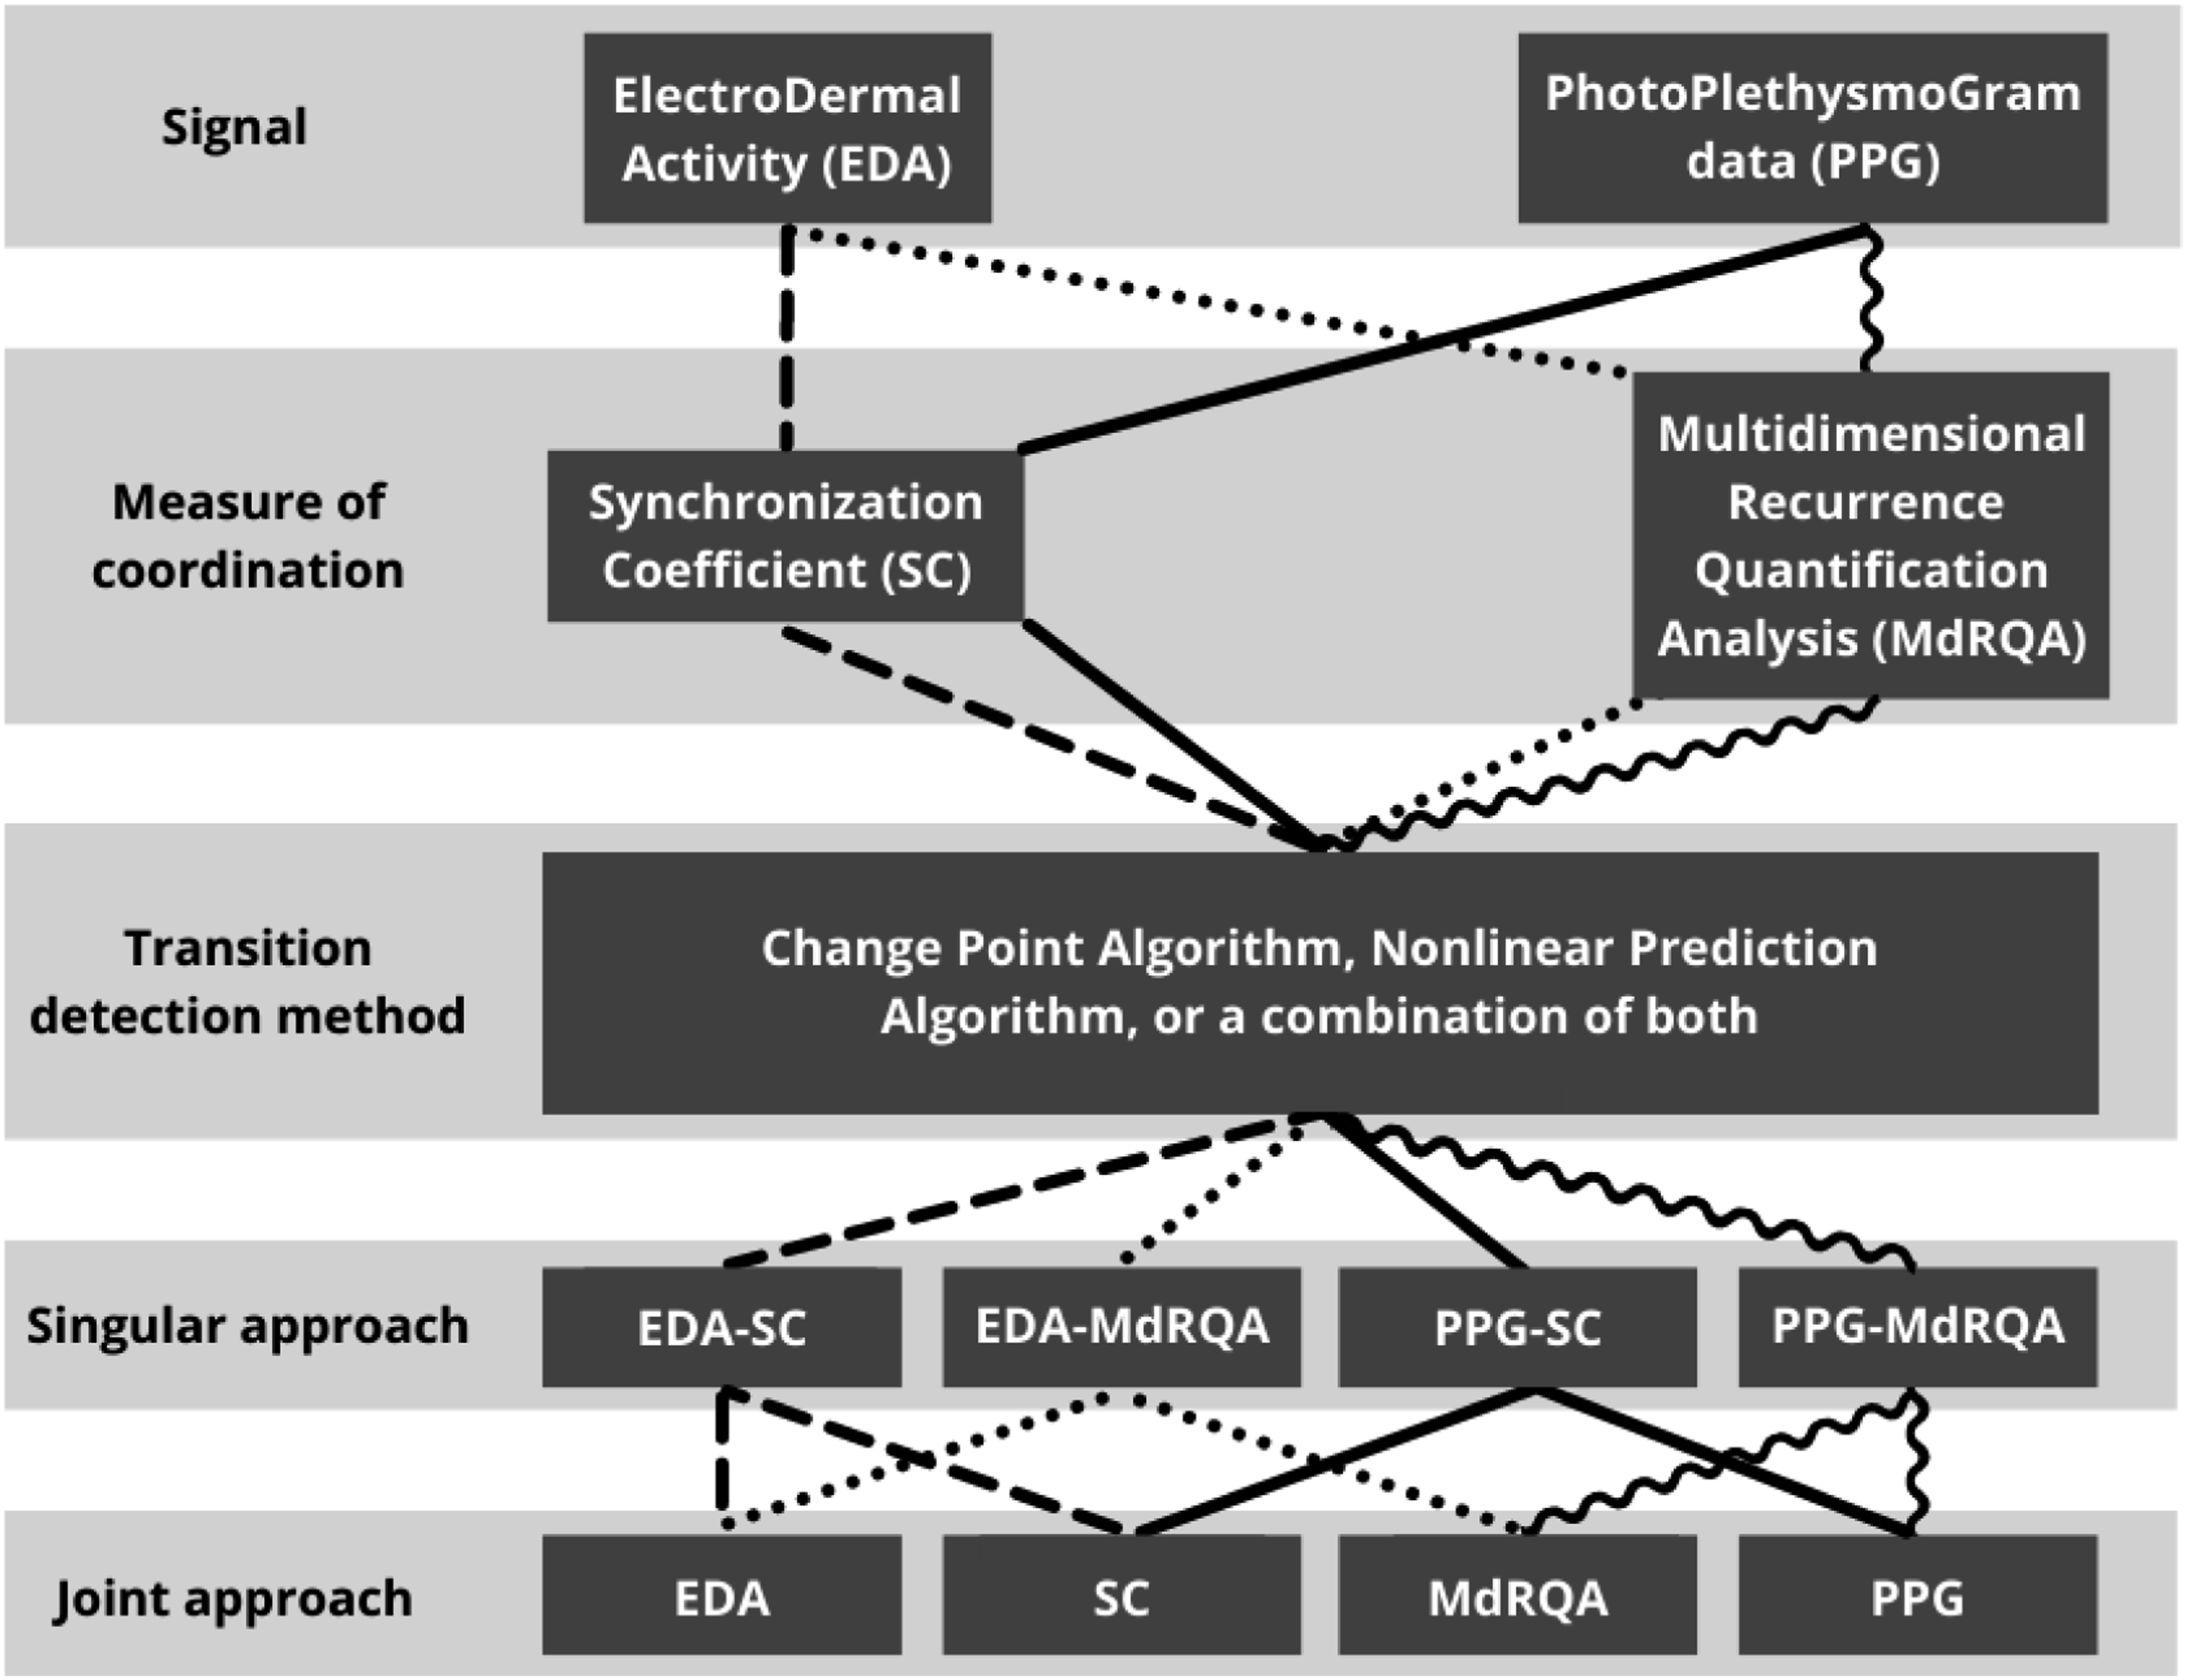
Figure 2 also displays the computational CB identification approaches that were applied. A unique line pattern represents the components that comprise each approach. First, singular approaches were examined, namely, EDA-MdRQA, EDA-SC, PPG-MdRQA, and PPG-SC. Each singular approach contained one signal, to which one measure of coordination was applied in which transitions were detected. Next, joint approaches involving two physiological signals or coordination measures were applied. The EDA approach was based on the EDA signal, to which both windowed MdRQA and SC were applied, resulting in two time series representing team coordination dynamics. Transition detection methods were applied to these time series, after which two binary time series (0 = no CB, 1 = CB) were generated. If at any timepoint, a CB was indicated in either one of the binary time series, it was marked as a CB for the EDA approach. Thus, more CBs were included for the joint approaches. A similar joint approach was applied to the PPG signal, as can be seen in Figure 2. For the MdRQA and SC approaches, both signals were utilized, and only one measure of coordination. Team coordination dynamics based on EDA and PPG data were extracted for each coordination measure. Transitions in the resulting two team coordination dynamics time series were detected. Similar to the previously described EDA approach, the subsequent CBs were joined, facilitating the inclusion of more CBs.
Comparing Manually and Computationally Identified CBs
To compare manually and computationally identified CBs, recall, precision, and F1-scores were calculated. Recall scores provided information regarding the ability of the computational approaches to detect all manually identified CBs. The precision metric reflects the ability of the computational approaches to only find manually identified CBs. Finally, F1-scores were computed to interpret the balance between precision and recall. To calculate these scores, a true positive was established when a computationally identified CB occurred in a 10 s window before, at the same timepoint as, or in a 10 s window after a manually identified CB. Time windows before and after manually identified CBs were taken into consideration, as transitions in coordination dynamics can precede (Dias et al., 2019) and succeed (Gorman et al., 2020) CBs. The 10 s window length was based on previous studies suggesting that event-related changes in the phasic component of EDA (Wass et al., 2015), and in heart rate (Jennings et al., 1981) can begin up to 10 s after an event. For the current study, a 10 s window was also chosen to assess computationally identified CBs that preceded manually identified CBs.
Furthermore, false positives were calculated as the total amount of computationally identified CBs minus the number of true positives. False negatives were calculated as the total amount of manually identified CBs minus the number of true positives. Subsequently, recall was calculated as
Data Analysis Example
To illustrate how data analysis was conducted, we provide an example in Figure 3. Figure 3 shows the data analysis that was conducted for one team. More specifically, it reflects the singular approach PPG-MdRQA (see also Figure 2). The heart rate values displayed in plot (a) are derived from PPG signals. Each line presents the heart rate of one team member. The heart rate values that fall within the red window, represent one of the windows to which MdRQA was applied. An example of the resulting recurrence plot can be found in plot (b). Plot (c) shows the DET values that were continuously computed from windowed MdRQA. The DET was then derived from plot (b), which is represented in plot (c) by the red dot. Plot (d) shows a zoomed in plot of the DET values that fall within the red window of plot (c). In the plot (d), gray vertical lines indicate a manually identified CB, while the orange dots indicate a computationally identified CB. If an orange dot falls within a window of 10 s before, during, or after a manually identified CB, it was indicated as a manually and computationally identified CB (i.e., a true positive). Overview of example data analysis of one team based on the PPG-MdRQA approach. Plot (a) shows the heart rate of each team member. Heart rates within the red window are used to generate recurrence plot (b). The subsequent DET value is indicated with a red dot in plot (c), which shows the DET values for the example team. Plot (d) provides a zoomed in version of the red window in plot (c), including manually and computationally identified CBs.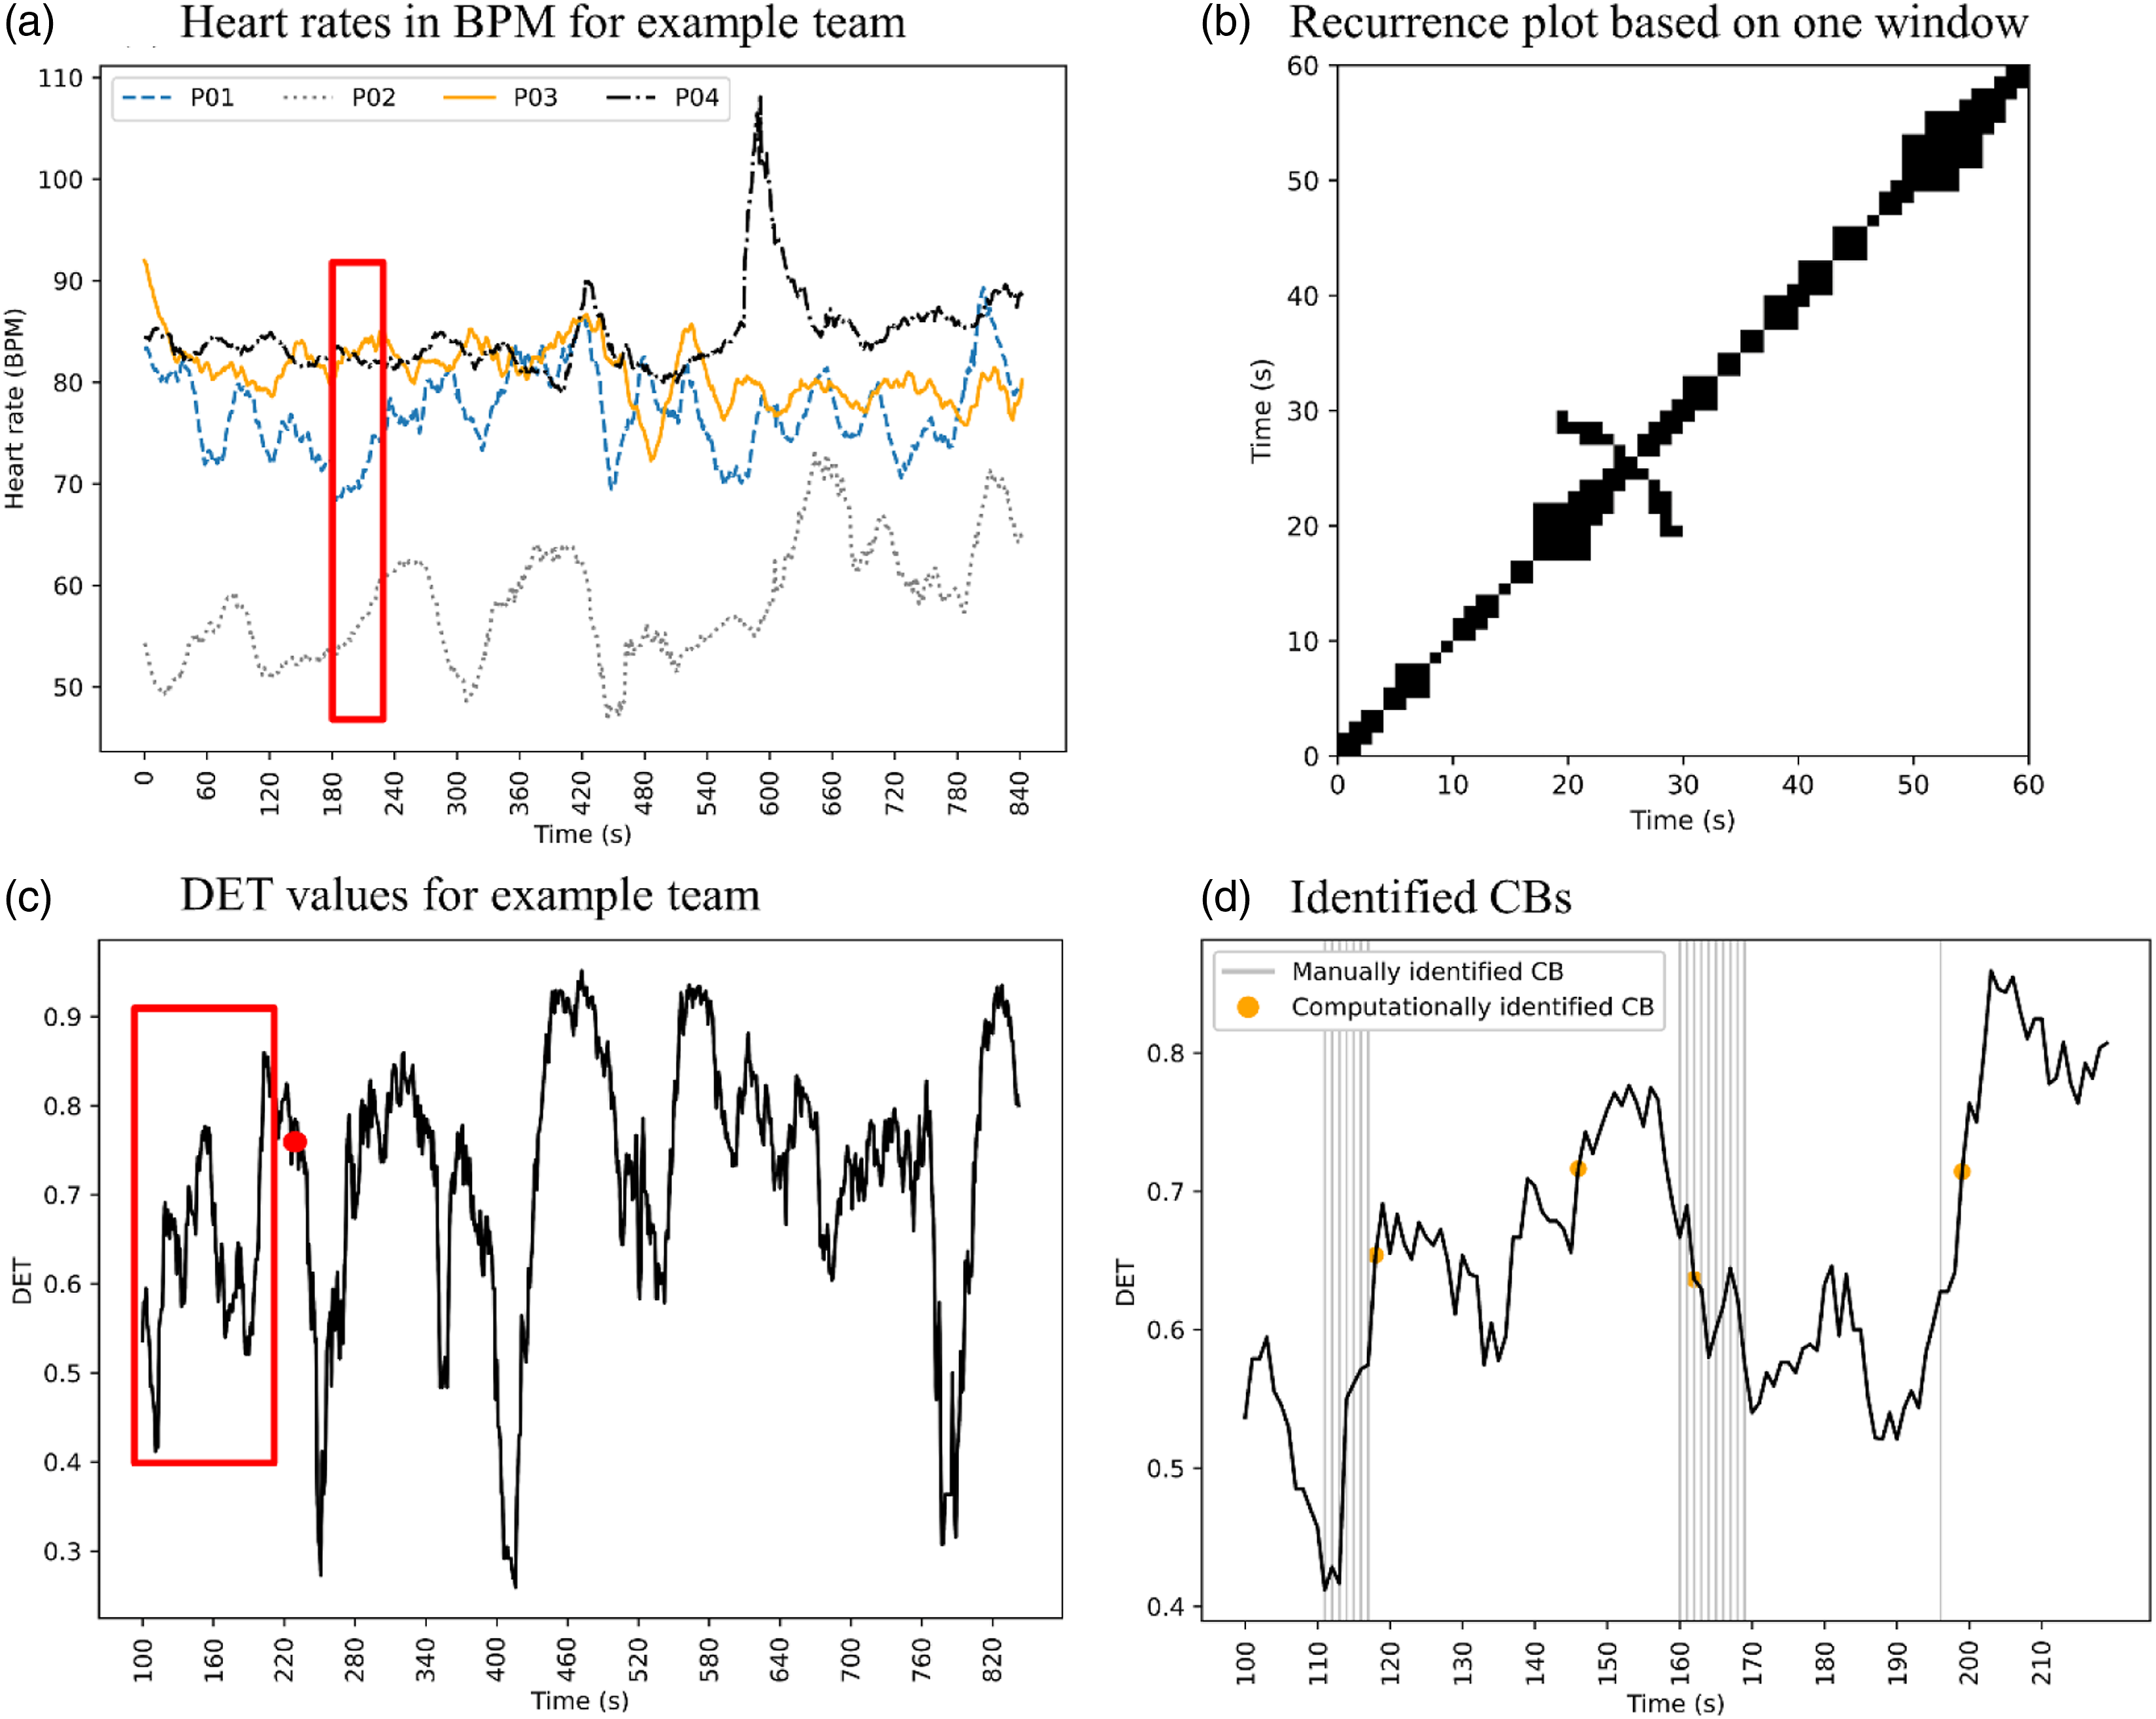
Results
Comparisons Between Singular and Joint Approaches
Figure 4 visualizes the result scores for each computational CB identification approach based on the change point algorithm (CPA) method for transition detection. In addition, Figure 4 shows that singular measures involving PPG resulted in higher recall than those involving EDA, with the PPG-MdRQA approach resulting in a slightly higher recall score than the PPG-SC approach (.01 difference). However, this approach was outperformed by all joint approaches, with the PPG approach as the best approach in terms of recall. Additionally, the PPG approach resulted in a higher recall score than the EDA approach, and the SC approach yielded a higher recall score than the MdRQA approach. In terms of precision, EDA-MdRQA scored the highest of all approaches. As recall and precision scores showed opposing patterns, higher recall was accompanied by lower precision. F1-scores were found to be similar for all approaches, with slightly higher results for singular approaches as compared to joint approaches. Results per approach for CPA including 95% confidence intervals.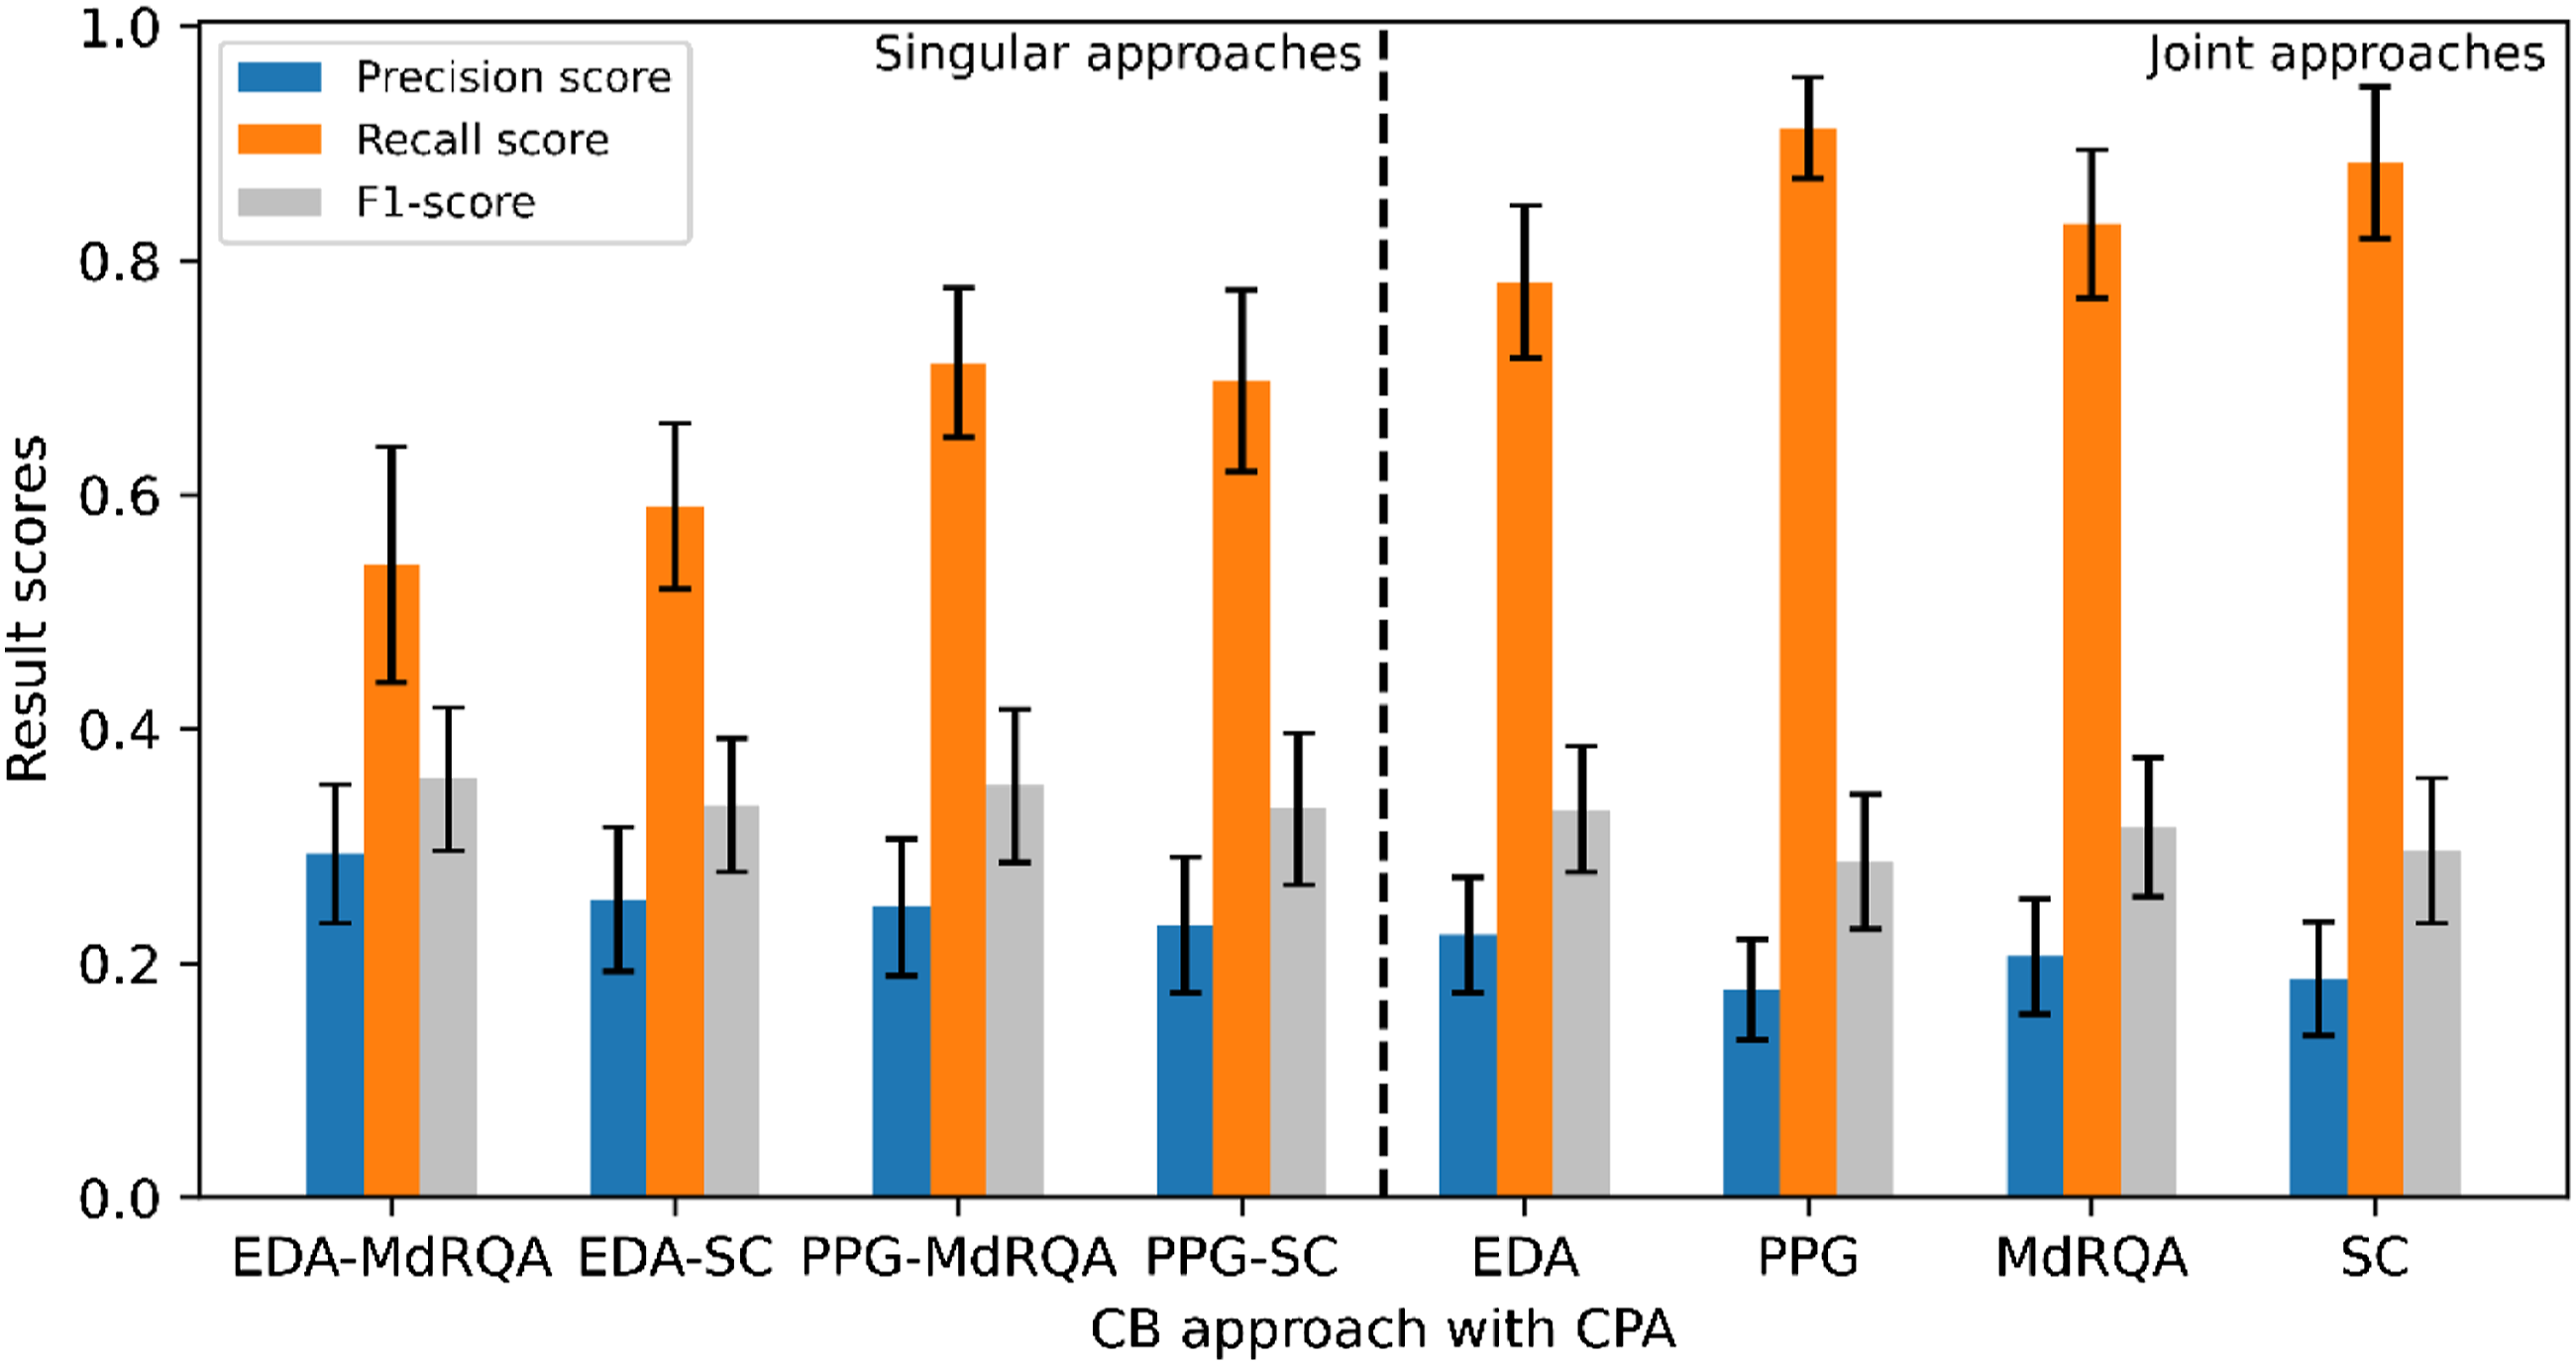
The result scores of all singular and joint approaches based on a windowed nonlinear prediction algorithm (NLPA) are presented in Figure 5. Similar to previously described results, the PPG-MdRQA approach yielded the highest recall, when compared to other singular approaches. The EDA-MdRQA approach resulted in a similar, but slightly lower recall score (.02 difference). In contrast to the previous results, the applied measure of coordination was driving higher recall rather than the signal type for the singular approaches. Figure 5 also displays that the PPG-MdRQA approach is outperformed by all joint approaches in terms of recall, with the MdRQA approach showing the highest score. Focusing on the physiological signals, the PPG approach resulted in a higher recall score than the EDA approach. In addition, the MdRQA approach yielded a higher recall score than the SC approach. Precision was found to be highest for the singular approach EDA-SC, and higher recall was again accompanied by lower precision scores. This resulted in similar F1-scores across all approaches. Results per approach for NLPA including 95% confidence intervals.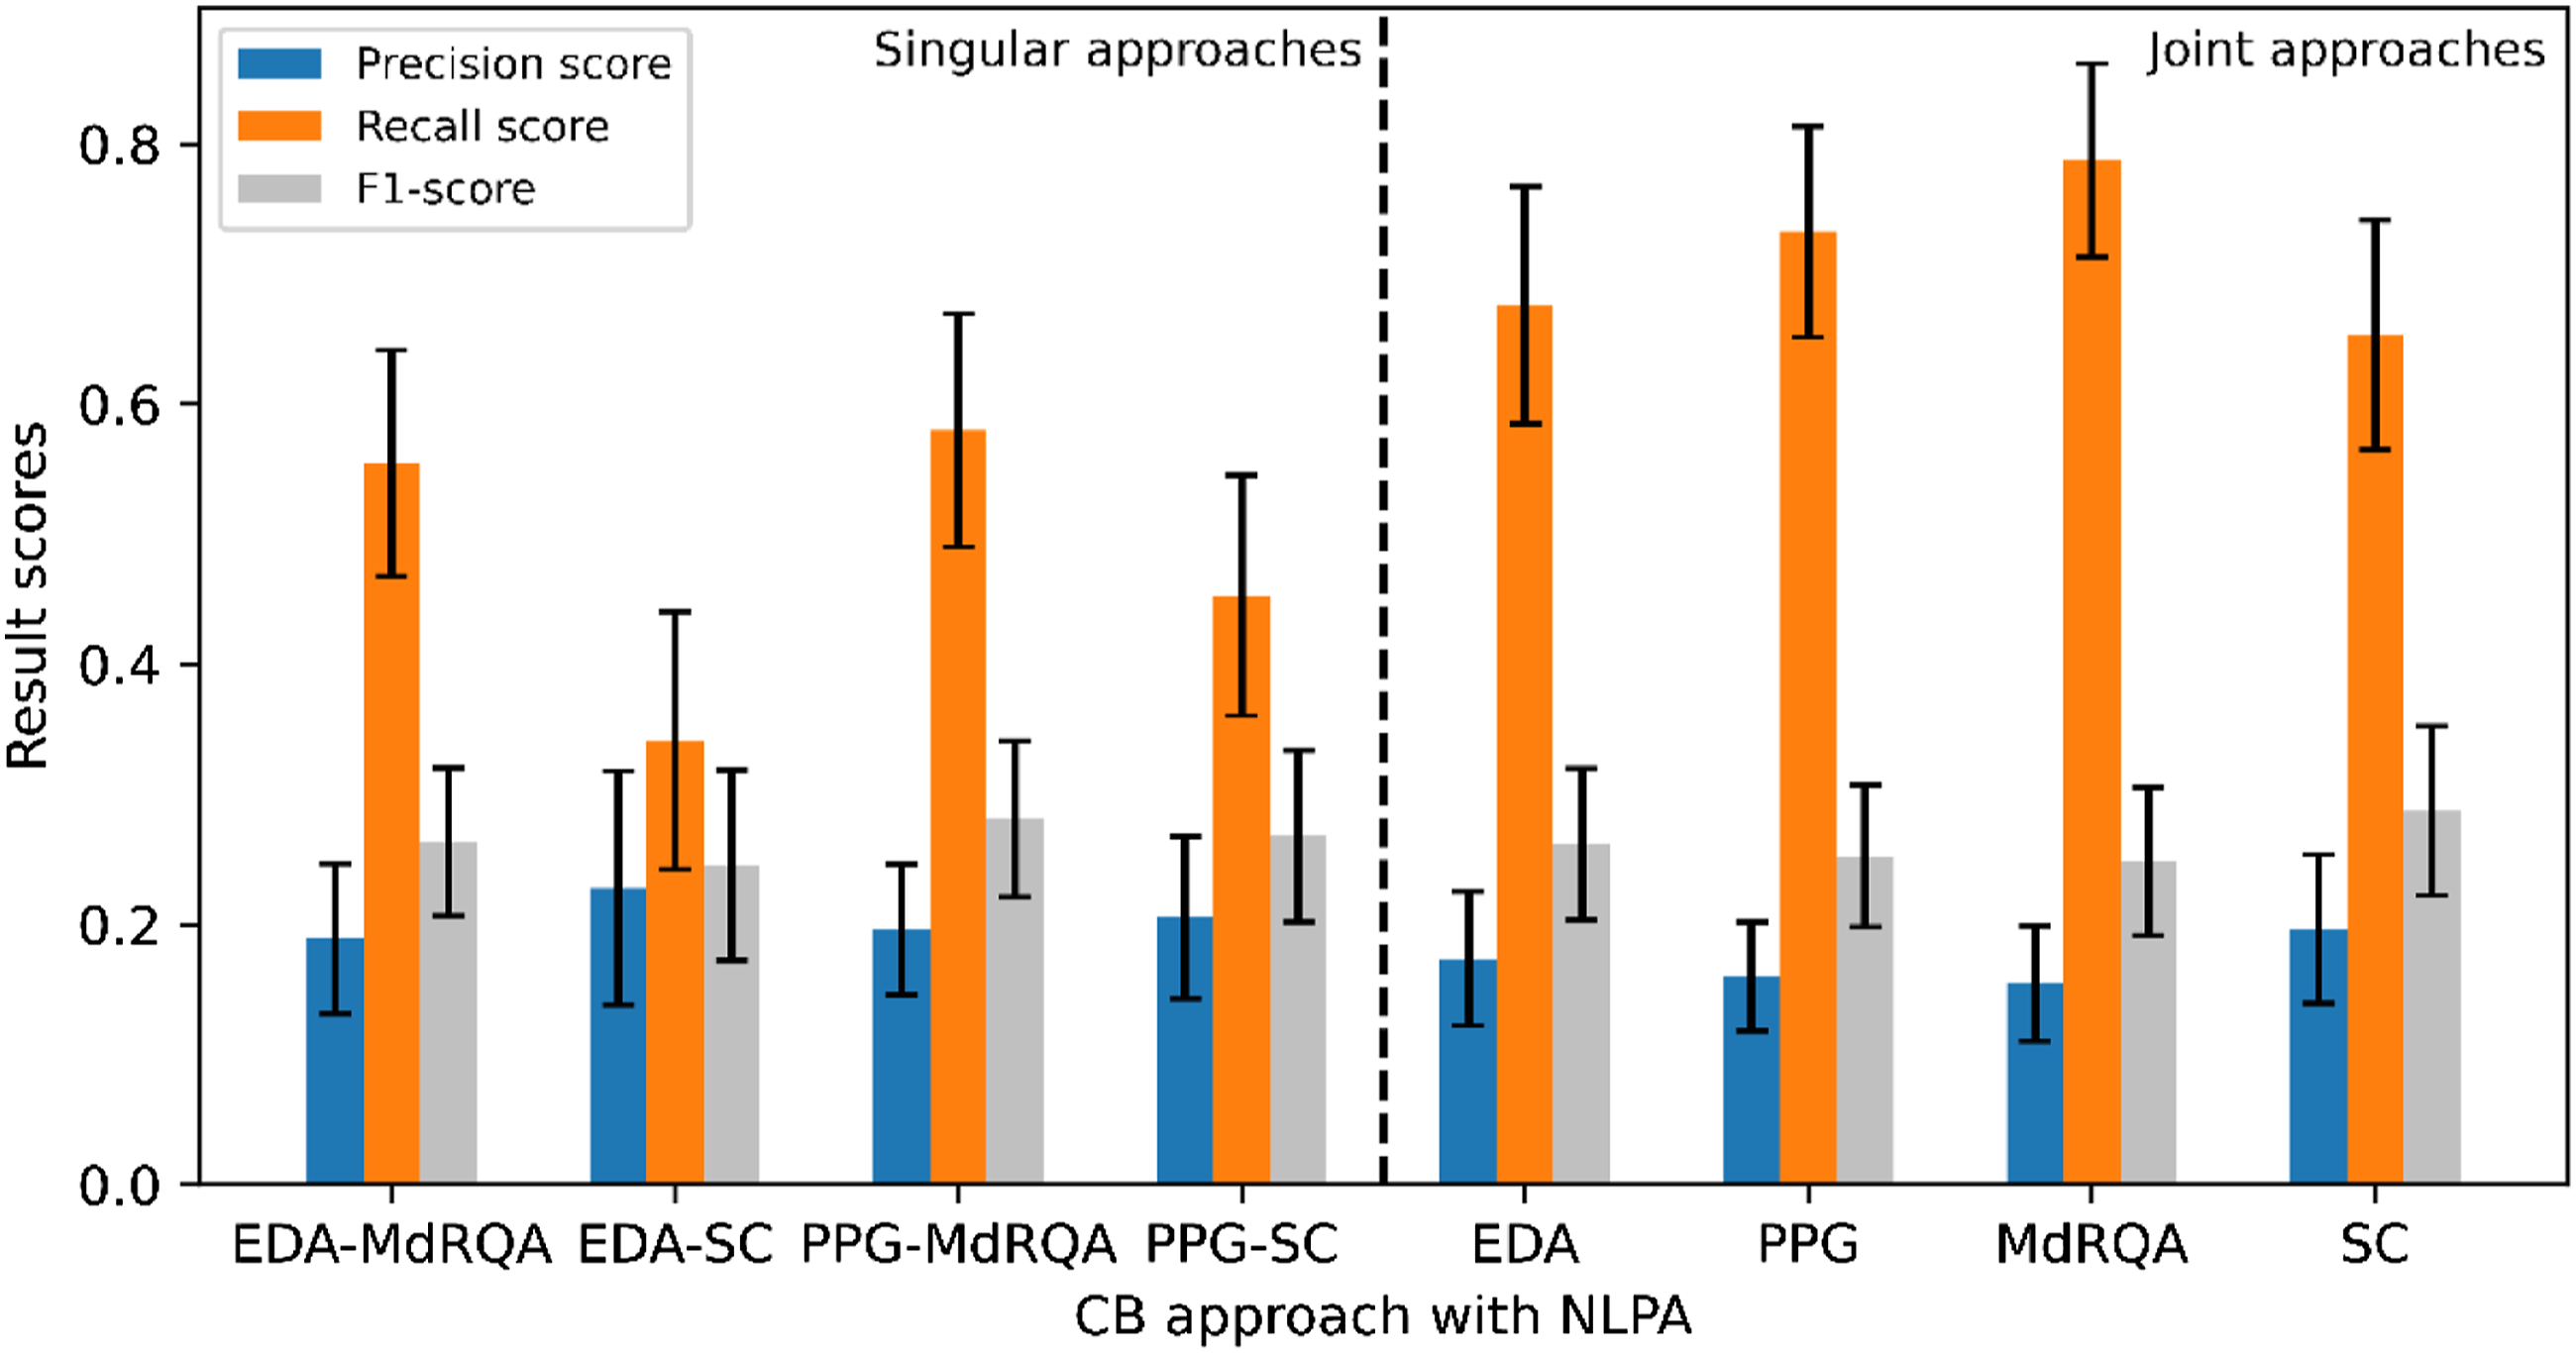
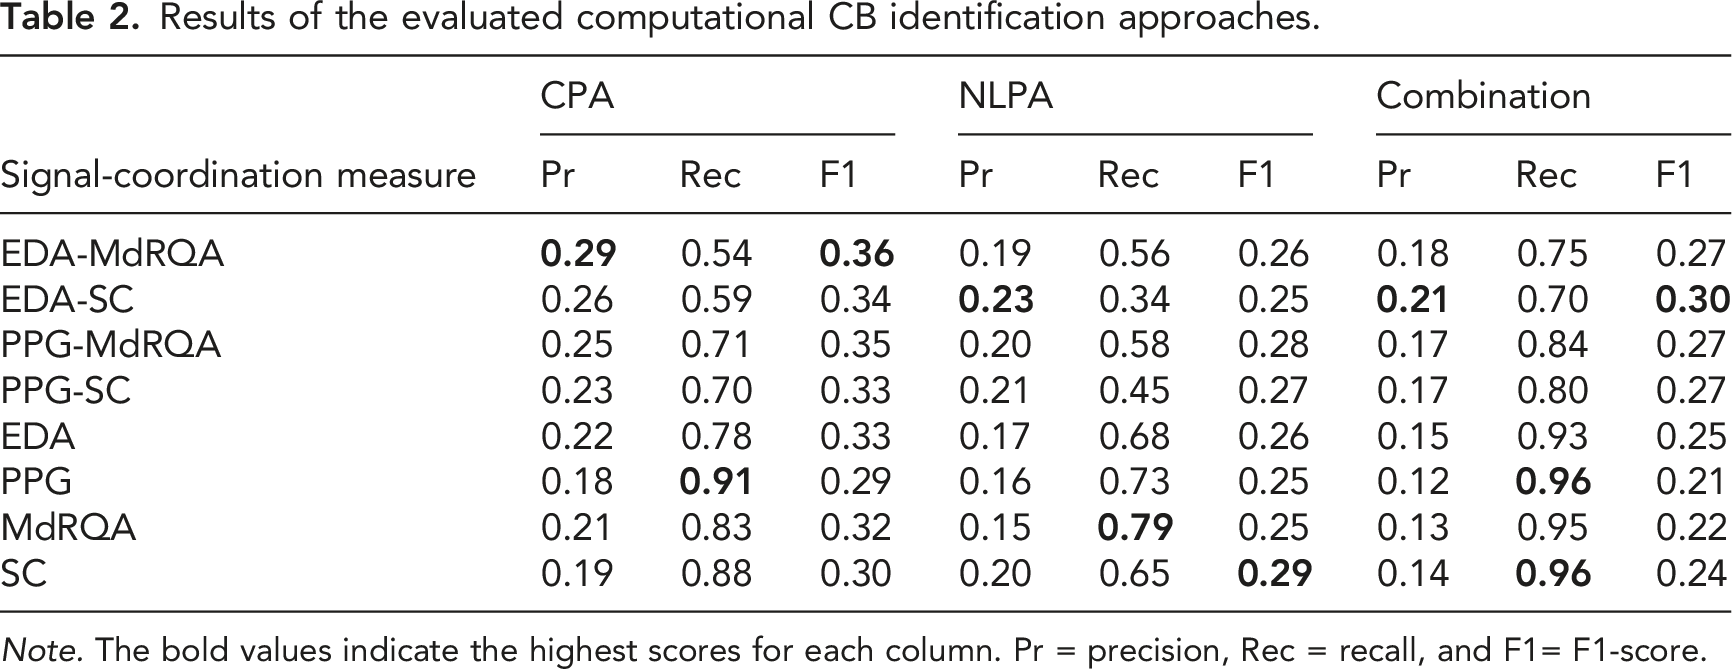
Figure 6 displays the results for all singular and joint approaches based on a combination of the CPA and NLPA transition detection method. Computationally identified CBs resulting from each detection method were joined to generate these results. Figure 6 also illustrates a result pattern similar to Figure 4 and 5. Of all singular approaches, the PPG-MdRQA scored the highest recall. The PPG-SC approach yielded similar but slightly lower recall (.04 difference). Again, the PPG-MdRQA approach is outperformed by all joint approaches in terms of recall. The highest recall was yielded by the PPG and MdRQA approaches. Naturally, the PPG approach resulted in a higher recall score than the EDA approach, and the MdRQA approach yielded a higher recall score than the SC approach. Similar results for precision and F1-scores were found, with slightly higher results for singular approaches as compared to joint approaches. All result scores are presented in Table 2. Results per approach for CPA and NLPA including 95% confidence intervals. Results of the evaluated computational CB identification approaches. Note. The bold values indicate the highest scores for each column. Pr = precision, Rec = recall, and F1= F1-score.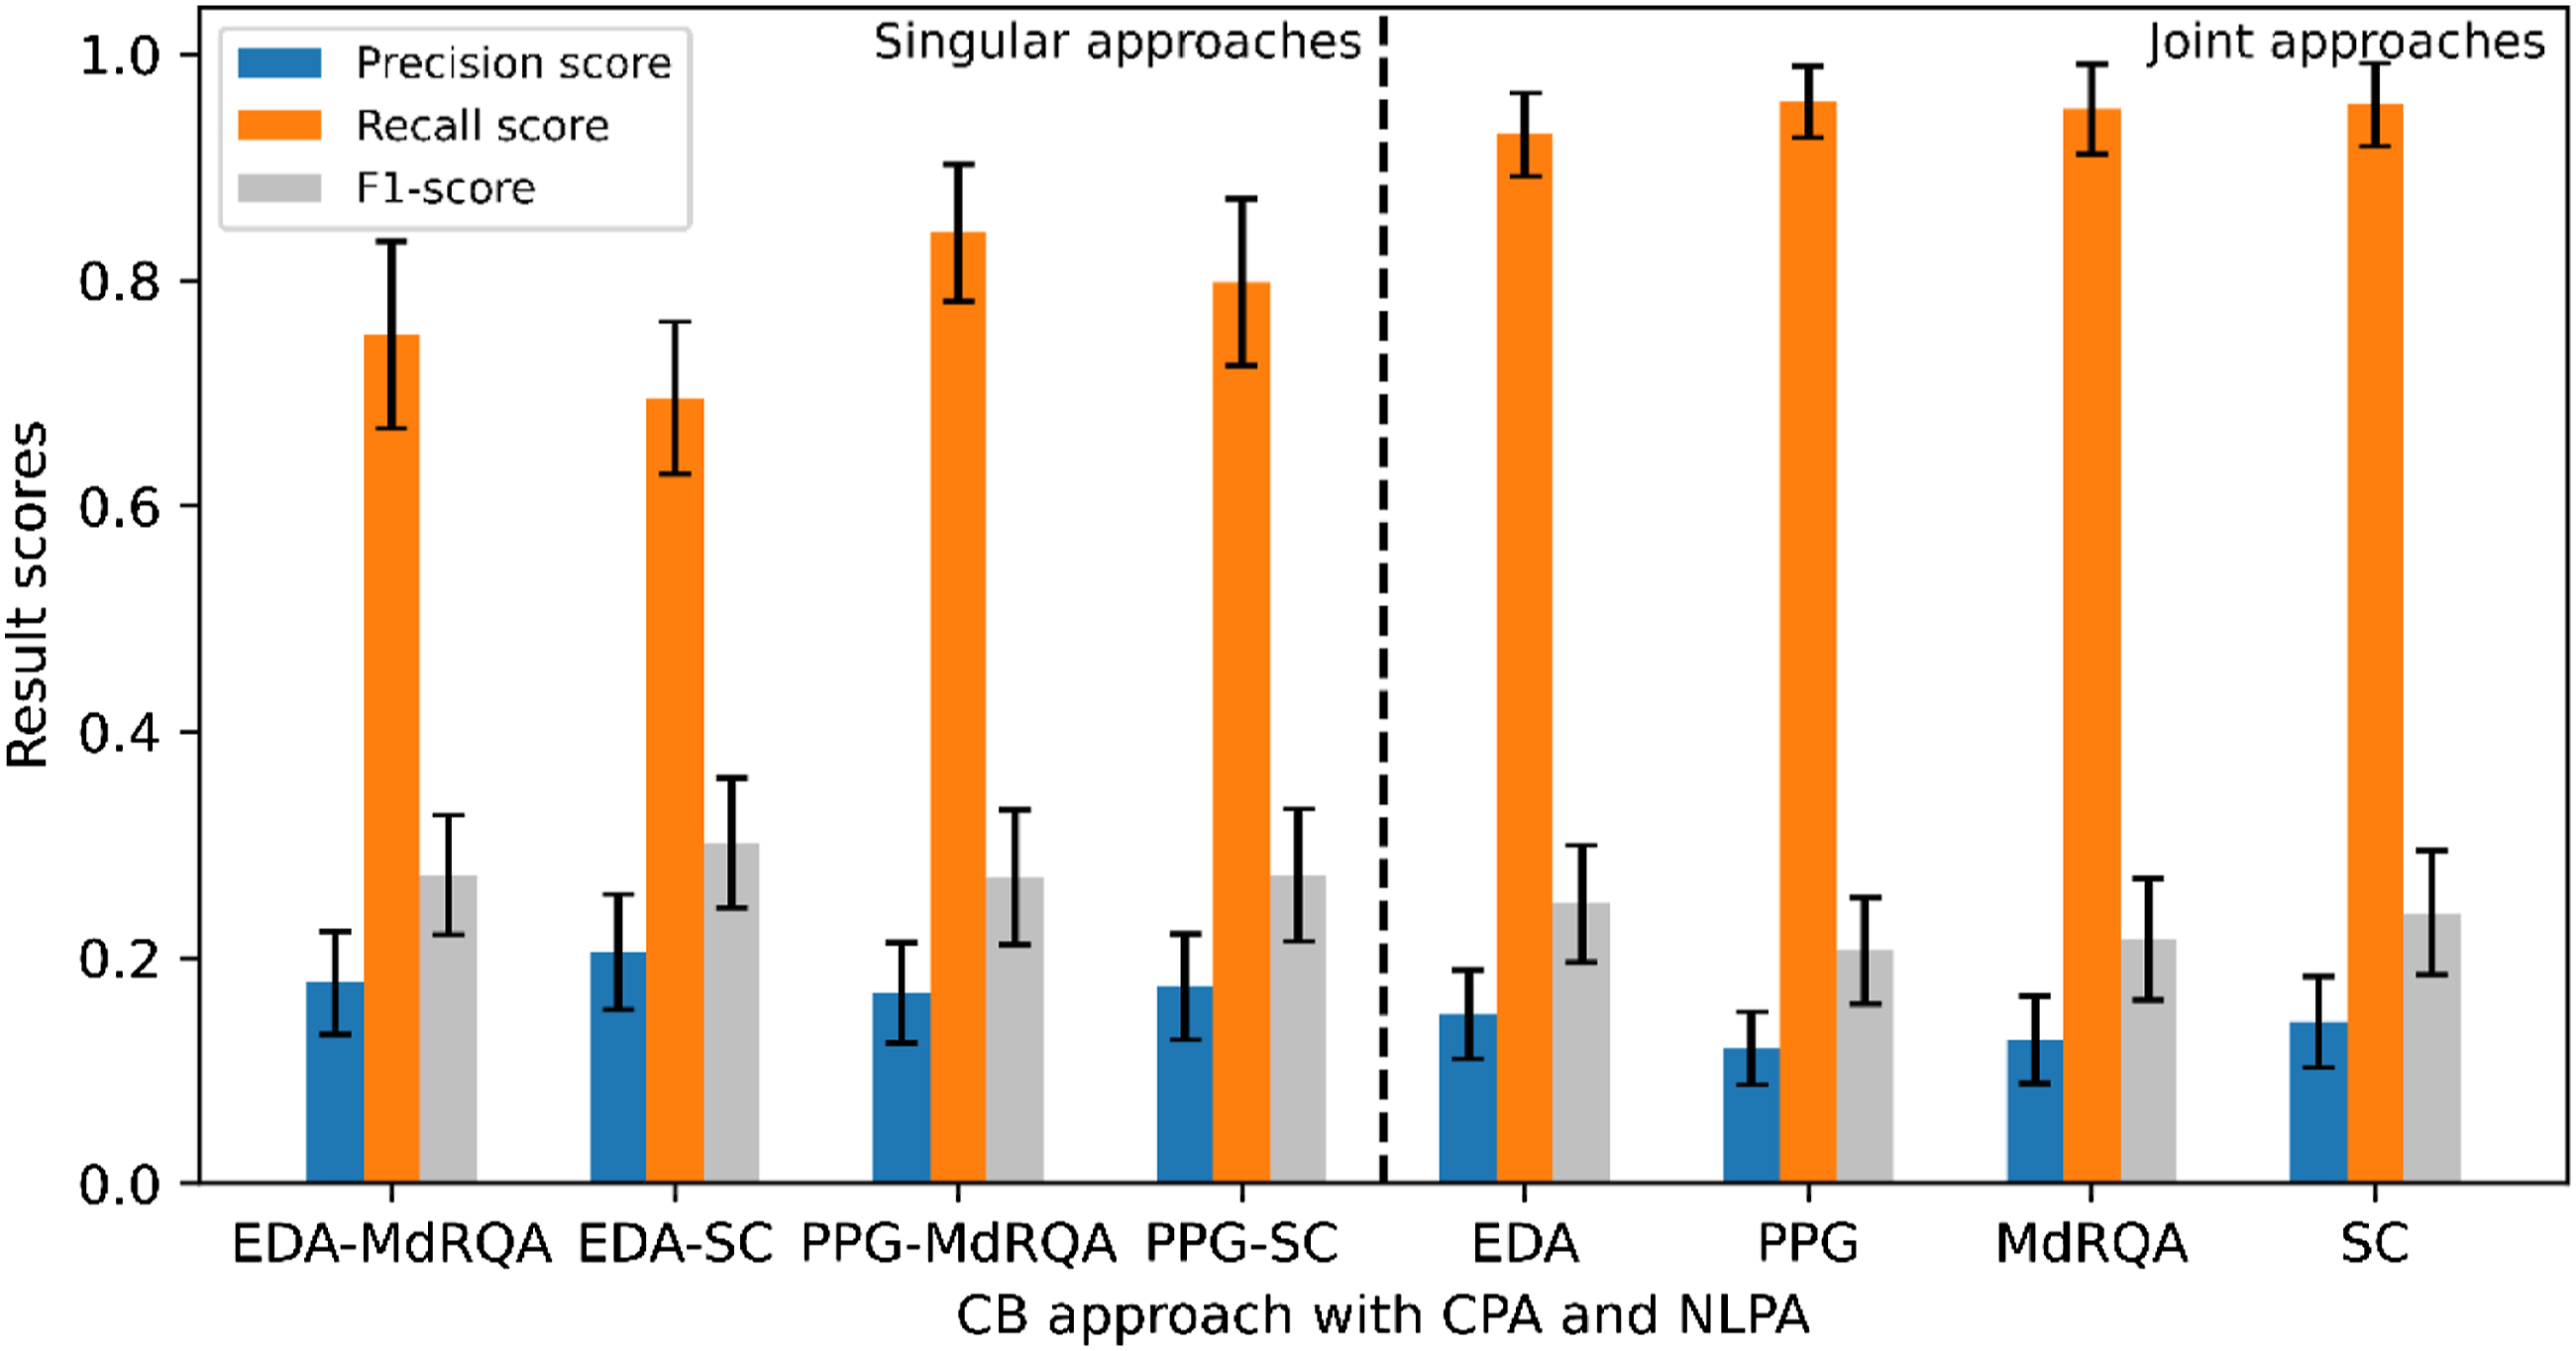
Comparisons Between Transition Detection Methods
An additional comparison was made between results of different transition detection methods. As can be seen in Table 2, recall following the combination of transition detection methods was always higher than recall of the individual methods. Differences in recall, comparing the second highest recall scores to the combination recall scores row wise, were .04 at a minimum, and .36 at a maximum. Precision scores following CPA were higher than those following NLPA or the combination, except for the SC approach, where the NLPA-based precision score was highest. Differences in precision, comparing the highest and second highest scores row wise, were at a minimum .01, and at a maximum .11. Lastly, F1-scores based on CPA results were always higher than those based on NLPA or combination results. Comparing the CPA-based scores to the second highest scores row wise, differences in F1-scores were at a minimum .01, and at a maximum .10.
Discussion
In the current paper, we presented multiple approaches to computationally identify team CBs using multiple physiological signals, measures of coordination, and transition detection methods. The identification of CBs provides possibilities for monitoring team coordination processes during crisis situations and offering real-time feedback in case of diminished performance. To examine the extent to which the applied approaches can robustly identify CBs, we compared computationally identified CBs against manually identified CBs (RQ1). Subsequently, CB identification approaches were compared to each other, to assess which of our computational approaches can most successfully identify manually identified CBs (RQ2).
Overall, our findings suggest that manually identified CBs can be identified computationally through the applied approaches. However, the results differ per approach. Recall scores of at most .96 were achieved with the PPG (including CBs based on PPG-MdRQA and PPG-SC) and SC approaches (including CBs based on PPG-SC and EDA-SC). This means that, of all the CBs that were identified manually, 96% was also identified computationally. Precision scores were found to be lower (≤ .29), suggesting a difficulty to distinguish between transitions in team coordination dynamics that indicate manually identified CBs and those that do not. Subsequently, F1-scores, which represent the balance between precision and recall, were also found to be low (≤ .36).
Our results also show that singular approaches (EDA-MdRQA, EDA-SC, PPG-MdRQA, PPG-SC) are in any case outperformed by joint approaches (EDA, PPG, MdRQA, SC) in terms of recall. This suggests that adding an extra source of information, whether that is an additional physiological signal or measure of coordination, helps capturing team CBs that the other signal or measure does not capture. For EDA and PPG, this means that the signals underlying team coordination dynamics responded differently throughout the experimental game task, resulting in different transition points, and ultimately identifying different CBs that the other signal could not capture. Nevertheless, both physiological signals were able to capture team CBs. Similarly, each coordination measure was found to capture different manually identified CBs. More specifically, with the SC, team coordination dynamics were quantified based on dyadic correlation coefficients from which a team-level synchrony metric was derived. The MdRQA quantified team coordination dynamics in terms of recurring patterns, that were obtained from all team members EDA or PPG signals. Thus, each coordination measure captured team coordination dynamics differently, and our results show that each measure resulted in identifying CBs which the other was not able to identify.
A final comparison was drawn between recall results from different transition detection methods. Our findings show that recall based on the joint CBs from CPA and NLPA was always higher than recall of those methods applied individually. As each method detects transitions differently, these results provide a deeper insight into the nature of transitions in team coordination dynamics. Both probability-based (using CPA) and prediction error-based (using NLPA) transition detection methods are able to capture transitions that indicate a team CB. However, each individual method captures CBs that the other method cannot. This means that the transitions indicating team CBs are not solely probability-based, or prediction error-based, but a mix of both.
Thus, our results indicate that the computational identification of CBs should involve a combination of signals (EDA and PPG) or measures of coordination (MdRQA and SC), and both probability and prediction error-based detection methods. These results were obtained by conducting a methodological comparison of novel computational CB identification approaches against manually identified CBs. Consequently, our research deepens the theoretical and methodological knowledge on the computational identification of team CBs, and contributes to the development of robust approaches to identifying team CBs. The development of these approaches is crucial to deepening our knowledge of team processes that both underly effective team adaptive performance as well as those that indicate ineffective breakdowns of team coordination. In turn, the approaches and research presented here contribute to the enablement of team performance support in responding to and mitigating negative consequences of crisis situations.
Limitations
There are several limitations to our research, including uncontrollable events and methodological shortcomings. First, due to restrictions caused by Covid-19 pandemic, experimenters were not allowed to apply the wearables and participants were instructed to put on the devices themselves. This could have potentially affected the adequate placement of the EDA and PPG sensors. Additionally, in some cases, data quality was compromised by shifting electrodes caused by hand or head movements required during the task. Next, considering that data collection for the current study was a part of the larger project, applying data criteria for our study resulted in a smaller (though still sufficient) sample than expected.
Another limitation involves the timing and duration of our analyses. To provide useful feedback to teams, identification of team CBs should take place in near real time. While many aspects of our code are suitable for real-time analysis (e.g., windowing techniques for coordination measures), our code partially depends on the complete physiological signals for the computation of the radius parameter for MdRQA, the penalty parameter for CPA, and the threshold for a RMSE value to be identified as a CB (now set at two standard deviations above the mean RMSE). Still, our research can be used as a base for computational CB identification in real time.
A final limitation is that we mainly focused on recall in order to establish a computational approach that can robustly identify team CBs. While our findings present high recall scores (up to .96), the precision (between .12 and .29) and F1-scores (between .26 and .31) were found to be considerably lower. This means that points are being identified by these methods that are not identified by our raters as coordination breakdowns. One explanation for our results can be that though transitions in team coordination dynamics can indicate team CBs, they can also reflect other aspects of teamwork. For example, responses to events that occur during the collaborative game task (e.g., responding to an enemy attack after calm game environment exploration) could be reflected in signals underlying team coordination dynamics. Previous research by Gorman et al. (2016) suggests that transitions between phases within a collaborative task are also reflected in team coordination dynamics (based on both neural signals and communication). Additionally, changes in affective states (e.g., negative to positive emotional state) could underly transitions in coordination dynamics. Dynamics derived from both EDA and PPG signals, that were also utilized for our analysis, have been found to relate to affective behavior (Gordon et al., 2021). Moreover, many other examples of phase transitions that occur through the interaction of individuals have been found throughout subdisciplines of psychology, such as transitions between phases of collaborative problem solving (Hirokawa, 1983; Wiltshire et al., 2018) and romantic relationships (Gottman, 2014). It is possible that such transitions could also be captured within signals underlying team coordination dynamics. As our approach does not differentiate between transitions that indicate CBs and those that do not, precision scores are affected. This, in turn, affects F1-scores, that represent the balance between recall and precision.
Lessons Learned and Future Research
Lastly, we discuss the lessons learned after having conducted the current research, and we provide suggestions on how to address them in future team studies. The main lesson learned is that it is imperative to gain a deeper insight into the patterns in team coordination dynamics that relate to team CBs. As our results show that a transition in the dynamics can indicate a CB, but can also indicate other events, we need additional research into the specifics of different transition patterns. Future research can address this by, for example, focusing on distinctive features (e.g., autocorrelation, average change, entropy) from windows of dynamics data that occur around a manually identified CB, and windows of team coordination dynamics that are not related to those CBs. To assess the extent to which these features can help distinguish between CBs and other events, a forecasting algorithm can be applied to team coordination dynamics data capturing team CBs. Such information on distinctive features should be incorporated into future computational approaches, to improve the precision of team CB identification.
In addition, future studies could conduct an extensive parameter sweep to fine-tune the parameters involved in the computational approach. Fine-tuning can improve the modeling of physiological signals into team coordination dynamics, and the detection of transitions therein, which in turn affects the precision, recall, and F1-scores. Besides optimizing parameters, the computational approaches could also be extended to include different signals (e.g., movement, neural signals), measures of coordination (e.g., windowed cross-correlation, windowed multiscale synchrony), and transition identification measures (e.g., entropy-based, distributional change-based). We have learned from our results that each of these components of the computational CB identification approaches emphasizes a different aspect of team coordination dynamics, and could therefore identify CBs differently. Extension of these approaches provides more insight into what specific combination of components is beneficial for computational CB identification.
Furthermore, besides looking at the physiological data, future research can examine the audiovisual recordings for team events, processes, and states that occur around incorrectly identified CBs. An analysis of those team occurrences would enable a deeper examination of what underlies transitions that are not annotated as manually identified CBs. Such knowledge would increase our understanding of why transitions occurred, and whether these would be related to team CBs but were not captured in our codebook for manual CB annotation. Alternatively, it informs us of what other team events, processes, and states are indicated with transitions in coordination dynamics.
As we found that precision following our computational approaches is lacking, it limits the feasibility of using these approaches to anticipate team CBs and provide feedback in real-life crisis situations. What reasonable precision is in this specific context is not yet thoroughly studied. In other domains, reasonable precision scores have been indicated to be above 75% in the context of self-harm rate detection (de Wet et al., 2013), or above 80% in the context of cyber-attack detection (Shirazi et al., 2016). Still, feasibility of result metric scores is dependent on the application domain. Future research should assess the usability of computational CB identification approaches at different performance levels during crises specifically. Computational approaches with precision that is too low might lead to incorrect CB indications, possibly causing a disruption or distraction that disturbs team functioning and performance. On the other hand, if the computational approaches become too restrictive, transitions indicating team CBs might be overlooked, and an opportunity to provide support will be missed. This in turn will also affect recall (i.e., the extent to which the computational approaches can identify all manually identified CBs). Thus, future research should investigate the balance between feasible precision and recall values in various crisis settings to facilitate teams with the most useful support.
Another lesson learned involves the collaborative game task chosen for data collection. In some cases, participants needed time to get familiar with the game and their controls, especially those less experienced in gaming. To familiarize participants with the game, we provided an introduction in the form of a PowerPoint, as well as a short test to assess their knowledge. Given that the experiment took 1.5 hours, and we did not want to add more time, we opted to not have a practice game session for the participants. This resulted in the observation of team CBs that were caused by unfamiliarity with the game. For example, a participant responsible for steering might hit an object while trying to figure out the steering controls. This event might go unaddressed (e.g., because others are also familiarizing themselves with the controls) and negatively affect the ship health. While both components for an event to be manually identified as a CB might be present, this is not an event that we are interested in. In such cases, the root cause for the team’s dysfunction is the game unfamiliarity, instead of ineffective coordination. To take this into account, the annotators were instructed to not annotate such events, particularly within the first Five minutes of the game. However, to prevent these events, future studies might add a more practical introduction to the experimental task.
The lesson learned from utilizing wearable devices to collect physiological signals is twofold. First, they might be perceived as obtrusive (e.g., might restrict movement of fingers as the sensors are placed on the index and ring fingers). Second, artifacts can be introduced by slight movement of the wearables’ sensors. Future research should develop ways to measure physiological signals more robustly while not restricting team members. This is especially important for support of teams working in crisis situations, who need to be able to move freely. Moreover, researchers need to take into consideration specific requirements, for example, an interdiction for medical personnel to wear anything on their hands and lower arms. A possible solution would be using a wearable on the upper arm, ankle, or chest depending on what signals need to be collected and what solution proves to be the least obtrusive.
With our findings, we aim to inform other researchers of the lessons we have learned through the conduction of the current study. Moreover, with these lessons and the overall findings of our study, we intend to positively impact decisions in future research within the scope of team research and team coordination dynamics. Thus, through our findings, our research can be foundational to future studies focusing on team coordination dynamics, and more specifically, to developing a more precise approach to computationally identifying CBs.
Conclusion
In this paper, we assessed computational approaches to identify when teams transition from functioning effectively to ineffectively. Such transitions occur as a result of unsuccessful coordination, and indicate team CBs. To this end, we highlighted three components that are crucial to identifying CBs: 1) the signals that underly team coordination breakdowns, 2) the measures that quantify team coordination dynamics, and 3) the methods that detect transitions within those dynamics. Each component was incorporated into our computational CB identification approaches, which were applied to physiological EDA and PPG data from four-person teams involved in a stressful collaborative game task. Comparisons to manually identified CBs showed that up to 96% could be identified computationally although these results come at the expense of precision. A further investigation into different results between computational approaches suggested that different physiological signals, measures of coordination, and transition detection methods capture team CBs differently, and that combinations of those components may yield more favorable results in terms of recall. Thus, our research contributes to the development of robust approaches to identifying team CBs. Examining such approaches contributes to our knowledge of team processes that underly effective team adaptive performance as well as those that indicate ineffective breakdowns of team coordination. Consequently, the current research advances our knowledge toward ultimately enabling the support of team performance in responding to and mitigating negative consequences of crisis situations.
Footnotes
Acknowledgments
We kindly thank Vilde Øvreeide and Bas Verkennis for their contributions to the manual identification of team coordination breakdowns, Ruben Sikkema for his contributions to the pre-processing of the physiological signals, and Chris Emmery for the helpful discussions regarding our data analysis.
Declaration of Conflicting Interests
The author(s) declared no potential conflicts of interest with respect to the research, authorship, and/or publication of this article.
Funding
The author(s) disclosed receipt of the following financial support for the research, authorship, and/or publication of this article: This work was supported by the Dutch Research Council (NWO) as part of the NWO Complexity and Creative Industry: Grip on Transitions and Resilience program (645.003.003).
Appendix
Kyana van Eijndhoven is a PhD researcher at the Department of Cognitive Science and Artificial Intelligence, Tilburg University. She focuses on combining theory and practice of cognitive science and complexity science to examine team coordination and anticipate its breakdowns during crisis situations.
Dr Travis J. Wiltshire is an Assistant Professor in the Department of Cognitive Science and Artificial Intelligence, Tilburg University. He has contributed over 40 scholarly works and is (co)principal-investigator on research projects totaling €1.5 million. He completed his PhD in Modeling & Simulation from the University of Central Florida in 2015.
Elwira Hałgas is a PhD researcher at the Industrial Engineering and Innovation Sciences department of the Eindhoven University of Technology. Her research focuses on translating team coordination dynamics calculated from various sources to viable measures of team functioning and performance to enable production of helpful and meaningful (real-time) feedback during crisis.
Dr Josette Gevers is an Associate Professor and Co-chair of the Human Performance Management group in the Department of Industrial Engineering and Innovation Sciences at Eindhoven University of Technology. Her research focuses on investigating the drivers of effective teamwork in dynamic, time-critical contexts, and developing workplace interventions to facilitate synergetic, innovative, and adaptive team performance. Her work has been supported through various industrial, national, and EU-grants and comprises over 50 published articles in refereed journals.