
Abstract
As automated and autonomous systems become more widely available, the ability to integrate them into environments seamlessly becomes more important. One cognitive construct that can predict the use, misuse, and disuse of automated and autonomous systems is trust that a user has in the system. The literature has explored not only the predictive nature of trust but also the ways in which it can be evaluated. As a result, various measures, such as physiological and behavioral measures, have been proposed as ways to evaluate trust in real-time. However, inherent differences in the measurement approaches (e.g., task dependencies and timescales) raise questions about whether the use of these approaches will converge upon each other. If they do, then the selection of any given proven approach to trust assessment may not matter. However, if they do not converge, it raises questions about the ability of these measures to assess trust equally and whether discrepancies are attributable to discriminant validity or other factors. The present study used various trust assessment techniques for passengers in a self-driving golf-cart. We find little to no convergence across measures, raising questions that need to be addressed in future research.
Remarkable advances have been made in self-driving vehicle technology in recent years. While these vehicles fall short of what names like “full self-driving” insinuate (i.e., they are not autonomous), their high level of automation makes it such that the human in the “driver’s seat” can be largely uninvolved. As these vehicles are used in increasingly complex environments, safe and appropriate use must be prioritized. One of the greatest predictors of the safe and appropriate use of a system is an understanding of the operator’s trust in that system (de Visser et al., 2020; Dzindolet et al., 2003, p. 200; Hancock et al., 2020; Wiczorek & Meyer, 2019). Trust is a complex, dynamic attitude that consists of initial learned, situational, and dispositional trust (Hoff & Bashir, 2015; Lee & See, 2004). It is not simply that greater levels of trust result in safer use of a system, but rather that appropriately calibrated trust is needed to ensure that users are not using the systems in a way that is unsafe.
Users who place a level of trust in the system which is warranted by the system’s actual capabilities (i.e., trustworthiness) are said to be calibrated in their trust (Estepp et al., 2018; Kraus et al., 2019). Miscalibrated users, on the other hand, can either overtrust or undertrust a system. Overtrust exists when one’s trust in the system exceeds what is warranted by the system’s actual capabilities (M. S. Cohen et al., 1997; Robinette et al., 2016). This overtrust can be pernicious in that users can become complacent and fail to provide appropriate supervisory control over the system (Merritt et al., 2019; Wickens et al., 2015), which can lead to degraded situation awareness, failure to detect system errors, and worse overall human–machine team performance (Manzey et al., 2012; Sebok & Wickens, 2017). Unsettling real-world examples of overtrust can be seen in images of drivers asleep behind the wheel of their vehicle while in self-driving mode.
Undertrust refers to instances wherein a user’s trust in a system is less than what the system’s capabilities warrant (de Visser et al., 2020; Kohn et al., 2018). Undertrust can result in failure to accept and adopt technology (Ghazizadeh et al., 2012; Matsuyama et al., 2021; Zhang et al., 2019) or disuse of a system after it has already been adopted (Dzindolet et al., 2003; Parasuraman & Riley, 1997). Distrust is similar to undertrust; however, the principal difference is that distrust can be warranted (Mirnig et al., 2016). In fact, research has suggested that trust and distrust represent two distinct constructs (Kramer, 1999; Lewicki et al., 1998; Tenhundfeld et al., 2019).
Under-reliance, be it caused by undertrust or distrust, can present an issue if it is presupposed that the system would otherwise provide a performance or safety benefit to the user. As such, product designers and developers may have an interest in working to repair trust through approaches like having the system apologize (Fratczak et al., 2021; Kim & Song, 2021), increasing its transparency (Hussein et al., 2020; Yang et al., 2017), or even reassuring the user of its (the system’s) proficiency (Israelsen & Ahmed, 2019). However, these repair approaches can only be implemented if distrust or undertrust can be detected. What is more, the efficacy of these approaches may be tied to the actual timing of the repair strategy (Robinette et al., 2015). It, therefore, seems obvious that to promote highly efficacious human-automation interaction, systems need the ability to detect, in real-time, changes in a user’s trust.
Humans are inherently good at inferring intention, state of mind, and emotions from both verbal and non-verbal social cues. While a system could routinely ask its user to evaluate his/her trust, there are potential methodological concerns (e.g., anchoring and response bias) in addition to concerns over whether such a redundant request may be seen as an annoying behavior which could impact the use of such a system (Segura et al., 2012). In an effort to develop a real-time assessment of trust, research has examined the utility of physiological and behavioral measures such as heart rate (Khalid et al., 2016; Mitkidis et al., 2015; Perello-March et al., 2022; Tolston et al., 2018), galvanic skin response (Akash et al., 2018; Chen et al., 2015), interventions (Tenhundfeld et al., 2019, 2020), monitoring behaviors (Bahner et al., 2008; Bailey & Scerbo, 2007; Banks et al., 2018; Endsley, 2017), and eye-tracking (Hergeth et al., 2015; Lu & Sarter, 2019).
It is worth noting that these trust assessment techniques are not directly assessing trust but rather believed correlate with trust. In the case of behavioral measures such as interventions, monitoring behaviors, and eye tracking, each is believed to be downstream of trust such that low trust may lead to more frequent or earlier interventions and monitoring/verification behaviors (Bahner et al., 2008; Tenhundfeld et al., 2019, 2020; Walker et al., 2018). The idea is that someone who trusts the vehicle less will be more likely to take over control in the face of uncertainty or will be more directly engaged in the primary task of supervisory control. Similarly, physiological monitoring of things like heart rate, heart rate variability, and galvanic skin response are all believed to be directly influenced through trust by a couple of mechanisms. The first mechanism wherein changes in trust would be expected in the physiological data is through stress. Each of these aforementioned variables has been shown to be a part of the human stress response (Arsalan & Majid, 2021; Nickel & Nachreiner, 2003; Thayer et al., 2012). The belief is that as trust decreases, the stress associated with reliance on an automated system increases, and as such, so too do the physiological indicators of stress. The second proposed mechanism would be through an individual’s workload. In cases of high trust, there is more likely to be complacency and the failure to monitor the automated system (Bahner et al., 2008; Merritt et al., 2019; Parasuraman & Manzey, 2010; Sauer et al., 2016). On the other hand, in instances where there is low trust in a system, the individual will likely be more engaged in the supervisory control tasks required of him/her, resulting in higher task load and subsequent increases in workload. This increase in workload correlates with changes to physiological metrics like heart rate and heart rate variability (Eilebrecht et al., 2012; Hoover et al., 2012). However, it is important to note that there are other factors that may affect user workload, beyond trust. One’s assessment of task demands may impact his/her workload. For example, one may believe that driving becomes a secondary task for which the automation is in control, and thus the “driver” can engage in his/her self-assigned primary task of engaging in conversation, reading, texting, etc. Alternatively, a driver may stay engaged in maintaining supervisory control over the automation, if he/she believes it to be the primary task, in a way that increases workload regardless of his/her trust in the system (Warm et al., 2008). This introduces noise into the potential interpretation of physiological assessments of trust if workload is the main factor that contributes to the changes in physiological response.
As detailed above, the use of non-subjective measures can be useful for the real-time and real-world assessment of trust. However, beyond the fact that much of the research highlighting the use of physiological and behavioral measures relies on theoretical assumptions as to why they are measures of trust, the reality is that there are very few studies that compare these approaches within a single study. This comparative analysis is important for several reasons.
First, physiological and behavioral measures of trust assess along different timescales than subjective assessments. Whereas subjective assessments are most frequently given following a manipulation, physiological and behavioral data are collected throughout the duration of an interaction. While the data are not always evaluated through dynamic modeling techniques (Tenhundfeld et al., 2022), even aggregated data (e.g., number of interventions and average heart rate) are still an aggregation of data collected over the course of the interaction, rather than following the interaction. This different timescale poses a potential theoretical problem as trust is not a monolithic construct.
Trust itself can be broken into categories of dispositional, situational, initial learned, and dynamic learned (Hoff & Bashir, 2015). These trust factors play a different role in reliance strategies such that dispositional, situational, and initial learned trust all affect one’s initial reliance, whereas the use of a system informs one’s dynamic learned trust which subsequently impacts their reliance thereafter. As such, trust assessment approaches that evaluate trust over the course of an experiment, as you see with behavioral and physiological measures, may be capturing one’s shift from this pre-interaction trust to his/her during-/post-interaction trust. Because of this, complex interactions between, for example, dispositional trust and system performance may yield results that would otherwise not be captured by a post-interaction subjective questionnaire. So whereas measures could converge, there would also be discriminant validity to each measure such that they are unlikely to yield the same results because of the unique variance they are explaining (Campbell & Fiske, 1959). What is more, aggregated data may obfuscate actual shifts in user trust as the shifts in trust may occur following a series of interactions, which then get averaged with pre-shift trust (thereby dampening the effect).
For these reasons, it is imperative that comparative analyses be done on the different approaches to trust assessment. If we are to accept that the measurements used are all assessing trust, it is critical to understand how results may vary as a function of the measurement approach. Because trust is not a monolithic construct, the field must understand how different measurement approaches are mapping onto the multidimensionality of trust. The first step, however, is to see whether there are even disparate results as a function of measurement used. If there is a disagreement between the results from different measurements, this would suggest that each measure is uniquely assessing different facets of trust. It would therefore be necessary for future research to understand the nuance of how different timescales and measurement approaches map onto the multidimensionality of trust as a construct. Additionally, this would also warrant more careful consideration of the measurement approach used for any given study, as different measurement approaches may yield different results. If, on the other hand, there is complete alignment between results, regardless of the measurement technique used, this would suggest that researchers would be able to select whichever technique best fits within their paradigm as the results would be the same.
Ultimately, the understanding of how these different trust assessment techniques map onto trust is not only important for advancing theory but also for the application of trust assessment in the “real world.” Recently, there has been consideration about ways in which to assess trust in the “real world” (Dorton & Harper, 2022; Tenhundfeld et al., 2022). Part of this push has focused on ways in which to assess trust in non-intrusive ways that allow for naturalistic interactions between the human and automation (i.e., not simply relying on subjective assessments). This push makes it all the more imperative that there is a comprehensive understanding of the alignment between results which approach trust assessment differently.
For a comparative analysis to be successful, different assessment techniques must be collected within the same study. We have therefore run a study in which physiological, behavioral, and subjective self-report measures are used, to assess trust of participants interacting with an autonomous golf-cart. Some of the techniques we used have been routinely relied upon for trust assessment, such as subjective self-reports (Brown & Galster, 2004; Foroughi et al., 2021; Seet et al., 2022; Wojton et al., 2020), heart rate (Mitkidis et al., 2015; Tolston et al., 2018), and monitoring behaviors (Bailey & Scerbo, 2007; Ferraro et al., 2018; Tenhundfeld et al., 2019). However, we also selected measures that have been linked to trust through being measures of stress but have not had the same breadth of use in empirical studies, such as heart-rate variability (HRV) (Petersen et al., 2019) and displacement behaviors (Fratczak et al., 2021). Inclusion of these measures also allows for exploratory analyses to be run which can assess these proposed measures. This sort of exploratory analysis can serve to evaluate whether proposed approaches like HRV and displacement behaviors are in fact aligning with other measures of trust, even though they are less substantiated. If these measures do converge with more frequently used measures, they may represent additional, non-invasive, trust assessment techniques that could be used by practitioners (Tenhundfeld et al., 2022).
By using an autonomous golf-cart, we are able to assess trust in an ecologically valid way that may prove beneficial for researchers and practitioners alike (Tenhundfeld et al., 2022). The use of a self-driving golf cart is comparatively novel to the literature which has relied upon self-driving cars (de Visser et al., 2023; Dikmen & Burns, 2016; Endsley, 2017; Koskinen et al., 2019; Morando et al., 2020; Tenhundfeld et al., 2019; Tomzcak et al., 2019). However, this golf cart provides a real-world analogue to the experience of a car, while simultaneously giving the researchers greater control over vehicle behaviors and participant safety. While negligible, this golf cart also provides a degree of risk that is not found in a laboratory environment, that is believed necessary for the formulation of trust (Li et al., 2019), and, as such, is most likely to manifest differences in physiological and behavioral indicators of trust. If there is convergence across the measures used, this would suggest that the differing timescales inherent with various trust assessment approaches may not be relevant when considering which approach to use. Alternatively, if there is a lack of convergence across measures, this suggests there needs to be further exploration into the nature of trust assessment, and greater consideration should be paid to measures used when assessing trust.
Methods
Participants and Recruitment
A total of 27 participants were recruited at James Madison University (JMU) by faculty members associated with the project through recruitment emails to school Listserv and word of mouth. The call for participants stated, “the purpose of this study is to better understand how participants perceive trust and reliability in autonomous vehicles before and after riding in such a vehicle” and “… along with surveys and interview questions, we will assess what aspects of the ride were enjoyable and/or potentially stressful for you.” An a priori power analysis indicated that we needed 29 subjects in order to adequately power a study with an expected correlation coefficient of .5 which is the recommended minimum threshold for assessing convergent validity, although others advocate for a much higher correlation (Cheah et al., 2018). A total of 58 persons completed an “interest form” to schedule an initial meeting and experimental time with the investigators of which 27 of these persons attended the meeting and completed the study. The remaining participants never followed up to meet with the investigators. No one dropped out of the study after meeting with the investigator. At their initial meeting, the participants were advised regarding the research purpose, procedures, and safety protocols. The IRB consent form required several things to be listed regarding the features/safety of the vehicle: - “During the ride, a safety supervisor will be present in the back of the vehicle. The supervisor will be watching the vehicle’s path for any deviations or potential objects in its way. If something is observed, then a ‘kill switch’ will be manually thrown that will bring the vehicle to a halt within approximately 2 seconds. The vehicle will not resume until the supervisor throws the switch again.” - “The vehicle is programmed to operate at a slow rate approximately the speed of a brisk walk. It cannot be commanded to move faster in autonomous mode.” - “The vehicle is equipped with a 3D lidar system that can detect objects in front of the vehicle. It is programmed to stop in the event an object is in its path and resume once the object has been removed.” “The vehicle will only operate on known and pre-mapped paths on the JMU campus that have been previously tested by the research team.”
These meetings generally occurred in a faculty member’s office. Participants were not compensated. This study was approved by the IRB and followed ethical research guidelines.
Testbed
The JMU Autonomous Vehicle
1
(Figure 1) is a modified EZ-Go Golf Cart that has been adapted to autonomous navigation by controlling its electronic braking and throttle through custom-designed circuit boards and by utilizing an electric DC motor to automatically drive/turn the steering wheel. These electronic controls are governed by a custom Robot Operation System (ROS) program that utilizes as inputs a 3-D LiDAR for localization and obstacle detection, electronic sensors for steering column position, and user-selected destination from the GUI. For additional technical details on the project, please see El-Tawab, Sprague, and Mufti (2020); El-Tawab, Sprague, and Stewart, et al. (2020). Autonomous vehicle testbed.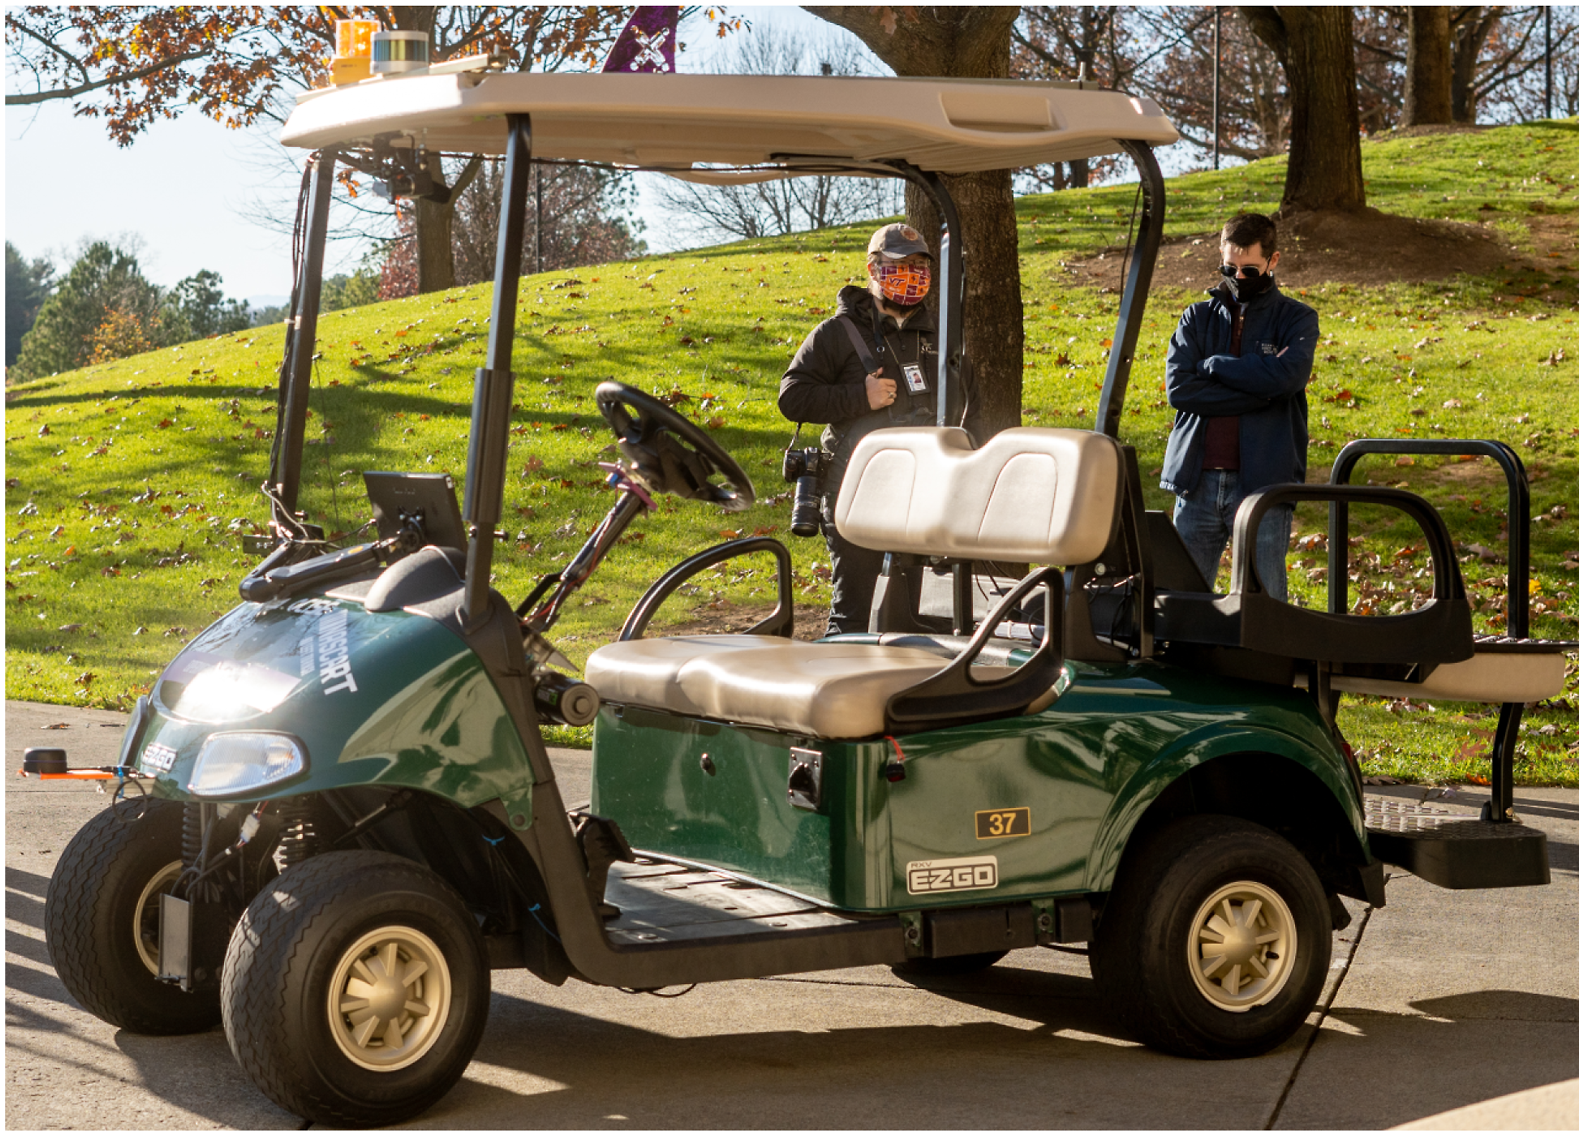
The autonomous vehicle operates on defined routes that are pre-mapped with a 3-D LiDAR with known locations as labeled in Figure 2. Given these locations, the vehicle can autonomously determine routes between destinations, execute those routes at a fixed speed, and stop for large obstacles such as people and vehicles. The vehicle operates at speeds of <3 MPH (4.8 KPH), which is generally the speed of a brisk walk. While the vehicle can stop for obstacles (vehicles, people, etc.), it cannot autonomously navigate around them. It will either wait until the obstacle has moved or the cart is manually driven around the obstacle. Graphical User Interface. Note. GUI for autonomous vehicle showing selectable destinations, vehicle position, destination, and pull-over controls.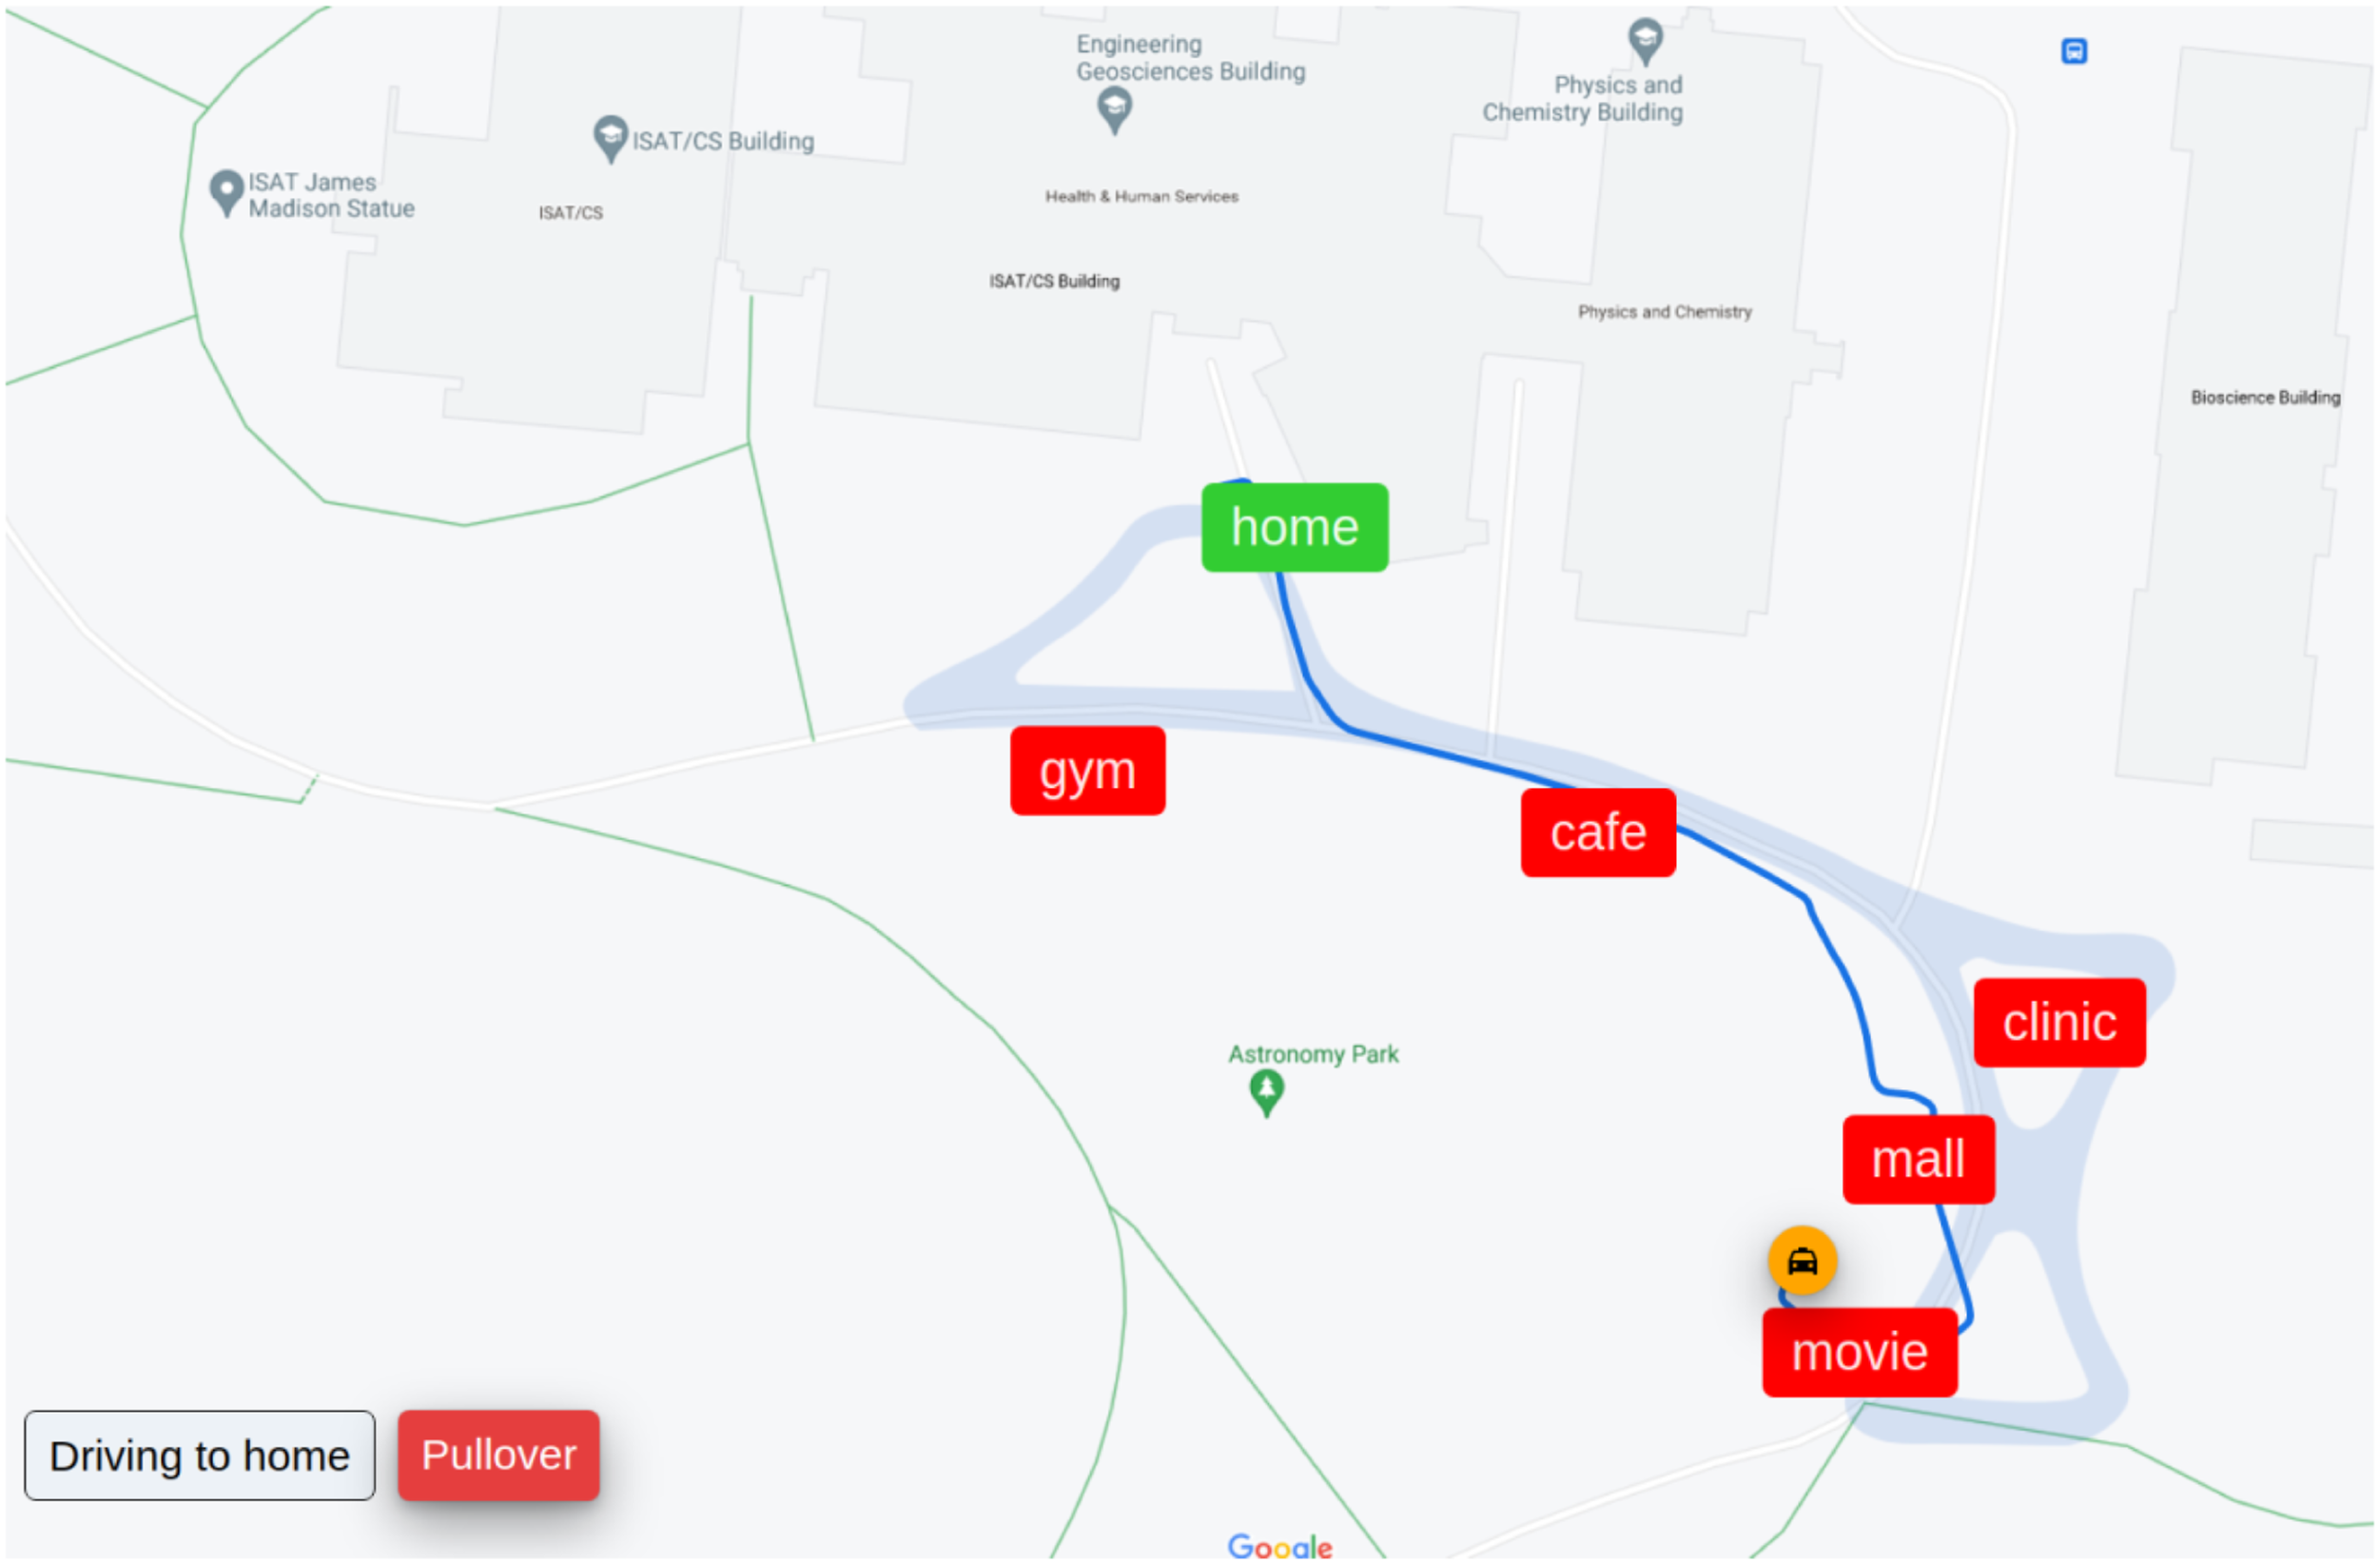
Test Procedures
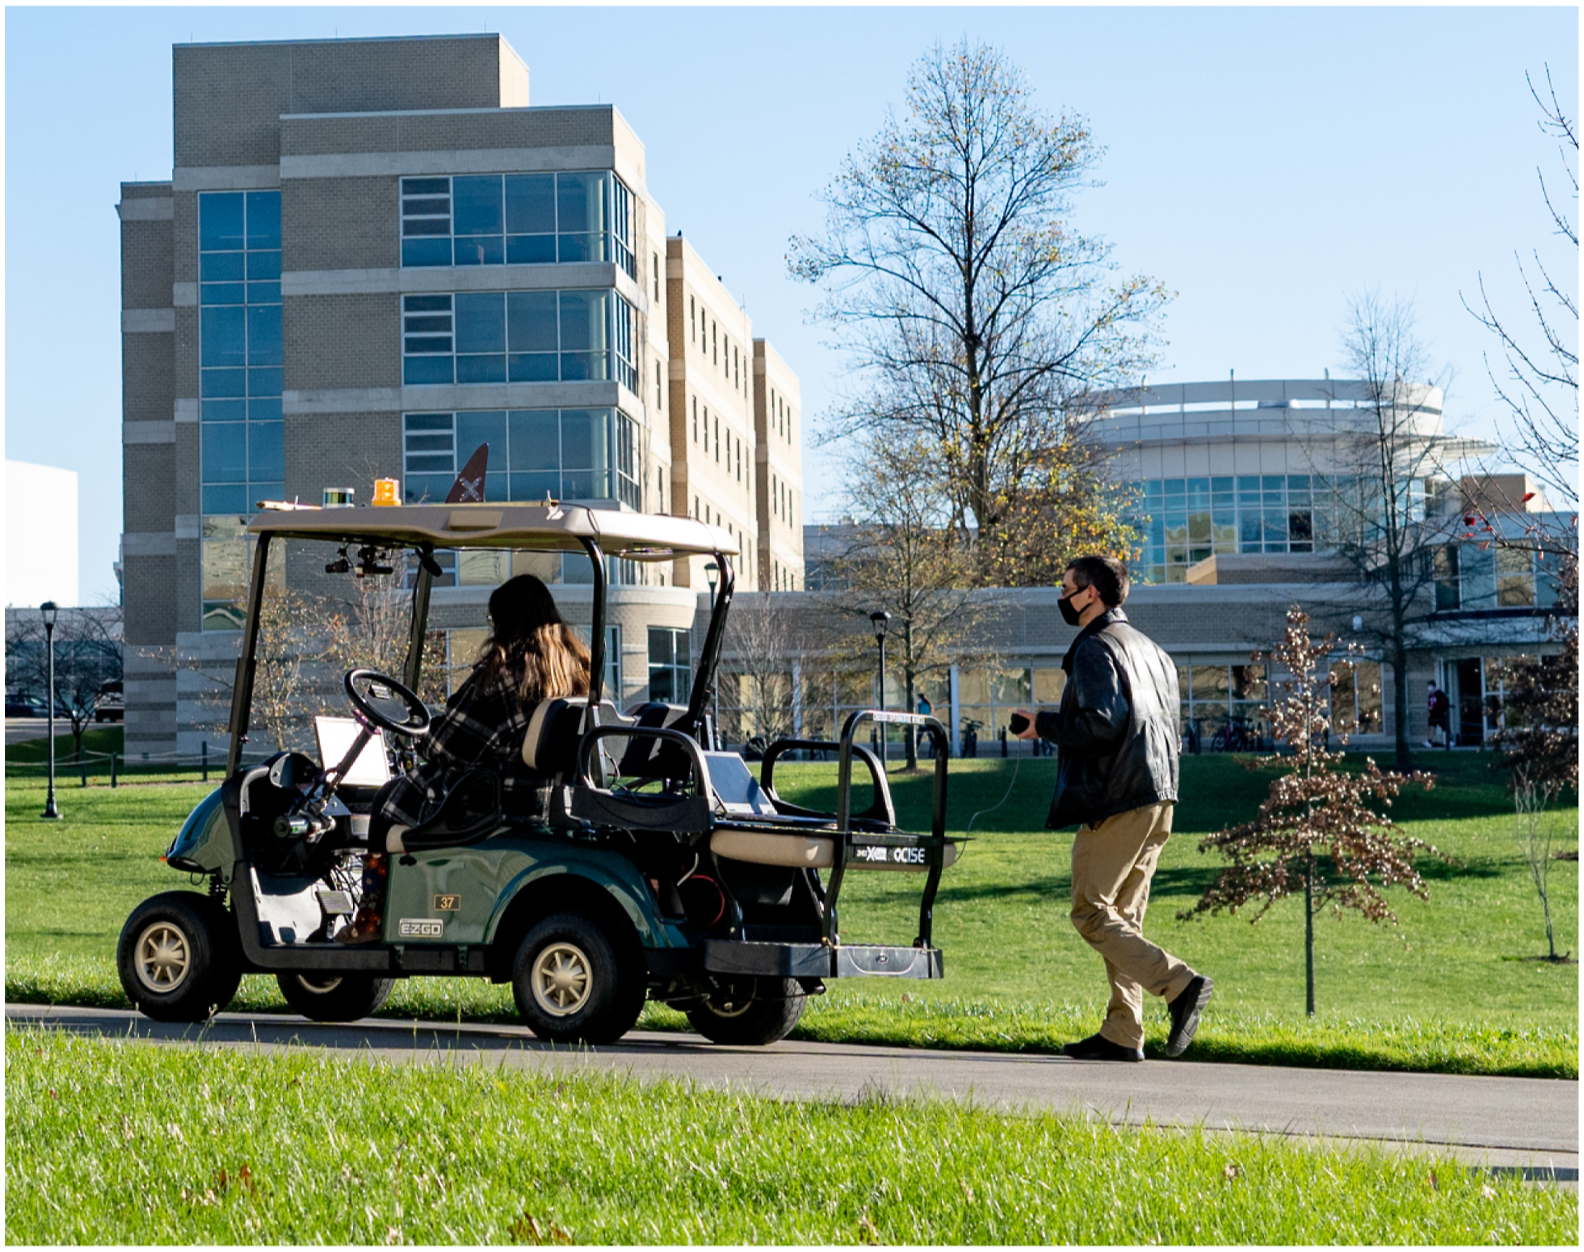
After receiving informed consent, the participants were provided the Automation Induced Complacency Potential – Revised survey (AICP-R) (Merritt et al., 2019) pre-ride and then a wearable device measuring heart rate (HR) and heart rate variability (HRV) (Maxim Integrated REFDES2103) (Figure 3) was placed on their wrist to monitor heart rate. The AICP-R consists of 10 questions evaluated using a 5-point Likert scale ranging from “strongly disagree” to “strongly agree.” Past research has suggested that HRV and HR may increase when a user’s workload is higher due to lower trust resulting in a greater degree of monitoring of the system (Khalid et al., 2016; Mitkidis et al., 2015; Perello-March et al., 2022; Tolston et al., 2018). Additionally, these measures are indications of stress which may be caused by decreased levels of trust (Reimer et al., 2010, 2016). After verifying the wearable device was operational, the faculty member and participant proceeded out of the building to the waiting autonomous vehicle that was in a courtyard outside the JMU EnGeo Building (Figure 4). Maxim Integrated Wearable Device. Note. The Maxim Integrated MAXREFDES103 was used to detect user HR and HRV throughout the experiment. Testbed environment in action. Note. The figure shows the JMU autonomous vehicle traveling on a walking path with a “safety officer” following to manually turn off the vehicle if needed.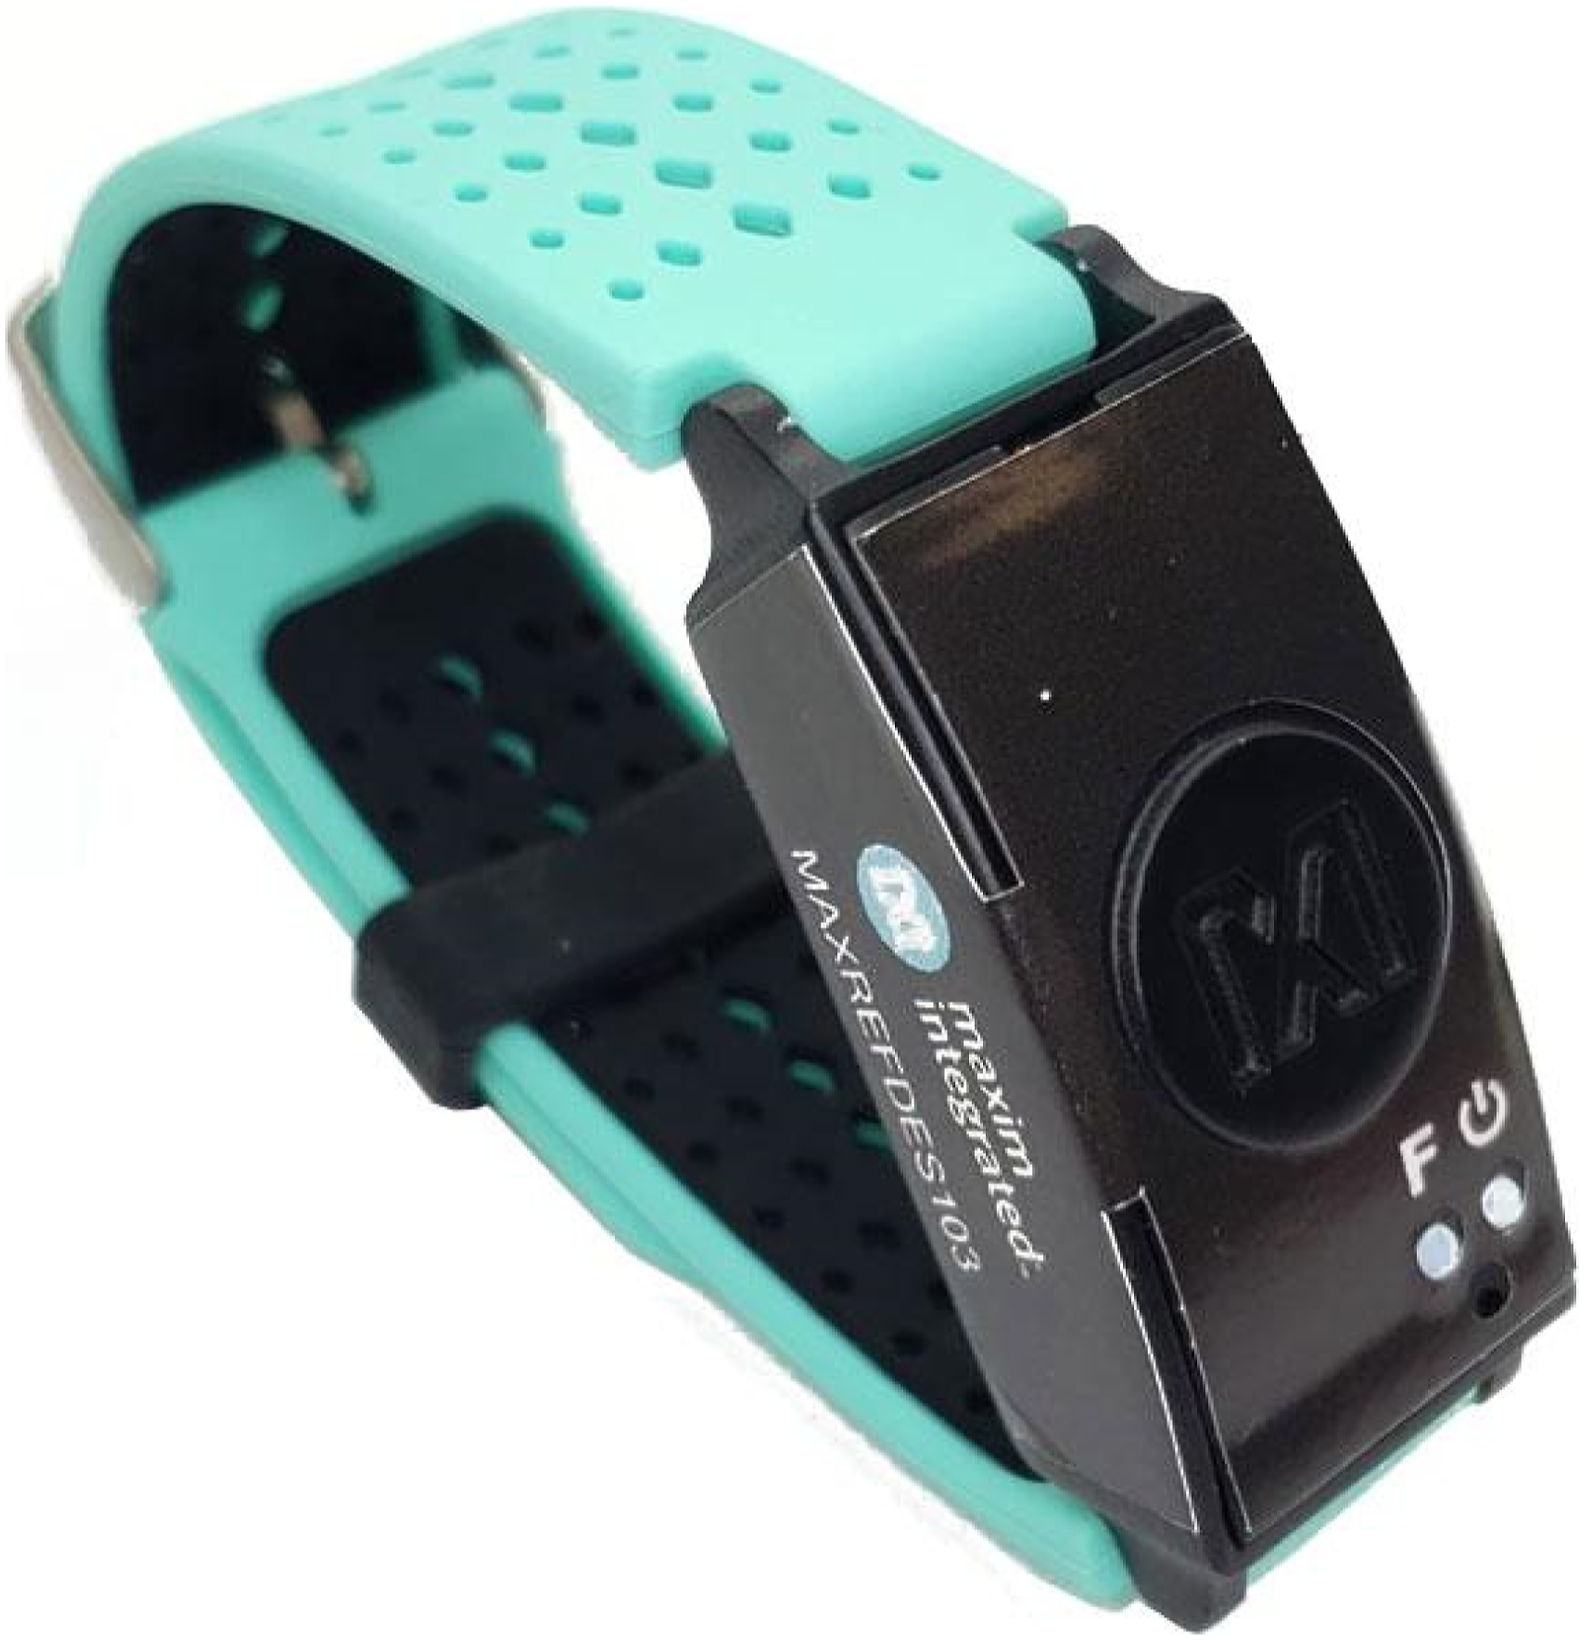
The participant was asked to sit in the passenger seat of the vehicle and then was provided a short demo on how to operate the graphical user interface (GUI). We chose to have the participant sit in the passenger seat for three reasons. First, we wanted participants to have ready access to the GUI which was installed on the passenger side of the vehicle. Secondly, for participant safety, we did not want them to be able to accidentally touch one of the pedals or get their hands caught in the steering wheel when it was being turned by the actuator. Finally, because we wanted the user’s interaction with the vehicle to mimic the experience of a fully autonomous vehicle, we did not want the participants to have input beyond telling the vehicle to pull over (mechanism discussed below). Through the interface, a passenger can select a destination around the JMU East Campus area that the vehicle will autonomously navigate to. Upon reaching the destination, the passenger can select a new location. Also, the participants were shown the presence of a “Pullover” button that would halt the vehicle en route. The destination labels utilized in the GUI were fictional in that the labels did not actually correspond to what was in that location (i.e., there was no movie theater at the destination labeled “movie”); however, they represented available stopping points around the larger campus area.
After completing the demonstration and answering any questions, the participants were instructed to complete two trips: one to a specific location on campus (often to “mall” as that one was farthest) and then return to the starting location “home,” and the second trip was a “free choice” that could be to any destination available that the participant desired along the known routes. Throughout the trips, one of the principal investigators walked behind the vehicle as a “safety officer” to manually stop the vehicle to prevent any unanticipated collisions, if needed (see Figure 4). While the passenger was told this person was present, they were instructed to envision themselves as riding alone in the vehicle, and in general, the “safety officer” would not interact with them unless necessary. This additional safety measure was necessary as the experimental times varied throughout the week and interactions among other students, facilities vehicles, and on-campus delivery robots were possible. While the autonomous vehicle has a forward-looking LiDAR, and can automatically stop in many situations, the researchers were unsure if it would act reliably given the many different testing procedures and additional precautions that were added. No collisions between the autonomous vehicle and other objects/vehicles occurred during the experimental period. Following their ride in the cart, participants were asked to fill out the Trust of Automated Systems Test (TOAST) (Wojton et al., 2020) and were asked a series of follow-up questions. The TOAST is assessed using a 7-point Likert scale ranging from “strongly disagree” to “strongly agree.” Participants were then thanked and sent on their way.
The Categories, and Subsequent Qualifying Events, Coded for.
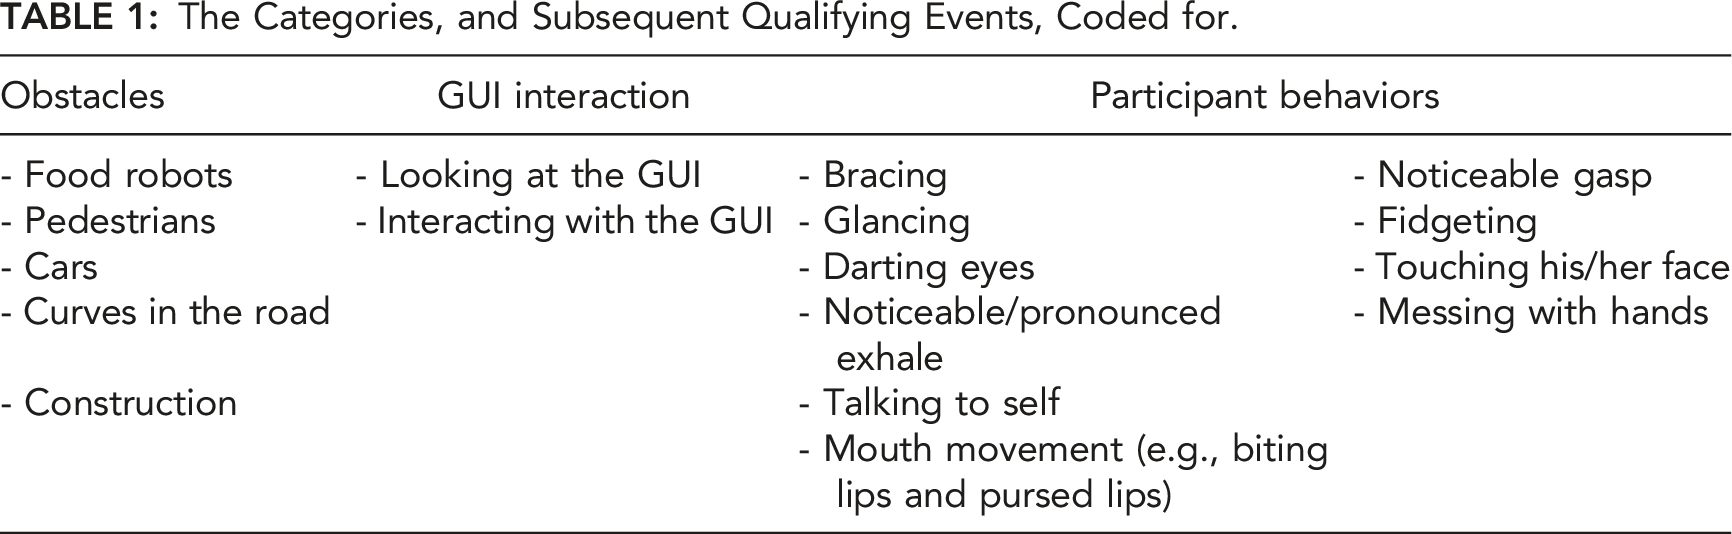
To evaluate the physiological responses to coded events, we looked at the percentage change for the measure of interest from 5 s before the coded event to 15 s after the coded event. This is in line with previous research which has relied upon a 20-s window following an event (Waytz et al., 2014). We chose to shift the 20-s window to include 5 s before the coded event to account for the fact that there were likely upcoming obstacles that the participants were able to see before they came into view of the outward-facing camera. Note that the outward-facing camera was to be used by the experimenters to record the trials so that they could code events that happened in the world, and the feed from the camera was not shown to the subjects.
Results
Statistical analyses and data cleaning were conducted in both Python and R (R Core Team, 2022) using functions from the tidyverse (Wickham et al., 2019), lme4 (Bates et al., 2015), emmeans (Lenth, 2022), effects (Fox & Weisberg, 2018), ggplot2 (Wickham, 2016), and base packages.
Physiological Assessment
Data Cleaning
Three subjects’ data were omitted from the analyses because they did not encounter any obstacles during their drives (N = 2) or was the only subject who encountered a car (N = 1). Data from the remaining 24 participants was subset into unique event windows, 50 s intervals of time 25 s before and after participants encountered an obstacle. Although the length of the event window was arbitrary, it gave us the opportunity to track changes in heart rate, measured in beats per minute (BPM), that occurred as participants saw, drove toward, encountered, and passed obstacles. We also captured the time during the session (in seconds since start) at which each event window was recorded. This allowed us to track co-occurring obstacles and control for drift in heart rate over time. Finally, we captured the type of event that participants encountered during each window: curves in the road, pedestrians, and food robots. All predictors were effect-coded, means-centered, and scaled prior to analysis.
Statistical Control for Individual Differences
AIC Comparisons of Possible Model Random-Effect Structures.
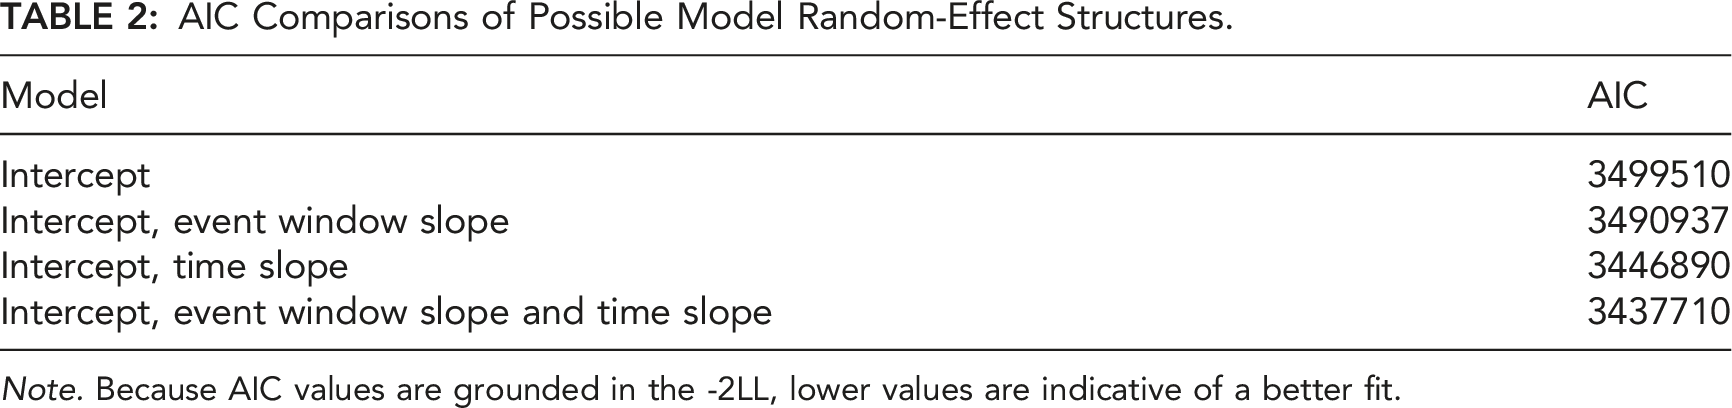
Note. Because AIC values are grounded in the -2LL, lower values are indicative of a better fit.
Modeling Heart Rate Response to Automation
Exploratory visualizations suggested that fluctuations in heart rate could be modeled using linear regression. Therefore, a full-factorial multilevel linear model was fitted to the data. This model included the event window, time, and event type predictors in the fixed-effect structure and the intercept, event window slope, and time slope in the random-effect structure.
Event Window Slopes for Heart Rate as a Function of Event Type.
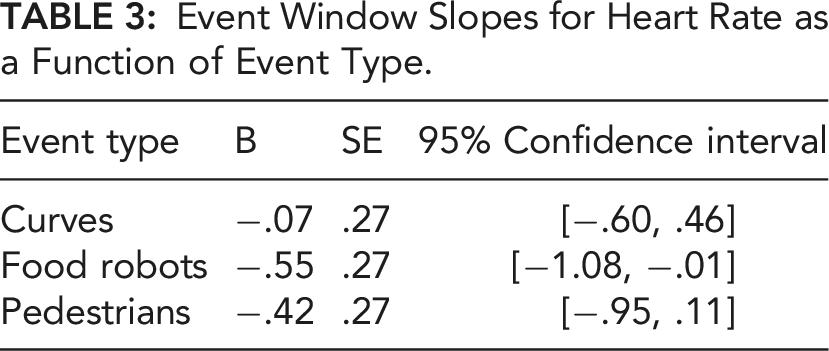
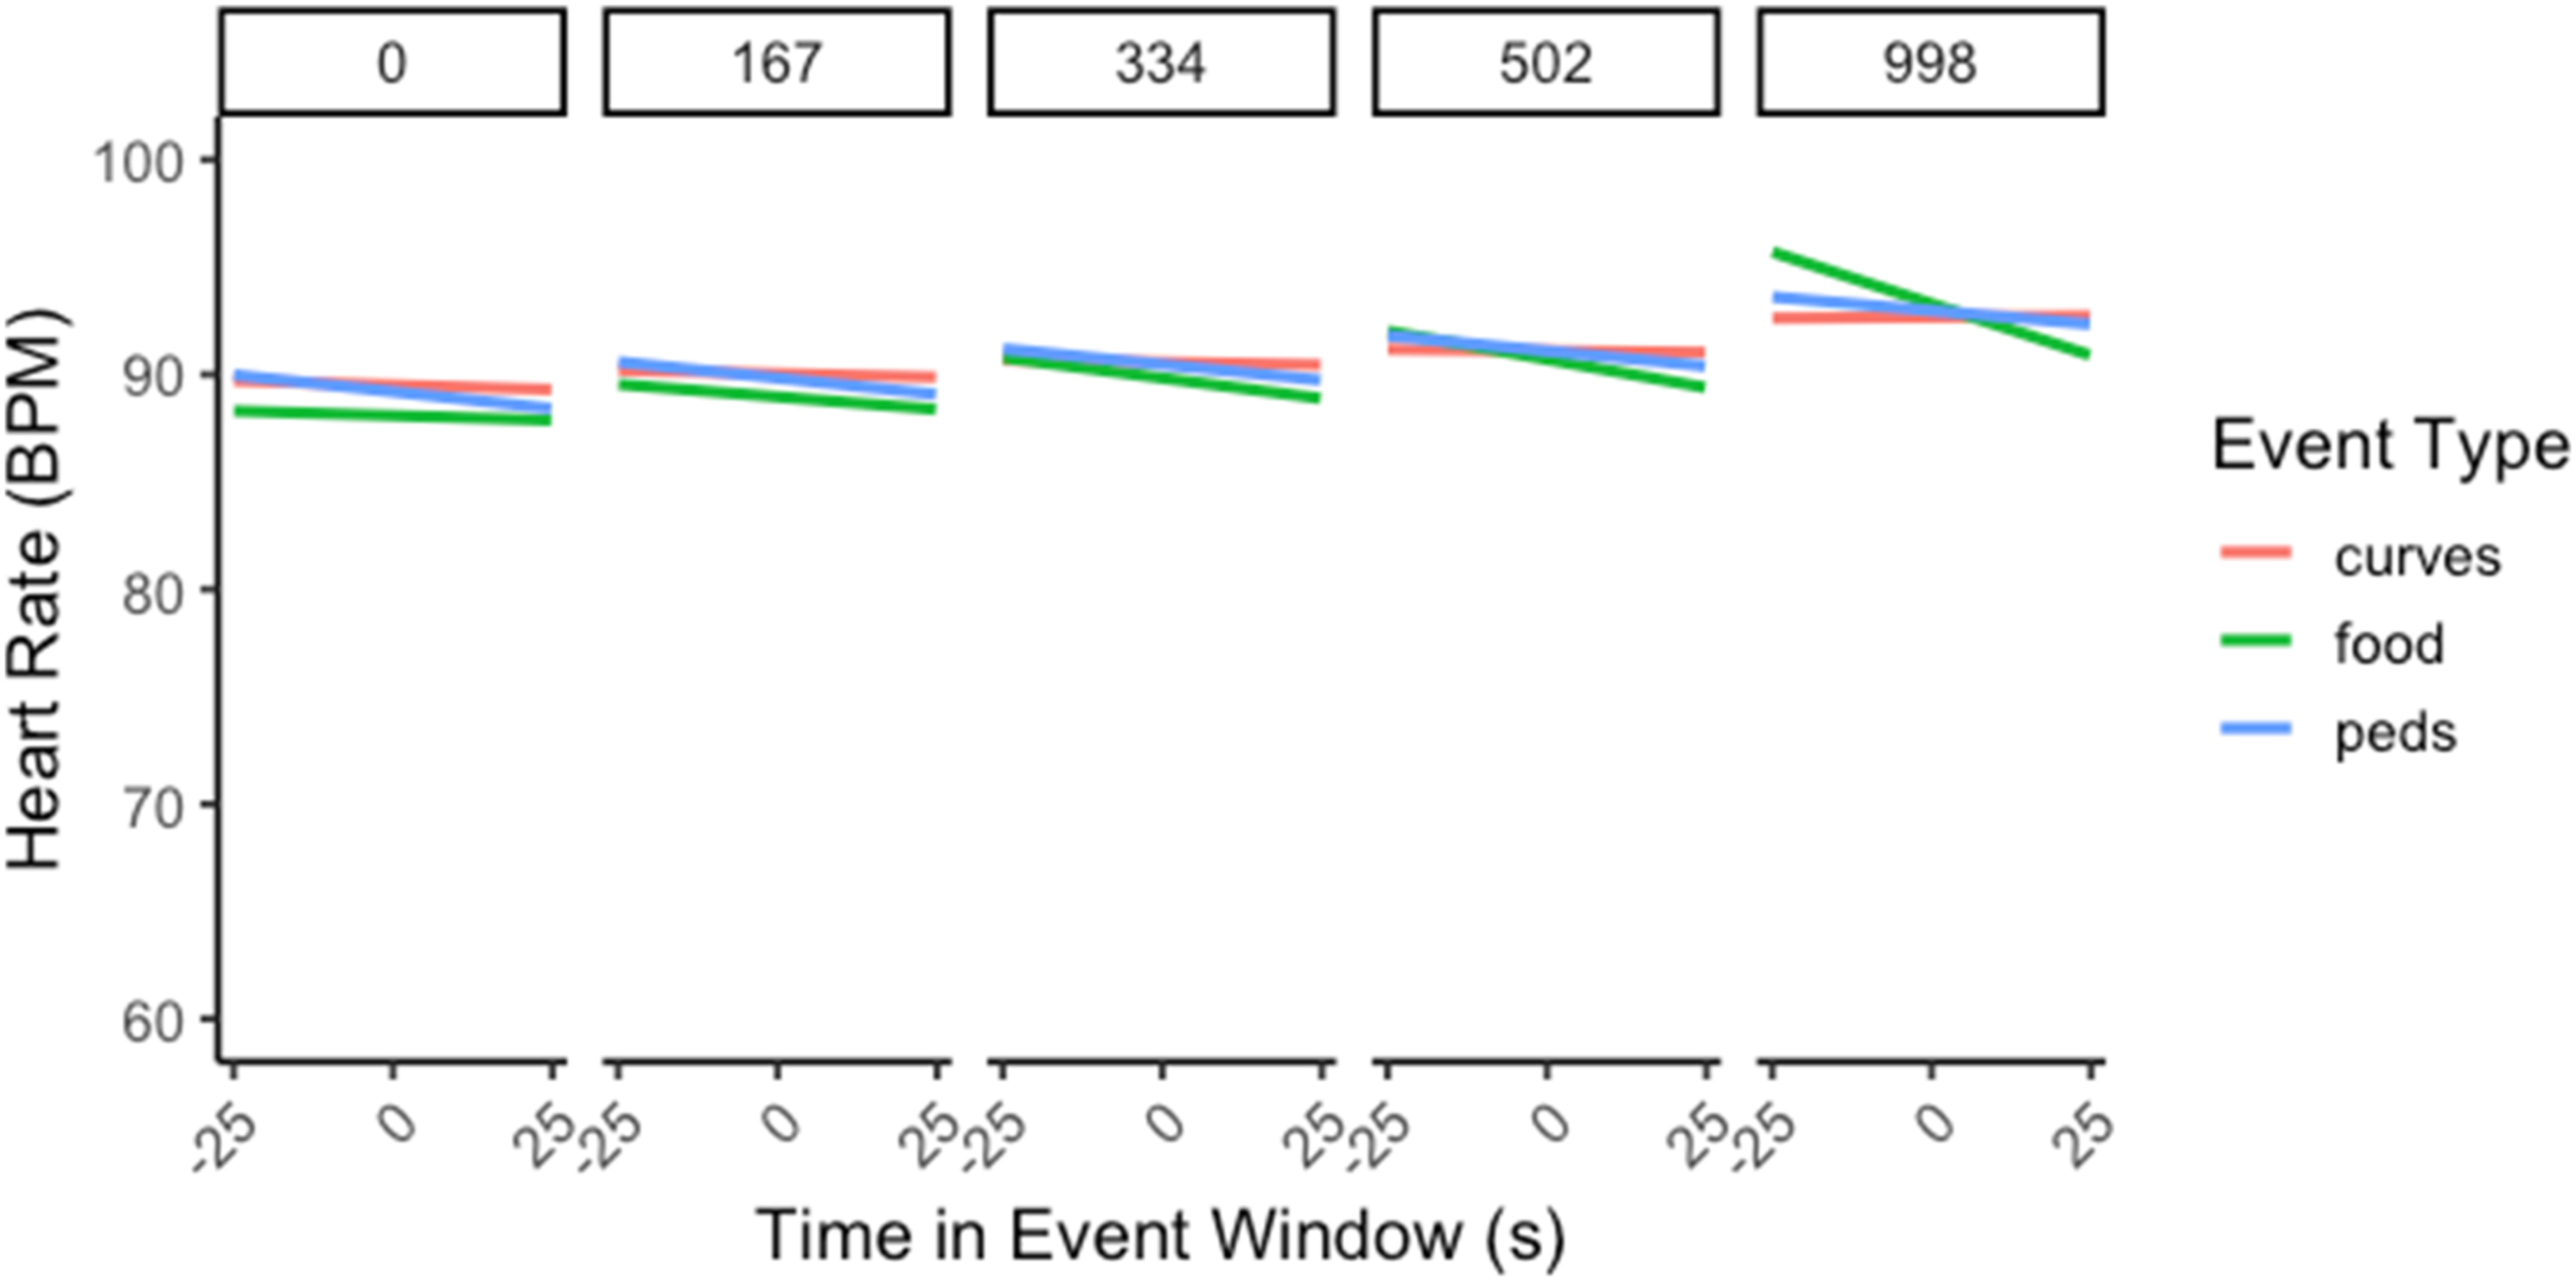
Heart rate during the event window changed as a function of event type over drive time. Note. Panels represent consecutive time slices (s) throughout the drive; narrow error ribbons represent
Subjective Assessments
The time between when the cart started driving and when it returned to the start/stop location took an average of 620.56 s (SD = 134.25). The participants reported an average overall score on the AICP-R of 3.552 (SD = .336), with averages for the alleviating workload (which assesses an individual’s attitudes toward delegating tasks to automation in order to alleviate workload) and monitoring (which assesses an individual’s attitudes toward the need to monitor automation when it is being used) subscales of 4.024 (SD = .543) and 3.080 (SD = .370), respectively. Higher scores indicate a greater propensity to delegate tasks to automation (alleviating workload subscale) and to not monitor it (monitoring subscale), both of which contribute to the complacency potential. There was an average of 17.080 (SD = 7.810, range: 3–34) obstacles coded for each participant during the participant’s time in the cart. Notably, the cart was perfect in avoiding all obstacles for every participant. Participants reported very high levels of trust in the system following their trial with an average score on the TOAST of 5.893 (SD = .466) (out of 7).
There was no significant correlation between complacency potential and participant trust, r (25) = .206, p = .324, and BF10 = .393. While we anticipated that the more experience a participant would have with the cart successfully avoiding obstacles would elevate trust (Tenhundfeld et al., 2019, 2020), the correlation between numbers of obstacles encountered and self-reported levels of trust, via the TOAST, was not significant, r (25) = −.337, p = .100, and BF10 = .896 (Figure 6). Scatterplots for self-reported trust. Note. Scatterplots between the number of obstacles encountered and self-reported trust (left) as well as AICP-R and self-reported trust (right). A solid line is regressed upon the data, and dashed lines represent the 95% CI for that regression line.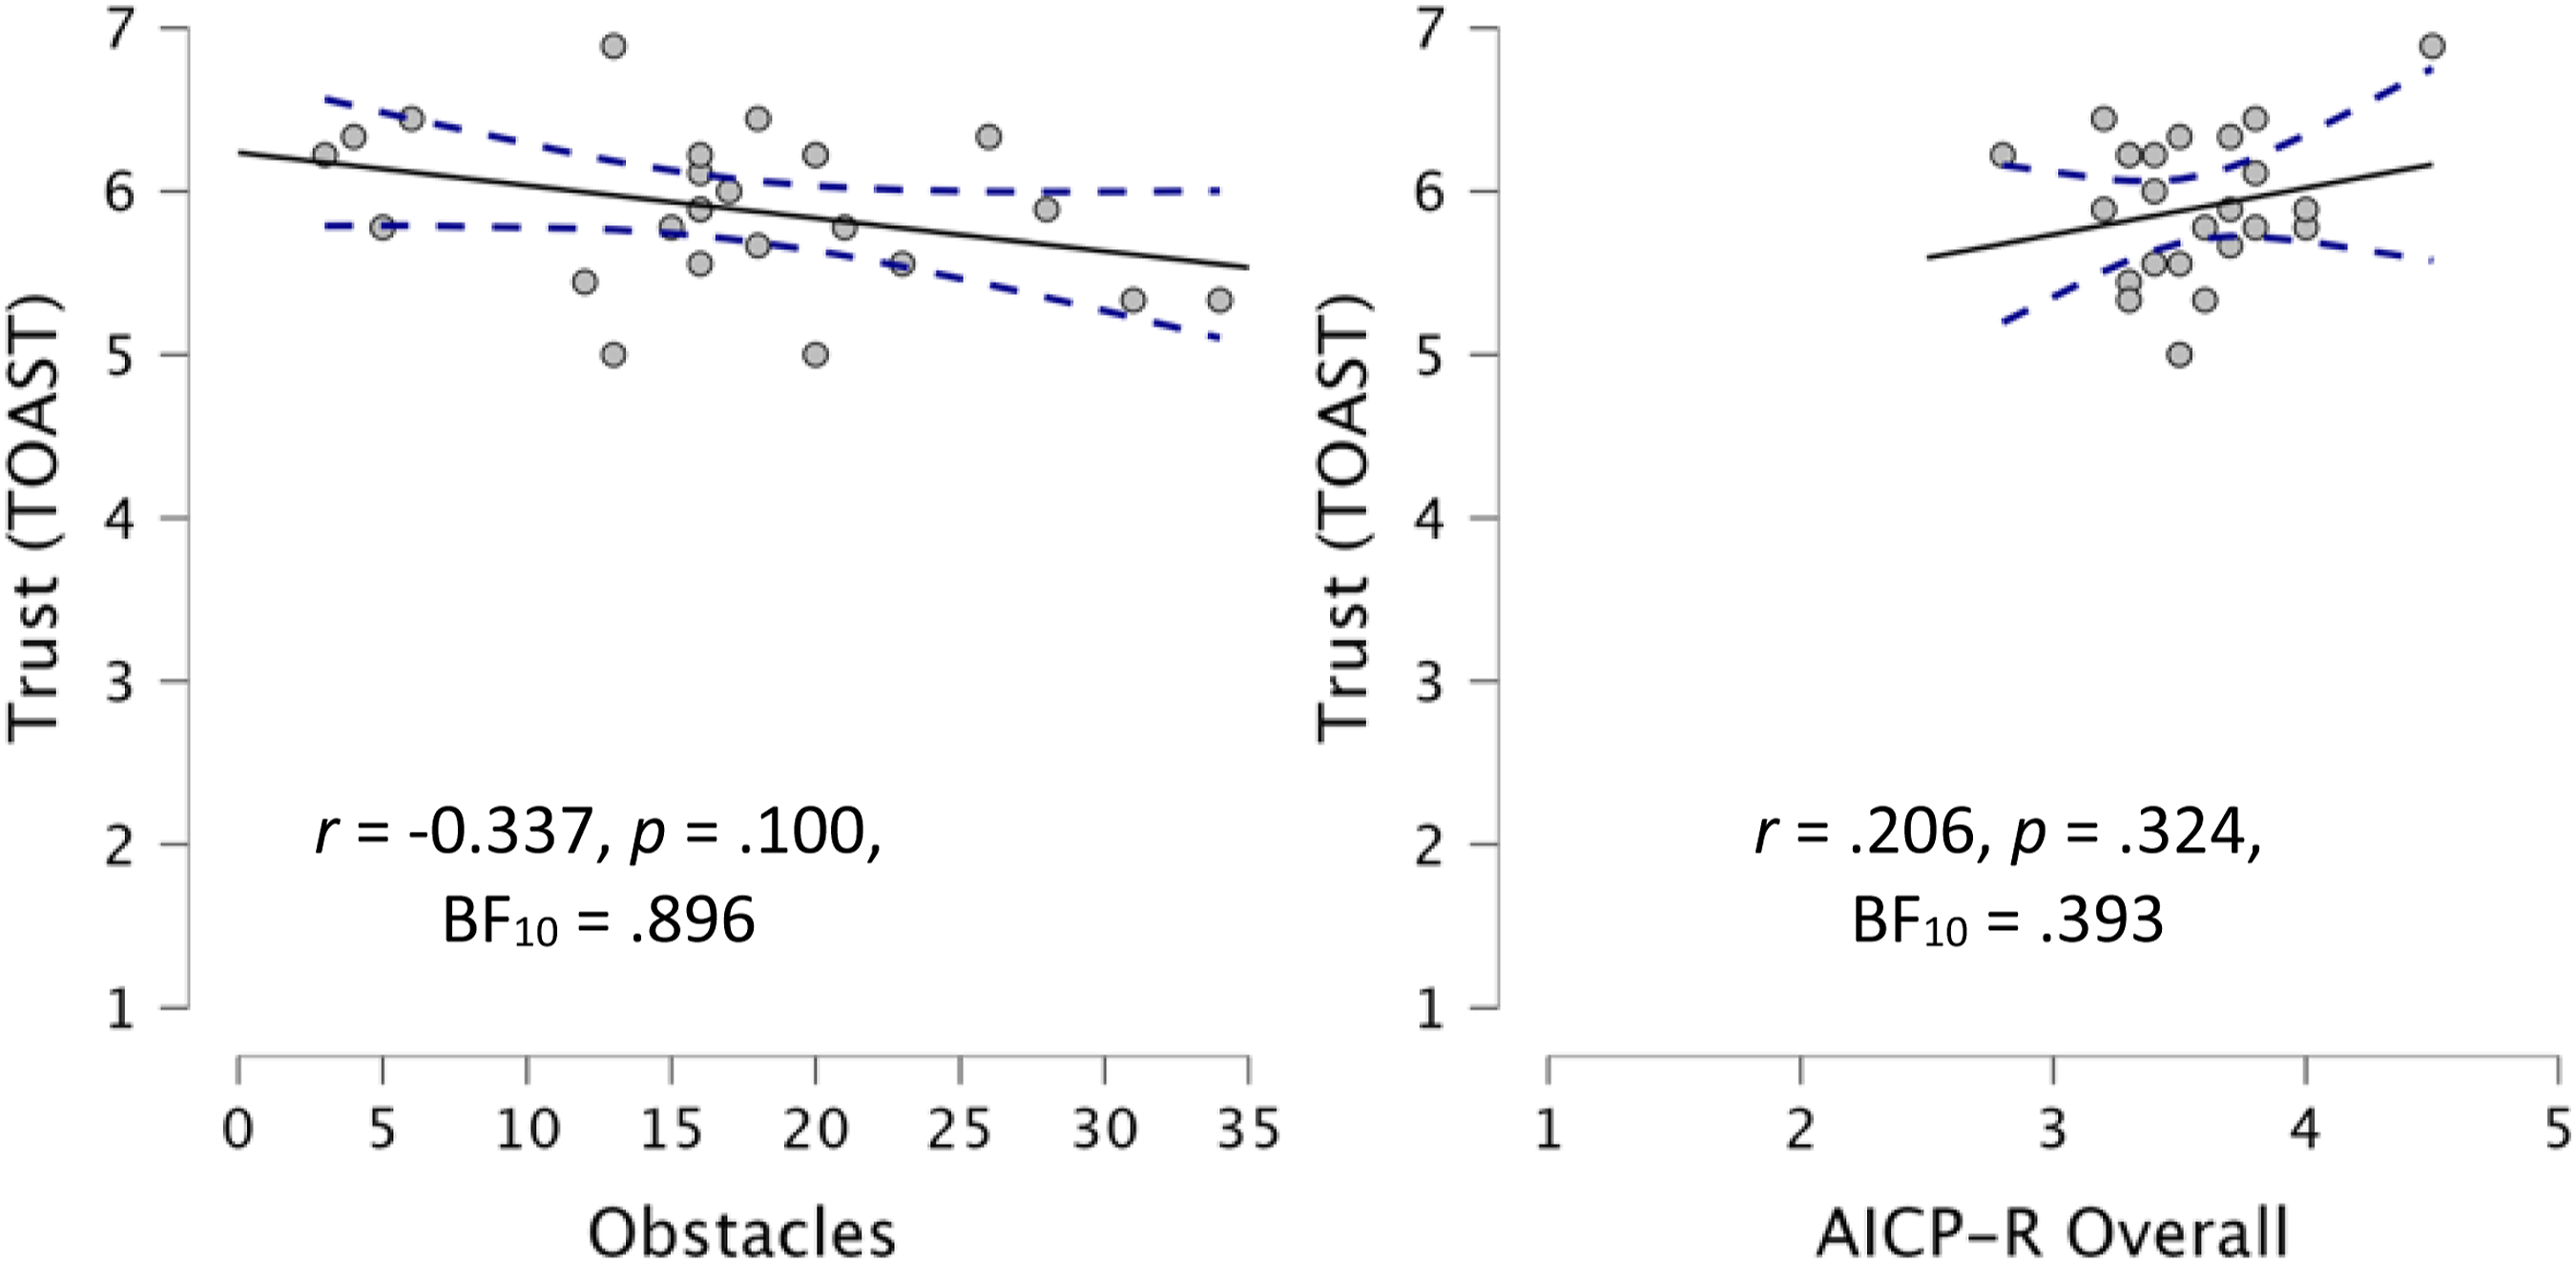
Behavioral Assessments
Given that the approach to obstacles represented a period of uncertainty for which participants would be more likely to display greater displacement behaviors as well as verification behaviors (glances at/interactions with the UI), we assessed whether there was in fact a relationship. There was a significant correlation between the number of obstacles coded and the number of behaviors coded, r (25) = .477, p = .016, and BF10 = 3.907, as well as between the number of obstacles coded and the number of glances at/interactions with the user interface (UI), r (25) = .543, p = .005, and BF10 = 10.234. Because it was possible that this positive correlation could be caused by a longer duration, such that trials that lasted longer had a potentially greater number of opportunities for obstacles, behaviors, and glances we evaluated whether this was the case. To evaluate this, we standardized the counts by averaging the counts and getting a “count per minute” measure for obstacles, behaviors, and glances at/interactions with the UI. Doing this yielded even stronger results; there was a significant correlation between the number of obstacles coded (per minute) and the number of behaviors coded (per minute), r (25) = .531, p = .006, and BF10 = 8.480, as well as between the number of obstacles coded and the number of glances at/interactions with the UI, r (25) = .618, p < .001, and BF10 = 41.788. There was no correlation between duration and obstacles, r (25) = .222, p = .287, and BF10 = .424, duration and number of behaviors, r (25) = .029, p = .892, and BF10 = .250, nor duration and glances at/interactions with the UI, r (25) = −.024, p = .908, and BF10 = .250.
Convergence Assessments
Given that the displacement behaviors and UI glances/interactions were thought to be indications of stress which manifests in the face of low trust, we assessed whether there was a relationship between the number of these behaviors and the subjective self-report of trust (Figure 7). There was no correlation between self-reported trust (TOAST) and the number of behaviors coded, r (25) = −.066, p = .754, and BF10 = .260, nor was there any correlation between self-reported trust and the number of glances at/interactions with the UI, r (25) = −.122, p = .561, and BF10 = .291. Given that both the number of behaviors and number of glances at/interactions with the UI are hypothesized to be negatively correlated with trust, we evaluated the convergence between these two measures and found a significant correlation, r (25) = .609, p = .001, and BF10 = 34.593. Scatterplots between behavioral and self-report measures used. Note. Scatterplots between the number of UI glances/interactions and monitoring subscale of AICP-R (top-left), self-reported trust (top-middle), number of obstacles encountered (top-right), and number of behaviors coded for (bottom-left), along with scatterplots between the number of behaviors coded for and self-reported trust (bottom-middle) and number of obstacles encountered (bottom-right). A solid line is regressed upon the data, and dashed lines represent the 95% CI for that regression line.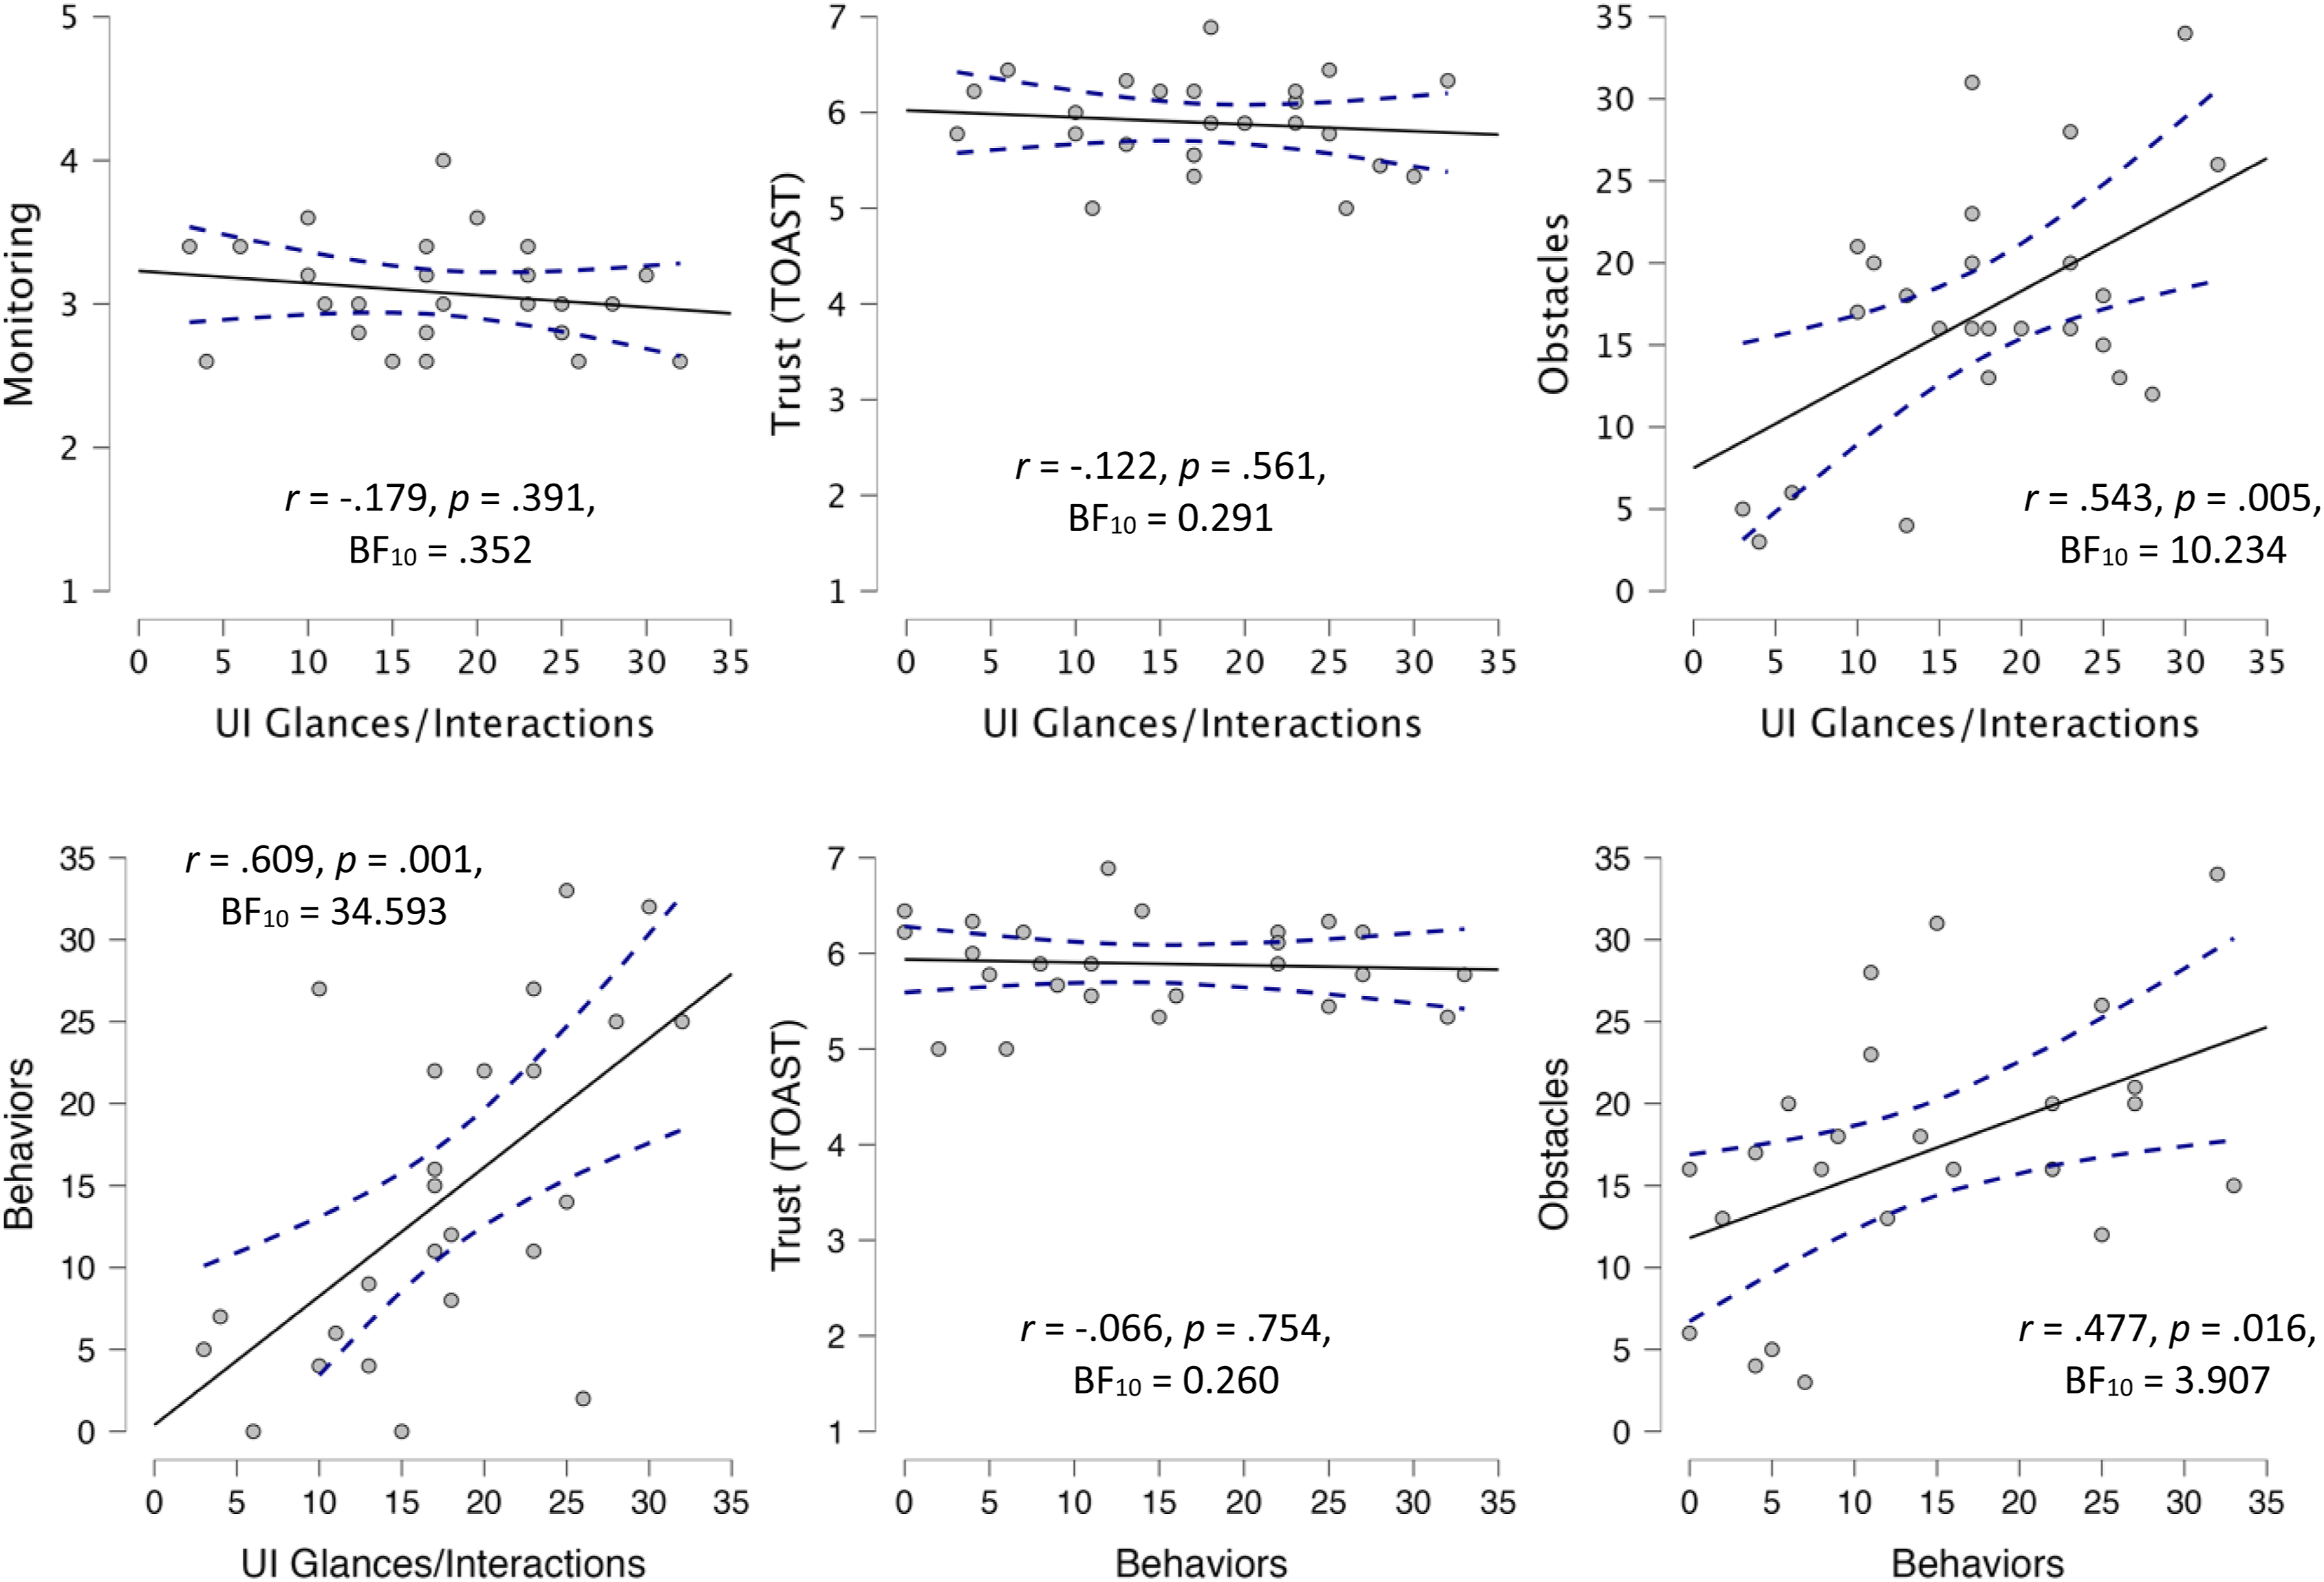
There was no significant correlation between participant scores on the monitoring subscale (which is supposed to predict the frequency with which an individual believes automated systems should be monitored) and the number of times they monitored the system by glancing at/interacting with the UI, r (25) = −.179, p = .391, and BF10 = .352. 2
While there was not a difference between BPM changes at baseline and those in response to obstacles, BPM changes are still thought to indirectly assess trust (Khalid et al., 2016). We therefore assessed whether there was a relationship between BPM changes and the other subjective and behavioral indicators of trust (Figure 8). There was no significant correlation between the average BPM in response to obstacles and self-reported trust (TOAST), r (25) = .225, p = .279, and BF10 = .432, the number of UI glances/interactions and average BPM change in response to obstacles, r (25) = −.039, p = .851, and BF10 = .252, or number of displacement behaviors, r (25) = −.043, p = .838, and BF10 = .253. Similarly, we compared HRV changes in response to obstacles to the other subjective and behavioral indicators of trust to see whether there was an agreement amongst these different approaches. There was no significant difference between the average HRV in response to obstacles and self-reported trust, r (25) = −.155, p = .461, and BF10 = .321. While there was a significant correlation, the Bayes Factors reported only anecdotal evidence in favor of a correlation between average HRV in response to obstacles and the number of UI glances/interactions, r (25) = .418, p = .038, and BF10 = 1.922, and moderate in favor of the correlation between average HRV in response to obstacles and the number of displacement behaviors, r (25) = .475, p = .016, and BF10 = 3.768. Despite both heartrate and HRV being thought to be predictive of trust, there was no significant correlation between average BPM change in response to obstacles and average HRV change in response to obstacles, r (25) = .051, p = .808, and BF10 = .255. Scatterplots for physiological measures. Note. Scatterplots for trust, number of UI glances/interactions, and behaviors, with BPM and HRV changes in response to obstacles in addition to scatter plot for the relationship between HRV and BPM. A solid line is regressed upon the data, and dashed lines represent the 95% CI for that regression line.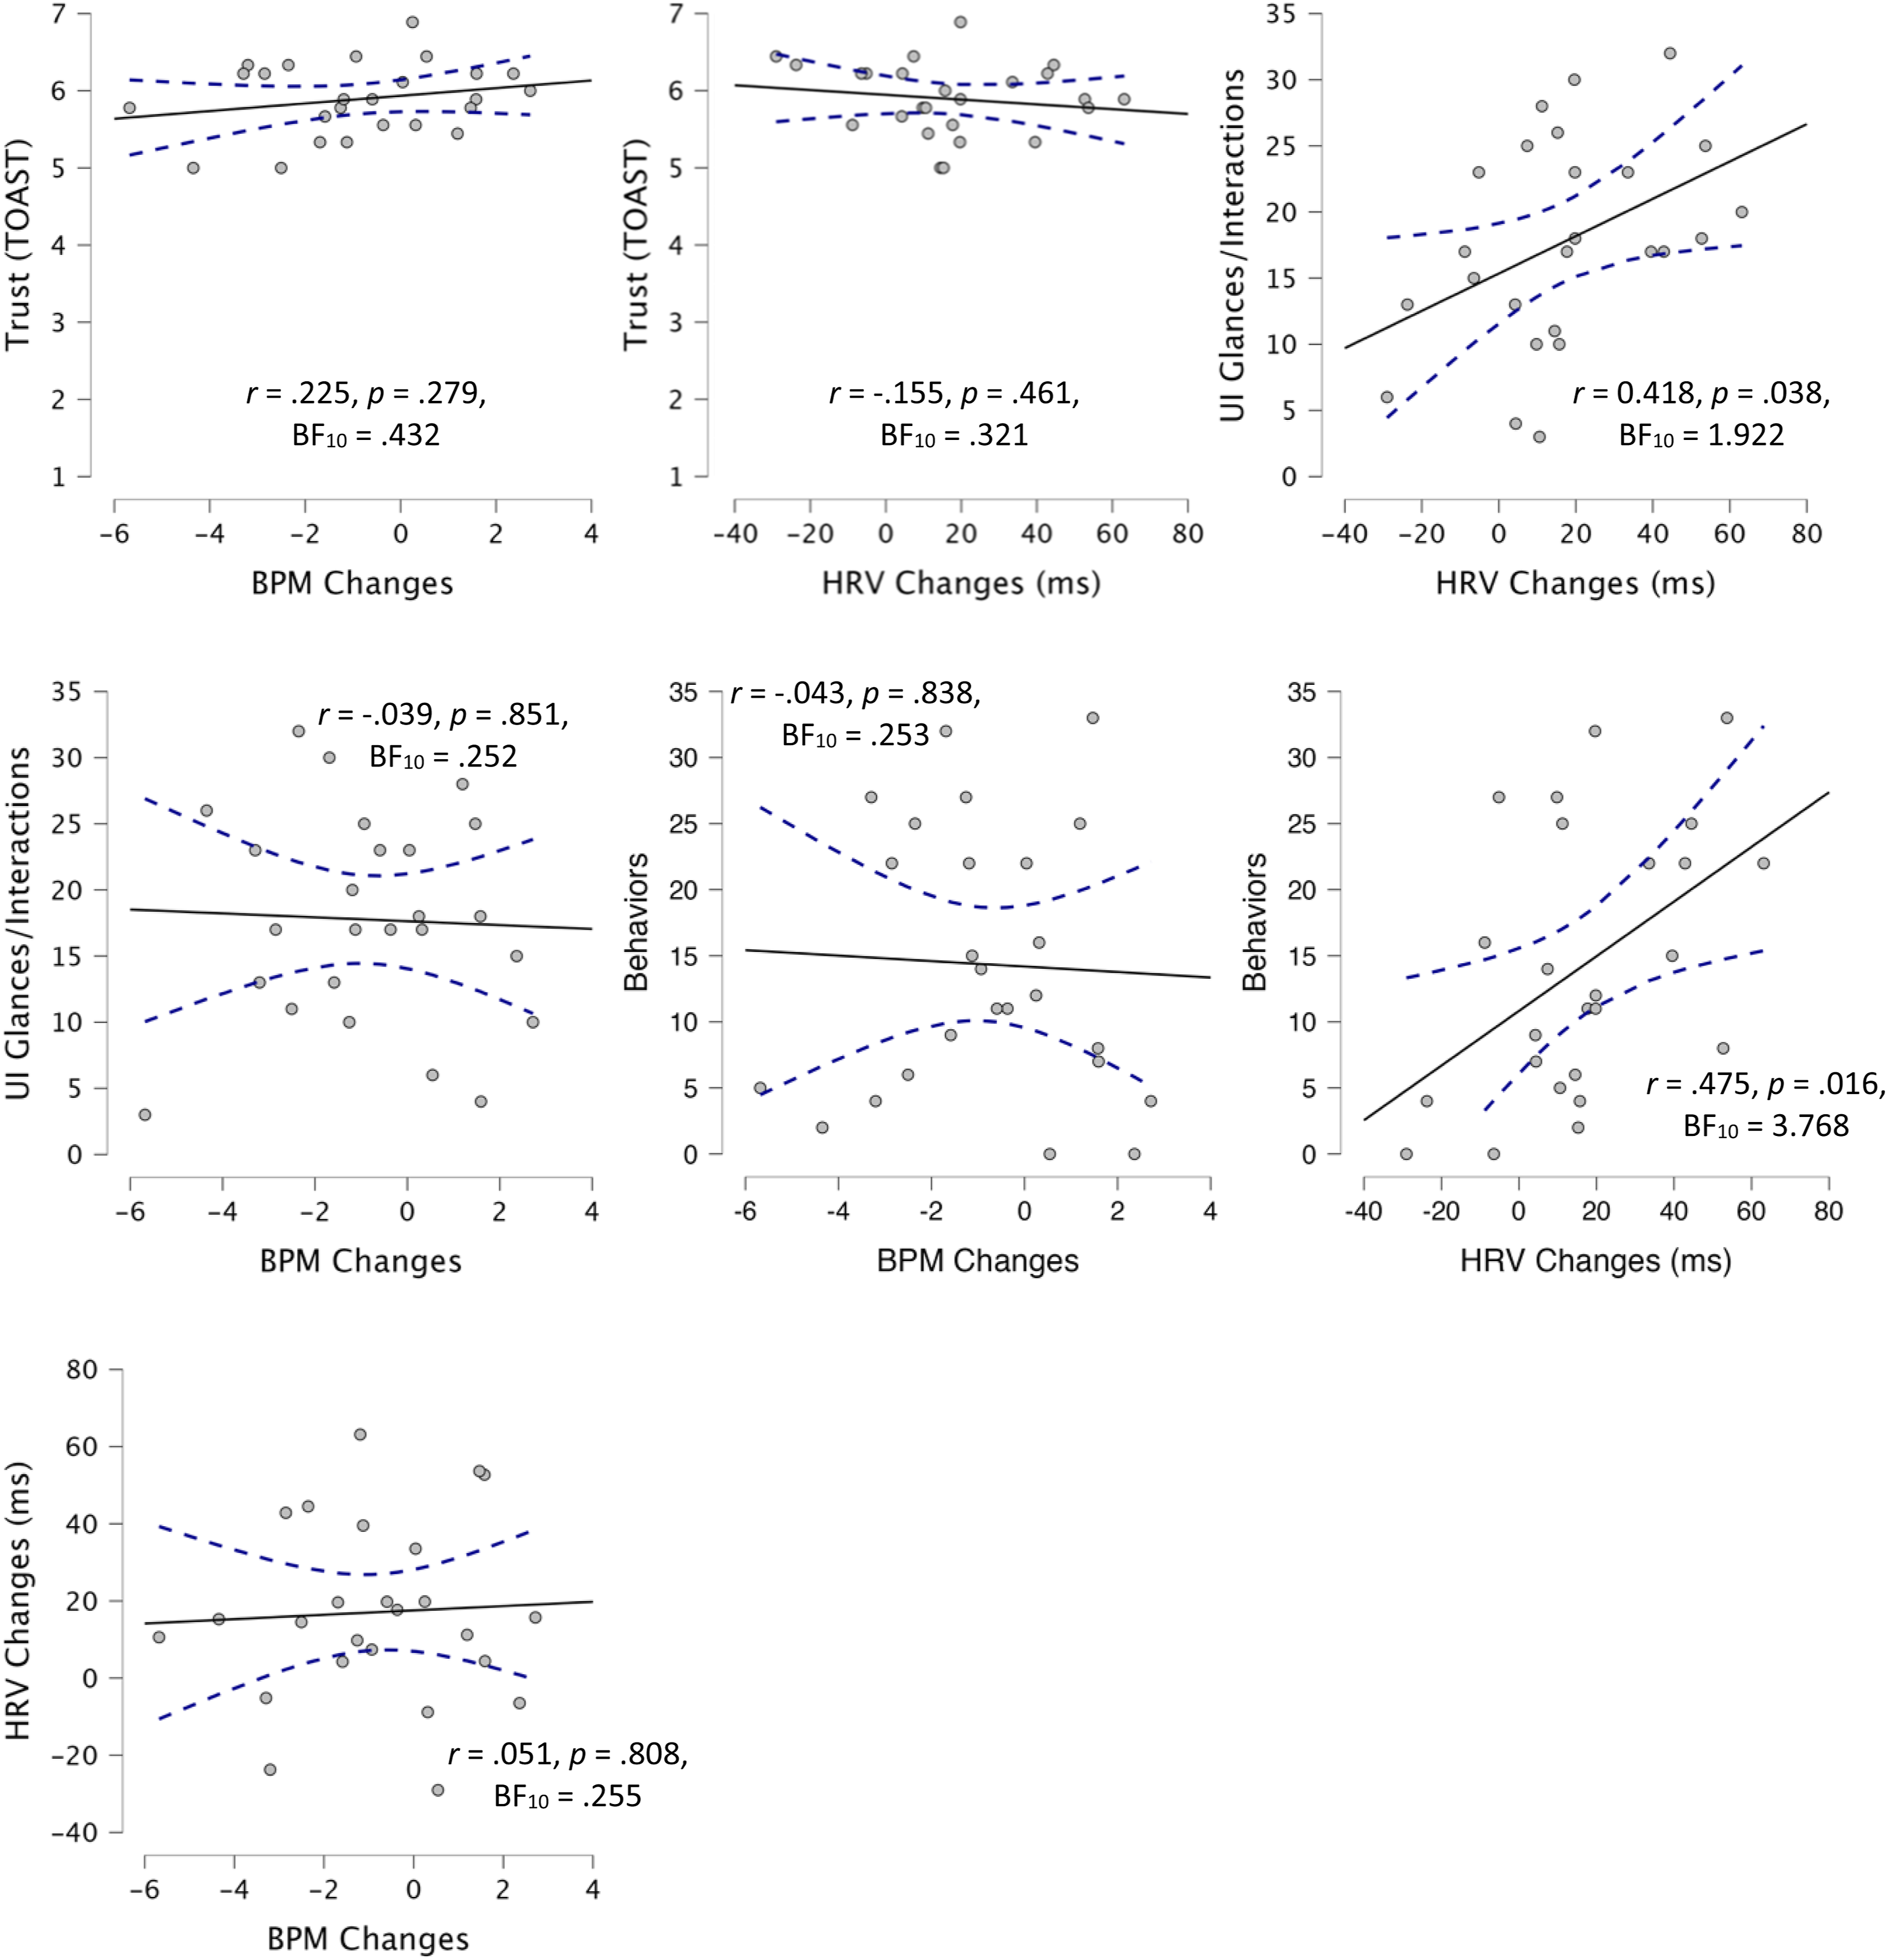
Discussion
The current study was a comparative analysis of different trust assessment techniques. Various trust measures have been used and proposed as effective ways to evaluate one’s trust; however, little research to date has explored their ability to converge upon a single finding. Not only is trust not a monolithic construct, but the different assessment approaches also used by the field rely on different assumptions and timescales for assessment. As such, it is important to understand whether there is an agreement between results for these different approaches as disparate results may arise in any given study as a function of the assessment approach used. Additionally, with new measures being proposed or called for, careful consideration should be paid to the ability of the measures to align with existing approaches that are more empirically substantiated.
As such, we chose to use subjective self-report, behavioral, and physiological data to assess trust, each of which has a body of literature detailing its use for assessment of trust (Ajenaghughrure et al., 2020; Akash et al., 2018; Banks et al., 2018; Mitkidis et al., 2015; Sauer et al., 2016; Schwarz et al., 2019; Thayer et al., 2012; Tolston et al., 2018; Wang et al., 2018; Wojton et al., 2020). In this study, we selected the TOAST for our subjective assessment measure because of its good intrasubject reliability, which is needed for individual differences research (Wojton et al., 2020). Additionally, we used the AICP-R scale to assess participant complacency potential when interacting with an automated system (Merritt et al., 2019). For physiological data, we collected heart rate and HRV. Heart rate has been used to assess trust in multiple ways (Mitkidis et al., 2015; Tolston et al., 2018); however, as abovementioned, we used the approach of Waytz et al. (2014), which involved evaluating the physiological changes over a 20-s window following an event. While the use of HRV has not been used, to our knowledge, to assess trust, it has been shown to correlate with stress and workload (Nickel & Nachreiner, 2003; Thayer et al., 2012), both of which are impacted by one’s trust in and reliance on a system (Parasuraman & Riley, 1997; Sauer et al., 2011), and thus could be considered a non-invasive approach to trust assessment (Tenhundfeld et al., 2022). Finally, for behavioral measures, we relied on checking/verification behaviors (Bahner et al., 2008; Ezer et al., 2007; Tenhundfeld et al., 2019), as well as the coding of “displacement” behaviors which have been shown to appear in response to stress (Burgoon et al., 2021; E. J. Cohen et al., 2018; Mohiyeddini et al., 2013; Mohiyeddini & Semple, 2013; Troisi, 2002),but have also been used in trust research (Fratczak et al., 2021; Hald et al., 2019).
Contrary to our expectations, our data did not show any real degree of convergence across measures. In fact, there was moderate evidence in favor of the null hypothesis (as evidenced by Bayes Factor values below .333) for the relationship between an individual’s TOAST score and the UI glances/interactions, behaviors, and HRV. The only relationship for which there was strong evidence in favor of a correlation was between the number of UI glances/interactions and the number of coded behaviors. There was even moderate evidence against a relationship between BPM and HRV in response to real-world obstacles.
There are several possible explanations for this lack of convergence. The first possible explanation is that some of these measures were not actually assessing trust. The measure of heart rate variability has not, to our knowledge, been used before to assess trust in this way. While there is a theoretical reason to believe HRV may be able to provide some information about the user’s trust, this is theoretical in nature and thus it may simply be the case that HRV is not a reliable way of assessing trust as there are other factors which directly impact it (Fatisson et al., 2016). This is supported by the fact that a more well-recognized physiological measure of trust (heart rate) did not correlate with HRV even on the same timescale. Additionally, while there has been some limited research on the use of displacement behaviors as a trust assessment technique (Fratczak et al., 2021; Hald et al., 2019), there has been comparatively little research validating it, and the displacement behaviors we used were different than those used before. The displacement behaviors we selected were deemed more relevant to the task at hand and are well-established in the literature on displacement behaviors (Troisi, 2002).
The second possible explanation for the lack of convergence is the fact that these trust assessment approaches represented fundamentally different timescales. Whereas the subjective assessment (TOAST) was administered after the participant completed his/her drive, the physiological and behavioral data were collected throughout the experiment. As mentioned in the introduction, these differing timescales present problems for trust assessment. Surveys which are administered after trials are complete only collect trust data after the entirety of exposure to the system. On the other hand, behavioral and physiological data are collected throughout the experiment and therefore may be picking up the process of trust formation (more on this below). Additionally, as evidenced by our analyses, there are a variety of ways in which to analyze physiological and behavioral data. Some approaches involve processing data continuously, while others deal with the data in aggregate.
A third possible explanation is that, regardless of the timescales, there are different categories of trust (i.e., situational, dispositional, and learned) which may be what is being assessed by any given measure. Studies that have demonstrated an assessment technique to be effective may be able to map the results onto trust but would be unable to establish what category of trust is being measured. Said another way, if assessment A maps onto situational trust, but assessment B maps onto learned trust, it is appropriate to say that both assessment approaches measure trust, but they may vary independently from one another. This is in line with existing research on construct and discriminant validity and could explain the lack of convergence between widely used measures of trust like subjective assessments and monitoring behaviors (Campbell & Fiske, 1959). In order to ascertain whether these assessment techniques are mapping onto the same aspect of trust, comparative studies, like this one, are needed.
The fourth possible explanation for the lack of convergence pertains to the methodology used here. Because this paradigm had not been used before, it is difficult to establish whether the null results were paradigmatic or due to one of the other abovementioned factors. There is some evidence for this as there was nearly uniform high trust on the subjective assessment (which admittedly took the authors by surprise). This could have been a function of either the recruitment (i.e., self-selection bias)/consent documentation or the system’s performance. While positive news for the developers of the system, this uniformity of trust (at least in subjective assessment) means that there may have been insufficient variability to truly tease apart degrees of convergence in the measures. This may have been a function of the system performance, the presence of a safety officer, or simply the relatively little amount of time that the participants spent interacting with the vehicle. Finally, the nature of the paradigm was such that participants were outside during the course of the experiment. This means that they were exposed to temperature/weather which may have impacted the physiological measures in ways that would not have affected subjective responses. Being outside means that they were also subjected to passing social interactions during which non-participants may have been staring at the participant/cart as the presence of an autonomous golf cart with various sensors is novel and attention-grabbing. These factors could have affected behavioral and physiological data in ways that were not related to trust, thereby making the data noisier and obfuscating any results that may have otherwise been detectable.
Ultimately, more research is needed in order to understand the reasons that these data did not converge. Future research should work to tease apart the contributions of different timescales and how these assessment approaches may map onto the different components of trust, especially in order to establish whether proposed approaches actually do measure trust rather than some other factor such as workload or general stress. This also may be better done in an established paradigm in which these various assessment techniques have been reported to assess trust.
Conclusion
In conclusion, we ran a comparative and exploratory analysis of different trust measurement approaches. Had measures converged upon one another, we would have had reason to believe that the trust assessment selected for any study would not matter all that much, as they would be yielding the same result. However, we found very little, to no, convergence across measures. This suggests that certain measures (e.g., HRV and displacement behaviors) may not be a reliable assessment approach for trust, while others may be task-dependent, measuring different components of trust, or results may differ simply as a function of the timescales in which these measurements were used. However, future research should be done in a more controlled environment that may be able to more concretely establish whether there is an alignment between these different trust assessment techniques. Such efforts are needed in order to provide trust assessment approaches for both researchers and practitioners.
Footnotes
Declaration of conflicting interests
The author(s) declared no potential conflicts of interest with respect to the research, authorship, and/or publication of this article.
Funding
The author(s) received no financial support for the research, authorship, and/or publication of this article.