
Abstract
Trust in automation (TiA) is crucial for human-automation interactions, but traditionally measured statically via discrete survey data points. We developed a mathematical model capturing the dynamic nature of TiA, incorporating measurable components across different timescales, and validated it through experimental data. Our findings show that: (1) trust timescales are important for predicting automation usage, emphasizing trust’s key role in decision-making; (2) short-timescale trust significantly impacts overall trust dynamics, highlighting the importance of recent interactions; (3) trust levels are generally higher in highly reliable automation scenarios, though this pattern emerges after an initial evaluation period; and (4) automation type, implying varying workloads, does not significantly impact trust dynamics in highly reliable systems but fosters increased trust in lower-reliability systems. This study advances our understanding of trust dynamics in automation, contributing to more intuitive and trustworthy technology development.
Keywords
Introduction
As technology advances rapidly in modern society, interactions between humans and automated systems are becoming more common in numerous fields. This surge in automation integration has underscored the critical importance of trust in the successful adoption and use of emerging technologies (J. Lee & Moray, 1992). Despite variations in how trust is defined and measured, one broadly accepted definition describes trust as “the belief that an agent will help fulfill an individual’s objectives in situations marked by uncertainty and vulnerability” (J. D. Lee & See, 2004).
Trust in automation has traditionally been measured in a somewhat static manner, often employing surveys administered at the conclusion of human-automation interactions. However, this approach overlooks the inherently dynamic nature of trust, which evolves based on ongoing experiences, outcomes, and context changes (Hoff & Bashir, 2015). Understanding the dynamics of trust in automation is critical, especially in high-stakes environments such as driving, where rapid decisions and reliance on automated systems can significantly impact safety outcomes. Additionally, researchers have suggested that assessing trust at different timescales is essential, as each timescale contributes in a distinct manner to the overall trust an individual holds toward automation (Hoff & Bashir, 2015; Rodriguez et al., 2023).
Although theory recognizes trust as a dynamic entity, its real-time evolution in experiments is challenging to document without disrupting human-automation interactions through intrusive survey methods. In response to these challenges, mathematical models have emerged as powerful tools for understanding trust dynamics, despite limitations. Recently, Rodriguez et al. (2023) critically reviewed existing mathematical models for trust in automation, noting their shortcomings in clearly linking trust measurements to the model’s overall framework or its components, the lack of rigorously defined components for empirical validation, and the omission of detailed trust dynamics influenced by automation capabilities, operator experiences, and environmental factors.
Identifying measurable components of trust can be challenging, however, researchers have made significant advances in pinpointing and understanding the determinants of trust in automation, as well as the interconnections among these factors, through experimental and mathematical modeling efforts. Key factors identified in the literature as influencing trust include automation’s performance, perceived risk, and reliance on the system (Dzindolet et al., 2003; J. D. Lee & See, 2004). Real-time measurement of these components during experiments is feasible, and their dynamics have been analyzed in specific contexts. For example, Rodriguez et al. (2022) investigated the dynamics of performance and risk in driving simulation tasks, while Bustamante et al. (2022) examined reliance on automation dynamics within the same experimental setting.
To address the challenges of dynamically measuring trust in automation and the shortcomings of current models in capturing trust dynamics, we introduce a mathematical model that integrates measurable components of trust across various timescales, building upon Rodriguez et al.’s (2023) suggested approach; employ experimental data to validate this model; assess how each timescale contributes to the overall trust dynamics; explore how trust fluctuates under different automation conditions; and examine how trust varies among operators with differing performance levels.
Methods
Dataset
We utilized a dataset of sixteen participants operating a driving simulator at the US DEVCOM Ground Vehicle Systems Center. The full description of the experiment can be found in Drnec and Metcalfe (2016). This paper focuses on the critical aspects relevant to the prediction and analysis of trust dynamics. Participants, each with at least 2 years of driving experience and compensated for their participation, undertook a series of driving tasks. The tasks involved following a lead car, maintaining lane position, and ensuring safe distance, with the opportunity to engage autonomous driving assistance. The study’s two-by-two within-subjects design contrasted automation types (Speed and Full) against automation levels (Low and High). Speed automation was limited to cruise control, while Full automation encompassed both cruise control and lane-keeping features. The levels of automation were indicative of the system’s reliability, with higher reliability linked to enhanced performance in the driving tasks. To mimic the complexities of real-world driving, participants were subjected to various perturbations, including changes in velocity, wind gusts, and pedestrian encounters, across four automation conditions: Speed High (SH), Speed Low (SL), Full High (FH), and Full Low (FL). During the experiment, participants’ actions and the environment were recorded at a 60 Hz rate.
Participants’ performance was evaluated based on a scoring system that started at 500 points and could decrease due to task violations. The participants were divided into three performing groups based on their final scores: Low (2 participants, scores below 300), Medium (11 participants, scores at 301–400), and High (3 participants, scores above 400).
Measurable Components of Trust in Automation
Participants’ decision to use automation is strongly influenced by trust (J. Lee & Moray, 1992), a complex and dynamic process affected by various factors (Hoff & Bashir, 2015). We quantify trust using a set of metrics that capture its dynamics on short- and medium-timescale, as suggested by Rodriguez et al. (2023). The medium-timescale metrics include Performance
In our dataset, human operators drive for a duration T, and can activate automation at any point in time t, resulting in K subintervals,
Measurable Components of Trust in Automation. All Metrics Are Defined in the Interval [0.1].
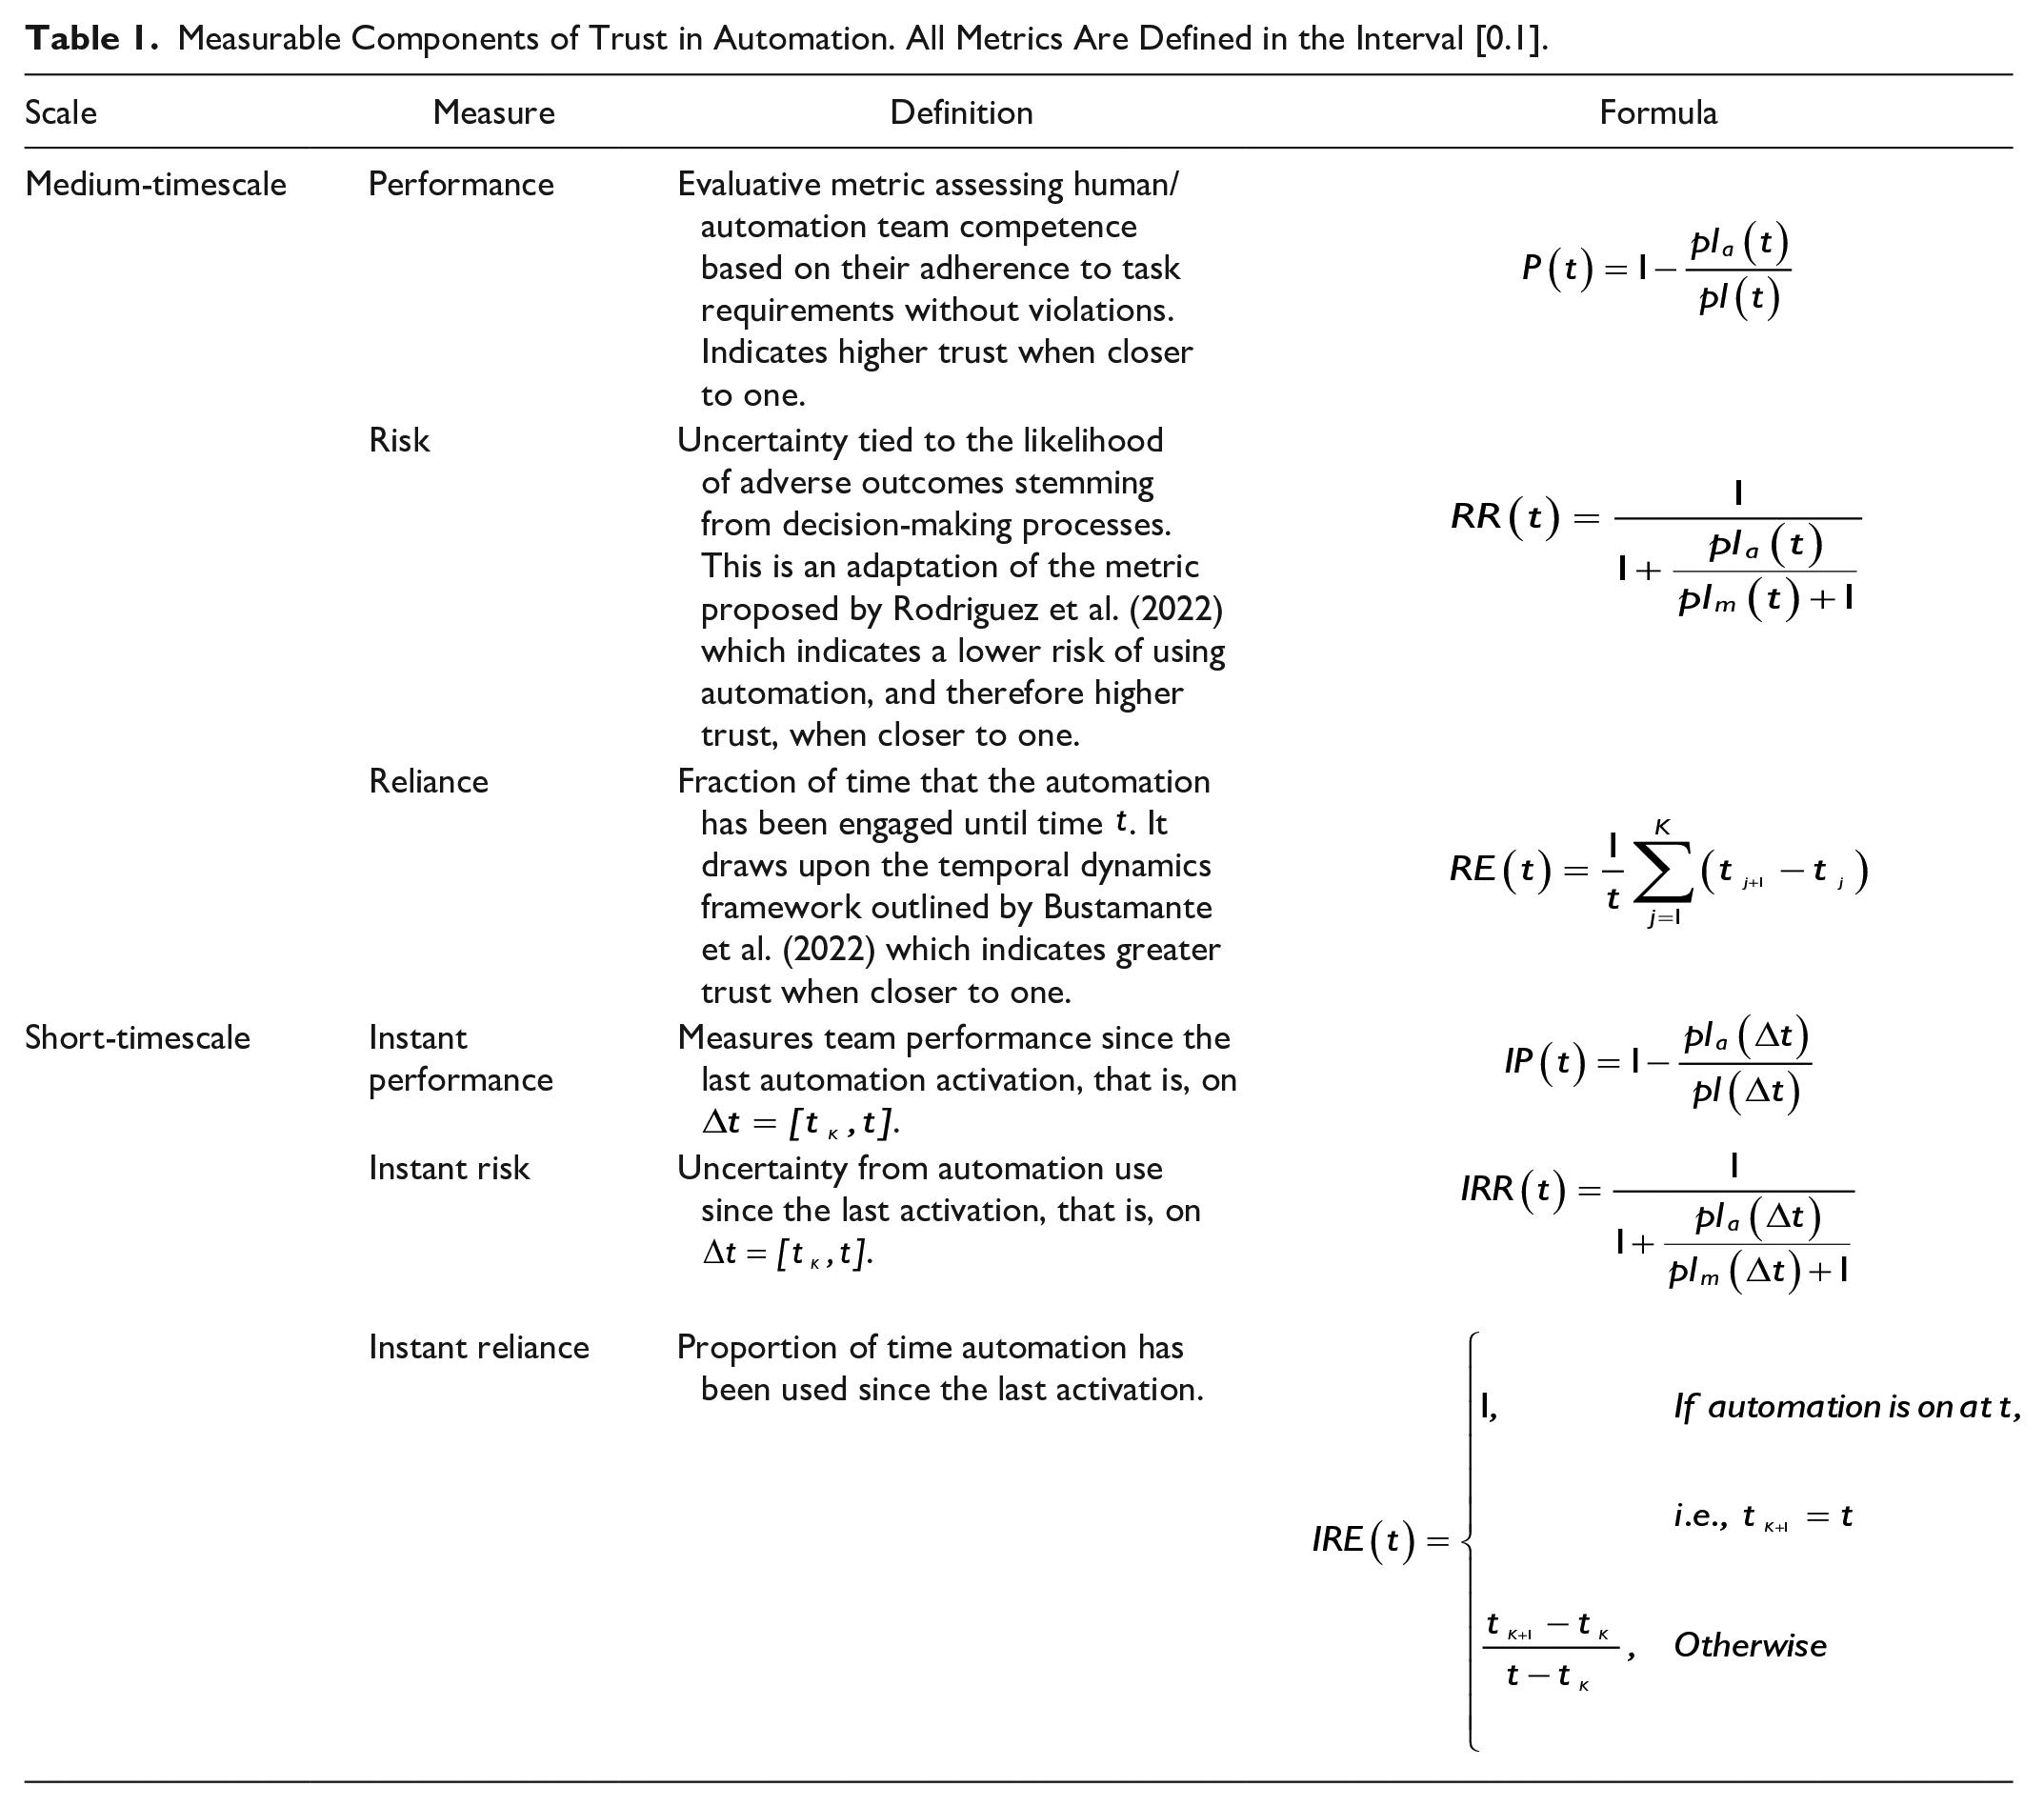
Comprehensive analyses of performance and relative risk are available in Rodriguez et al. (2022), while reliance dynamics are explored in Bustamante et al. (2022). This study builds upon these works to estimate and analyze trust dynamics.
Model Formulation
Expanding on the modeling framework introduced by Rodriguez et al. (2023), we propose a comprehensive model for quantifying trust in automation as follows:

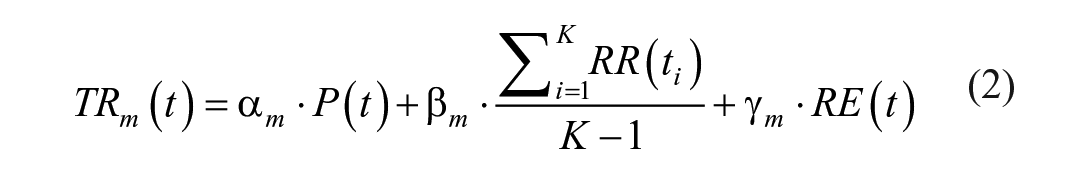

In this model,
Parameter Estimation
Data is needed to estimate the eight parameters in Model (1)–(3). However, the lack of direct real-time experimental data on trust dynamics prevents using conventional model fitting techniques. To address this, we estimate the model parameters by treating trust as a latent variable influenced by performance, risk, and reliance, which in turn affects future decision-making. Machine learning, particularly with time-series data, has proven effective for latent variable estimation (Dong & Qin, 2018), making it a suitable approach for this study. We employ random forest models for predicting the decision to use automation and estimating trust, selected for their adaptability, straightforward assumptions, and demonstrated success in similar research contexts. Our methodology encompasses the following steps:
1. Using Latin Hypercube Sampling (LHS), generate
2. Utilize the generated parameters to compute trust at short and medium timescales based on Equations 1 and 2, and incorporate them into the dataset designated for model evaluation.
3. Partition and shuffle the dataset for model assessment, allocating data from 13 participants (80%) for training purposes and data from 3 participants (20%) for testing.
4. Implement five-fold cross-validation by dividing both the training and testing datasets into five segments each.
5. Train a Random Forest model to predict future automation usage from the trust metrics derived in step 2, based on one the five training data segments identified in step 4.
6. Assess the model’s performance on a corresponding segment of the testing data from step 4, employing the Area Under the ROC Curve (AUC) as the evaluative standard, which offers a comprehensive measure of performance across all potential classification thresholds.
7. Execute steps 5 to 6 for each of the five data segments to complete the five-fold cross-validation process.
8. Calculate the average performance of the model across all cross-validation folds.
9. Iterate steps 2 to 8 for all parameter sets generated in step 1, retaining the parameter sets that yield the highest model performance as determined in step 8.
This methodology allows us to estimate the parameters
Results
Based on the described methodology, we aim to provide estimations of trust dynamics, assess the influence of trust across various timescales on the overall trust metric, and explore the effects of automation type (Speed, Full) and reliability (Low, High) on trust dynamics. We also investigate the relationship between participants’ performance levels and their trust in automation, aiming to provide a nuanced understanding of how individual differences impact trust formation and evolution.
Estimation of Trust Dynamics
Table 2 presents the performance metrics of Random Forest models in predicting future automation usage from trust metrics. The models demonstrate high prediction accuracy and Area Under the Curve (AUC) values, ranging from 92% to 98%, for all automation conditions. In our experiments, Random Forest models using short- and medium-timescale trust metrics as inputs outperformed those using other individual or combined metrics (such as reliance, performance, risk, workload, and environment) in predicting future automation usage. These findings underscore the value of incorporating trust estimations to enhance the predictive capability of decision-making models. Table 2 also displays the estimates of how much (weights) short- and medium-timescales of trust contribute to overall trust. Notably, trust at the short timescale is found to hold greater significance across all four automation conditions, indicating its predominant influence on the composite trust assessment.
Performance of Random Forest Models on Automation Usage Prediction and Estimated Weight of Trust Timescales on Overall Trust.
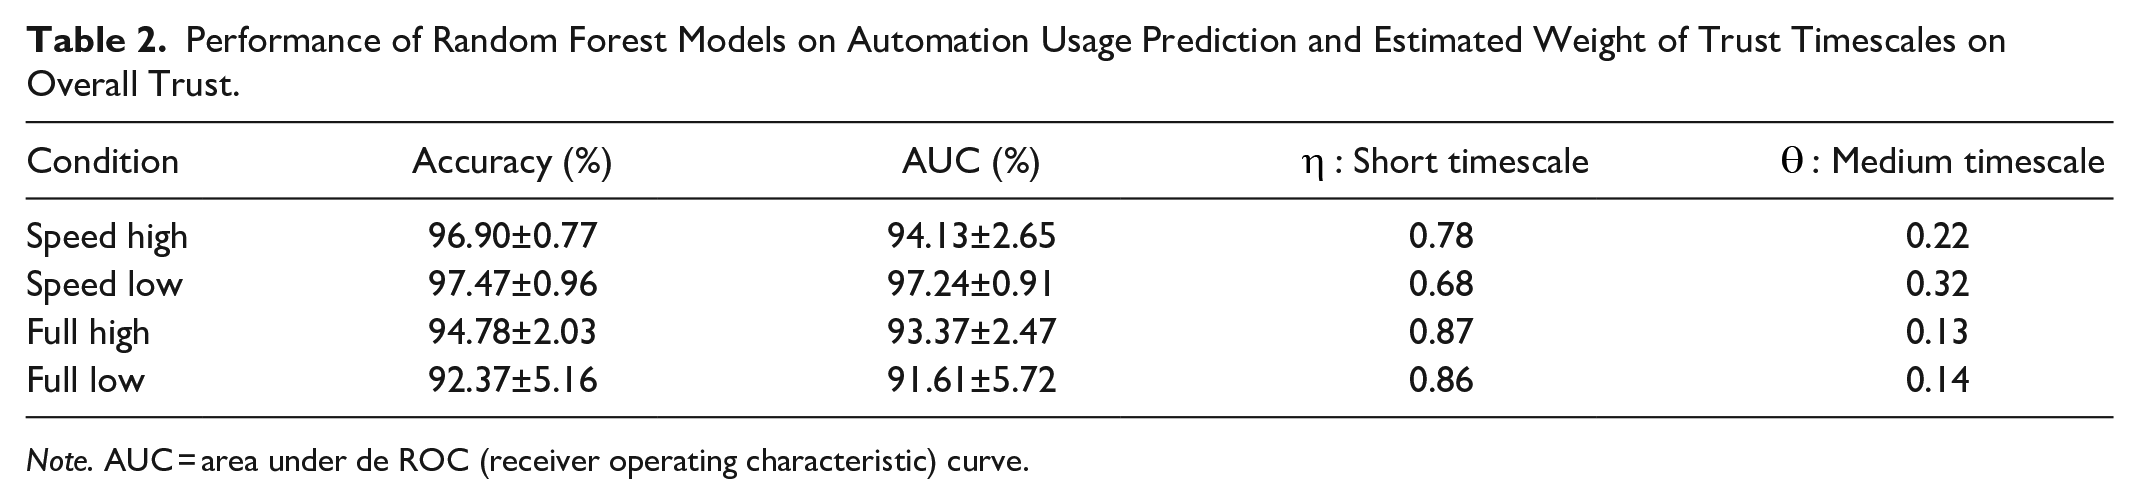
Note. AUC = area under de ROC (receiver operating characteristic) curve.
Trust Dynamics Under Different Automation Conditions
Figure 1 shows the average trust levels of all operators in four different automation conditions. In systems with high-reliability (blue and yellow lines), trust rapidly increases during the first 40 s. After this initial rise, trust remains relatively stable, with a slight increase in the Speed automation scenario. However, in the Full automation scenario, trust decreases toward the end. The small difference in average trust between the SH and FH conditions over time suggests that the workload differences between these two scenarios do not significantly impact trust dynamics in highly reliable systems. Conversely, in low-reliability scenarios (orange and purple lines), trust also increases sharply up to the 40-s mark but then consistently declines. Notably, from the 40-s mark onward, trust in Speed automation consistently exceeds that in Full automation. This indicates that higher workloads associated with Speed automation could foster greater trust in automation when system performance is suboptimal. Overall, high-reliability automation conditions tend to maintain higher and more stable trust levels compared to low-reliability conditions, which show a significant decline and fluctuation in trust over time.
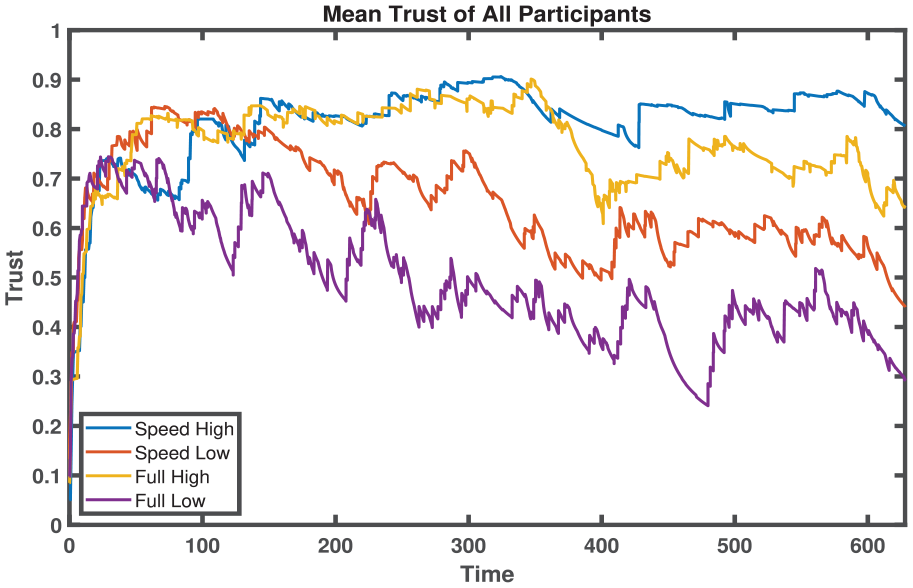
Impact of varied automation conditions on the average trust dynamics of all participants.
Impact of Individual Differences on Trust Dynamics Across Varied Automation Conditions
Using Figure 2, we examine the average trust dynamics among operator groups categorized by performance levels across four automation conditions: SH, SL, FH, and FL.
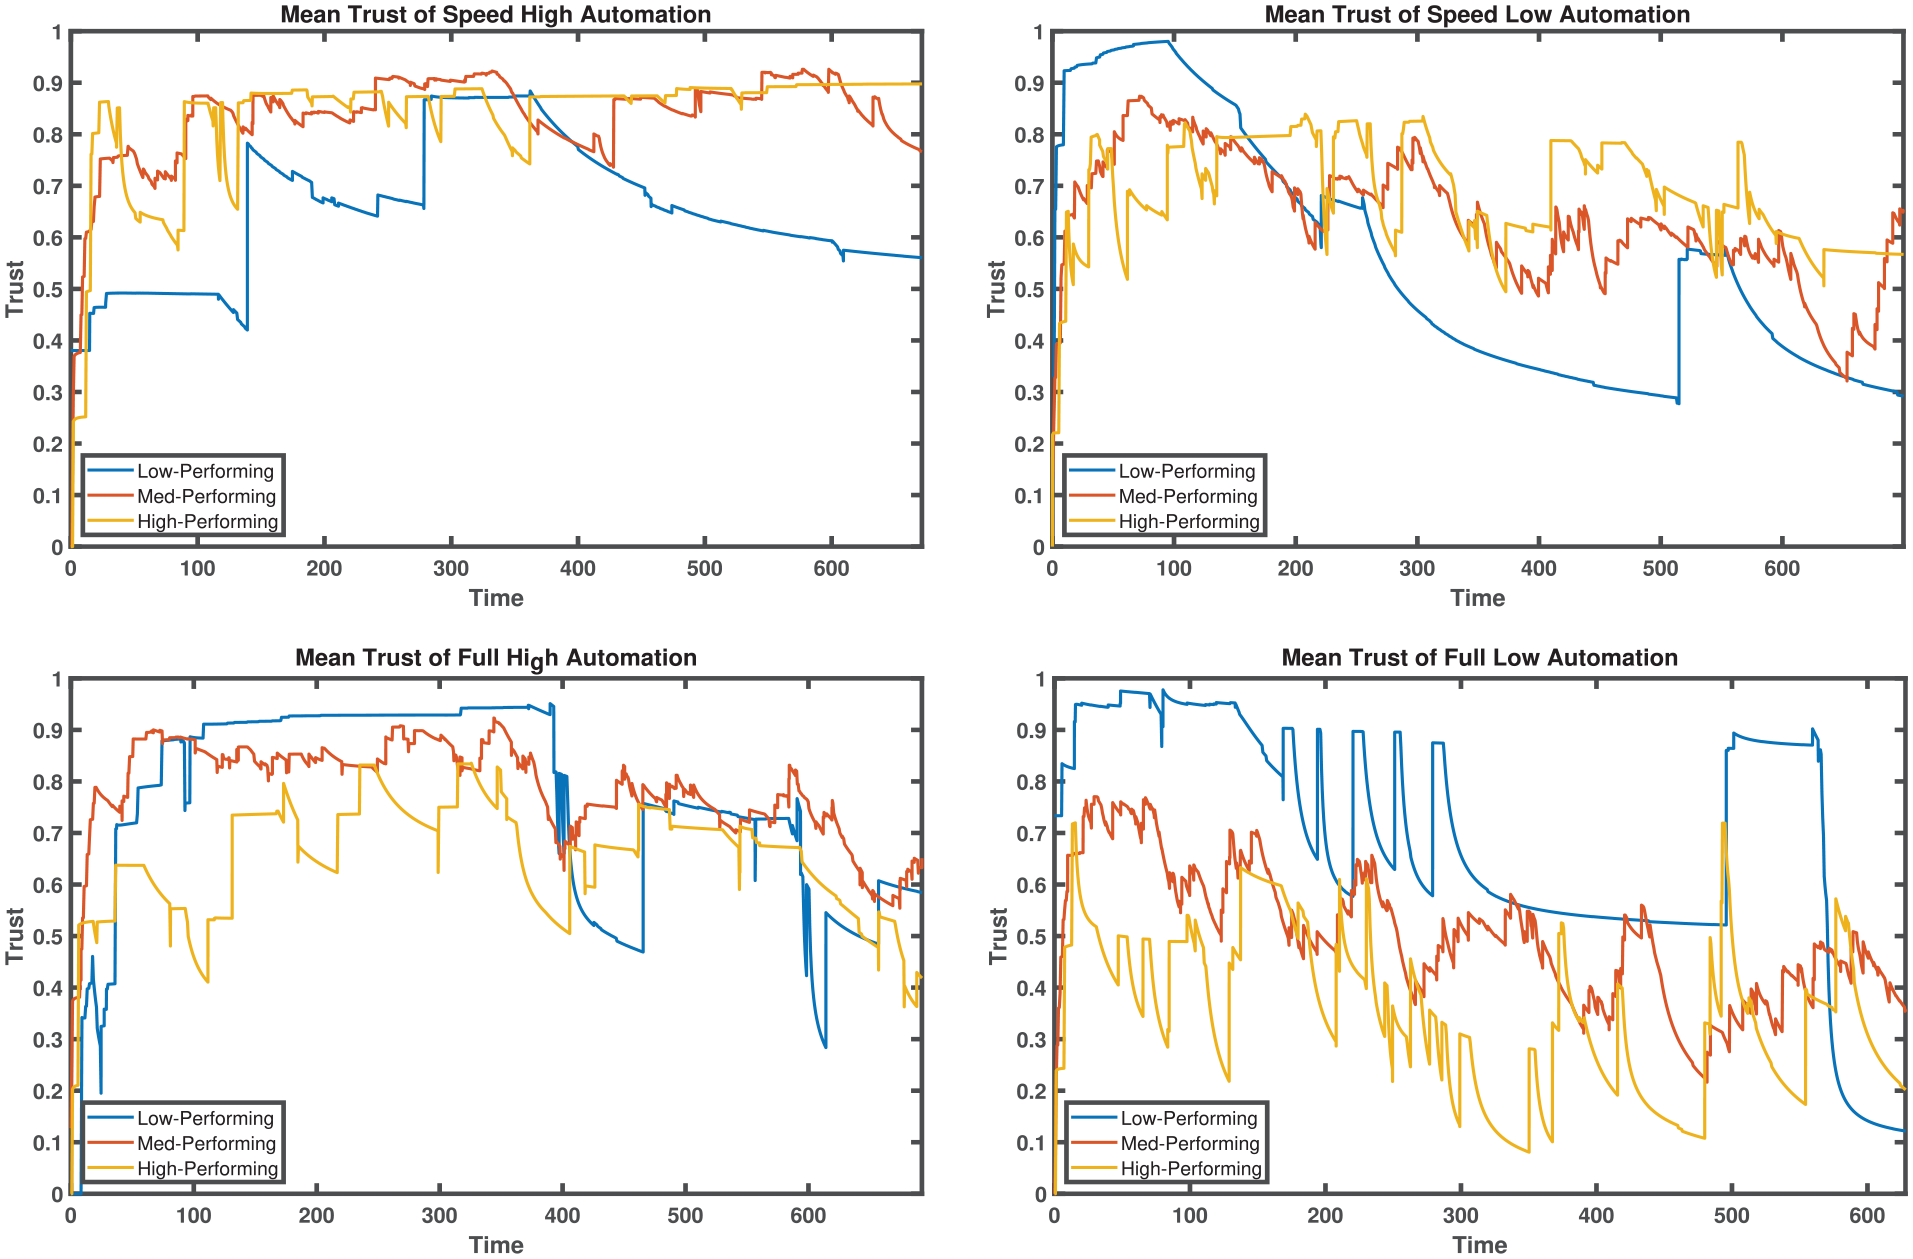
Impact of varied automation conditions on the average trust dynamics of different performance groups.
In the Speed High (SH) condition, High-Performing and Medium-Performing operators demonstrate more stable and higher average trust compared to the Low-Performing operators. High-Performers, in particular, maintain consistently higher trust levels throughout the experiment. Conversely, the Full High (FH) condition shows a convergence of trust dynamics across all groups, with a general decrease in trust over time. Notably, the Low-Performing operators experience significant trust fluctuations in this condition, despite the overall higher and more stable trust levels observed across groups.
The Speed Low (SL) condition presents a unique pattern, with a critical point occurring around 200 s that marks a shift in trust dynamics. Initially, Low-Performing operators show significantly higher trust than other groups. However, post-200 s, this trend reverses, with the Low-Performing operators ending the experiment with the lowest trust levels. On the other hand, in the Full Low (FL) condition, trust dynamics follow a distinct pattern where Low-Performing operators consistently exhibit higher trust levels than Medium and High-Performing operators. The volatile trust patterns observed in these conditions across all performance groups, highlight the impact of lower automation reliability on trust dynamics.
Further analysis reveals that High-Performing operators consistently prefer the SH condition, demonstrating a clear trust hierarchy: SH > FH > SL > FL. This preference suggests that High-Performing individuals may value the balance of automation support and manual control offered by the Speed High condition. In contrast, Low-Performing operators show variable trust dynamics, making it difficult to discern a consistent preference. However, they often favor Full automation conditions (FH > FL > SH > SL), possibly due to perceived lower workload requirements, with less emphasis on system reliability.
These observations highlight the complex interplay between automation characteristics and individual performance levels in shaping trust dynamics. The automation type and its reliability significantly influence trust patterns, but these influences are mediated by the performance level of the operators.
Discussion and Future Work
Trust in automation is recognized as a multifaceted and dynamic construct, influenced by numerous factors and challenging to quantify or measure in real-time due to its subjective nature. Given the impracticality of interrupting experimental sessions for trust assessments, our study opted for an alternative approach to real-time trust evaluation in experimental settings. We developed a trust model based on quantifiable components highlighted in existing research. This model interprets trust as a linear combination of short and medium timescale evaluations of the factors performance, risk, and reliance. We then validated this model using machine learning techniques, treating trust as a latent variable that influences the decision to utilize automation.
Our findings showed that incorporating estimations from both medium and short timescales into random forest models enhances their ability to predict automation engagement, aligning with existing research that underscores trust as a pivotal element in decision-making. Notably, we observed that short timescale trust has approximately four times the impact on the overall trust metric compared to the medium timescale. This underscores the significant influence of recent interactions with automation systems, resonating with the notion that recent actions are more vividly remembered and hence more influential in trust formation.
The analysis of average trust dynamics across all operators and various automation conditions revealed a preference for high-reliability systems over low-reliability ones, regardless of the automation type. This trend mirrors reliance dynamics (Bustamante et al., 2022), although with greater variability. Notably, there’s an initial period where low-reliability systems enjoy similar trust than their high-reliability counterparts for the first 40 s, after which the clear preference for high-reliability systems emerges (see Figure 1). This lag likely reflects the time required for operators to evaluate the automation performance. Operators demonstrated a predisposition to engage with automation, possibly influenced by prior experiences, discerning automation performance levels within the initial 40 s. This period marks the beginning of a divergence in trust levels among different automation conditions, influencing subsequent automation usage.
An interesting observation is that workload differences between partial (Speed) and complete (Full) automation do not significantly affect trust when automation reliability is high, though a slight preference for partial automation is noted toward the end of the experiment. However, when automation reliability is low, partial automation consistently exhibits greater trust. This suggests that operators could tolerate some automation errors and place more trust in the automation if it reduces their workload when the workload is excessively high. Another reason for the higher trust in partial automation could be the perception of lower risk of automation failure and fewer fatal consequences compared to complete automation, which controls more variables and thus has a higher probability of failures and severe outcomes.
Performance group analyses indicated that High-Performing operators tend to trust partial (Speed) automation more, while Low-Performing operators show greater trust in complete (Full) automation throughout most of the experiment. This suggests that High-Performing operators perceive partial automation as less risky and feel more confident in handling some tasks themselves. Conversely, Low-Performing operators may lack confidence in their ability to perform tasks better than the automation, thus trusting more in systems that can take on a greater workload. These insights highlight differing trust dynamics based on the operators’ skills and suggest that perceptions of automation’s reliability and complexity significantly influence operators’ trust.
Future directions include incorporating long-term trust metrics, such as past experiences with automation and driving. Additionally, efforts will focus on advancing mathematical models and machine learning techniques to better understand trust dynamics. The goal is to develop models that fit current datasets and apply effectively in broader experimental contexts.
Footnotes
Declaration of Conflicting Interests
The author(s) declared no potential conflicts of interest with respect to the research, authorship, and/or publication of this article.
Funding
The author(s) disclosed receipt of the following financial support for the research, authorship, and/or publication of this article: Research was sponsored by the Army Research Laboratory and was accomplished under Cooperative Agreement Number W911NF-20-2-0252, the research assistantship awarded by the Simon A. Levin Mathematical, Computational and Modeling Sciences Center at Arizona State University, and the James S. McDonnell Foundation 21st Century Science Initiative in Studying Complex Systems Scholar Award (UHC Scholar Award 220020472). The views and conclusions contained in this document are those of the authors and should not be interpreted as representing the official policies, either expressed or implied, of the Army Research Office or the U.S. Government. The U.S. Government is authorized to reproduce and distribute reprints for Government purposes notwithstanding any copyright notation herein.