
Abstract
The decision sciences are increasingly challenged to advance methods for modeling analysts, accounting for both analytic strengths and weaknesses, to improve inferences taken from increasingly large and complex sources of data. We examine whether psychometric measures—personality, cognitive style, motivated cognition—predict analytic performance and whether psychometric measures are competitive with aptitude measures (i.e., SAT scores) as analyst sample selection criteria. A heterogeneous, national sample of 927 participants completed an extensive battery of psychometric measures and aptitude tests and was asked 129 geopolitical forecasting questions over the course of 1 year. Factor analysis reveals four dimensions among psychometric measures; dimensions characterized by differently motivated “top-down” cognitive styles predicted distinctive patterns in aptitude and forecasting behavior. These dimensions were not better predictors of forecasting accuracy than aptitude measures. However, multiple regression and mediation analysis reveals that these dimensions influenced forecasting accuracy primarily through bias in forecasting confidence. We also found that these facets were competitive with aptitude tests as forecast sampling criteria designed to mitigate biases in forecasting confidence while maximizing accuracy. These findings inform the understanding of individual difference dimensions at the intersection of analytic aptitude and demonstrate that they wield predictive power in applied, analytic domains.
Introduction
The applied psychological and decision sciences are currently challenged to leverage a rich literature in psychometric assessment of individual differences, not only to improve selection of data analysts—in both public and private sectors—but also to account for systematic biases in analysts’ work products (cf. Yarkoni, 2012). This would allow for the unique psychological strengths and weaknesses of individual analysts to be better matched to discrete tasking and analytic products (e.g., reports, forecasts, etc.). Such demand on the decision sciences will likely increase dramatically as the technology for eliciting, sharing, and displaying data will continue to mature faster than tradecraft with which to transform massive and extremely complex data into actionable information (Fingar, 2011a, 2011b; Staff, 2011). As such, opportunities for applying the rigorous empirical approaches of psychology and the decision sciences to model individual differences will continue to multiply. In turn, these applied challenges will foster and harden the basic science.
The impetus driving the challenge of personality psychology to “model the data analyst” is most clearly illustrated in analytic forecasting; this is perhaps the most challenging of analytic tasks, requiring the full range of the analyst’s skill set. Crowdsourcing and other methods of aggregation have reemerged as means to improve forecasting by relying on large samples of analysts with a greater range of available data to produce metaforecasts that are accurate within narrow confidence intervals (Klucharev, Hytönen, Rijpkema, Smidts, & Fernández, 2009; Surowiecki, 2004). However, the potency of methods to improve forecasting is still subject to the data available to sampled analysts (Hogarth, 2010) as well as both the analysts’ aptitude for making robust inferences from the data and the confidence they place in that information (Crocker & Algina, 1986). Therefore, even pooled information, as is used in aggregation techniques, is not likely a strict derivative of the sum of nonredundant data available to the analyst sample. Rather, it is also highly subject to the competencies, deficits, biases, and dispositions of the individuals within the sample; personality, cognition, motivation, and of course, analytic aptitude likely play a large role in forecasting.
Forecasting based on aggregated analysis necessitates a capability to robustly model analysts, individually and en masse, with respect to not only their aptitudes but also the psychological dispositions that influence (and bias) how they utilize these aptitudes to make inferences. Although some individual differences have been explored for selection and assessment in the area of expert knowledge (cf. Tetlock, 2006; Weaver & Stuart, 2012), personality (Barrick & Mount, 1991), and general mental ability (GMA; Schmidt & Hunter, 1998), they have not been widely scrutinized relative to analytic forecasting, which presents a unique challenge for assessment and selection.
Analysts represent a remarkably heterogeneous population, stemming from a wide variety of academic and professional backgrounds (Treverton & Gabbard, 2008), and with the revival of crowdsourcing, virtually anyone with sufficient ability to make a reasoned argument can be an “analyst.” Such diversity is incredibly valuable as it allows for myriad skill sets and knowledge bases to be brought to bear on a given analytic problem. This is absolutely critical in crowdsourcing and aggregation techniques for forecasting, as many of these are successful only if they are able to identify and weight nonredundant information within a pool of forecasters. In this respect, previous explorations of individual differences have made progress in developing best practices for matching the right type of person to the right job by virtue of expertise, aptitude, and interest—essentially minimizing the variance of persons within job placements. However, the analytic domain has greater need for diversity and variability, which questions traditional approaches to personnel selection. Therefore, beyond being able to identify core competencies—mathematical, verbal, problem-solving, and logical aptitude—in analysts, the goal for assessment in the analytic workforce and for forecasting is to ensure this variability.
The needs for variability within the analyst community warrants an examination of individual differences, not only as they pertain to competency in making reasoned inferences but also as they might introduce individual-level systematic bias that is independent of the analytic problem at hand. Dispositional (i.e., personality), motivational (i.e., goal framing), and cognitive (i.e., thinking styles) differences are all potential sources of systematic bias and therefore targets of inquiry. For example, personality facets, such as openness to experience, might affect the propensity to simultaneously entertain alternative hypotheses, whereas tendencies to frame one’s motivation in light of threat avoidance, compared to pursuit of incentives, might influence whether one is more likely to pursue the best available account for data rather than a simple, sufficient one (Carver & White, 1994; Scholer & Higgins, 2012). Still other individual differences, such as those in cognitive or “thinking” styles, may result in systematic biases for inductive (or experiential) approaches to problem solving over deductive (or analytic) approaches (Epstein, Pacini, Denes-Raj, & Heier, 1996).
The extent to which these individual differences are expressed within analytic work products, such as forecasting, is unclear. Additionally, it is unclear how (or if) these distal, domain-general individual differences and dispositions (i.e., personality) express themselves independently of domain-specific competencies, such as analytic aptitudes (i.e., numeracy, mathematic expertise, etc.), that are more proximal to analyst products, such as forecasting outcomes. It may be the case, for example, that these dispositions show less expression in the actual forecast but influence the more subjective elements of forecasting, such as the confidence placed in forecasts.
These questions have important bearing on how best to utilize and interpret information from psychometric individual difference measures, how to construct succinct and parsimonious measurement batteries that reduce the burden on test takers and developers, and overall, how best to provide an effective means to model analytic behavior so as to enhance the capabilities of analyst populations through training and selection.
We leverage an extensive sample of participants (N ~1,300) enrolled in a multiyear geopolitical forecasting research program designed to development and implement a system for prediction, aggregation, display, and elicitation (SPADE). Our goal is to broadly evaluate a wide spectrum of psychometric measures of individual differences (e.g., personality, cognitive style, motivation, aptitude, etc.) and their influence on forecasting behavior, particularly, accuracy and confidence in forecasts. We report research motivated by four aims: (a) to characterize the direct influence of psychological individual difference measures and aptitude on forecasting behavior and confidence in general; (b) to determine stochastic dependencies across psychometric measures in an effort to characterize the nonredundant information provided by published measures of personality, cognitive style, and motivation; (c) to examine whether the influence of domain-general psychological individual differences measures on forecasting performance is independent of (or redundant with) domain-specific aptitude measures; and (d) to evaluate whether psychological disposition measures are competitive with aptitude measures in creating sampling criteria that might aid in samplewide mitigation of systematic biases in forecasts.
In particular, we examine the relative utility of psychological dispositions compared to aptitude measures in mitigating systematic bias in forecasting confidence that may be independent of the accuracy of forecasts. We take a multimethod approach to analysis, combining simple associative analyses with factor analysis, split-half prediction methods, and mediation analysis. This approach not only provides clarity in the interpretation of research findings but also mitigates the likelihood of interpreting false-discovery errors.
Method
Participants
We utilized a sample of enrolled participants in the SPADE project (N > 1,300) during its 1st year. The SPADE project is a longitudinal study designed to test and assess different means of aggregating forecasts for real-world events en masse for comparison with eventual actuarial, “ground-truth” data. Ultimately, this project will result in a fieldable prototype integrating a forecasting system capable of aggregating knowledge across 1,000+ analysts for heterogeneous forecasting problem sets spanning international sociological, geopolitical, and economic concerns. We recruited participants nationally through flyers, posting to professional listservs, and Craigslist advertisements. Only persons 18 years of age or older, U.S. citizens, and nonmembers of legally protected groups (i.e., incarcerated individuals, etc.) were eligible to participate. As the SPADE project is designed for assessing population-based forecasting aggregation techniques, rather than within a select demographic group, we levied no additional eligibility or special selection criteria; prospective participants self-selected into the research sample based on their interest in the procedures (i.e., forecasting), and we retained them so long as they remained active participants and responsive to elicitations for forecasts. As compensation for their continued participation and regular completion of forecasting problems in this longitudinal study, each SPADE participant is compensated $575 annually. For the research presented in this article, we included participants in analyses if they were active members of the SPADE at the time data were extracted for this research (approximately November 1, 2012).
Materials and Procedures
Participants accessed research materials through the iSPADE.net website. This interface provided alerts for new questionnaires for them to complete, new forecasting questions for them to answer, and optional research studies that they might participate in.
Forecasting
We presented forecasting questions to participants on a monthly basis; these were largely provided by the sponsoring funding agency (see Acknowledgements) and based upon real-world global events (i.e., elections, market behavior, conflicts, etc.) in the interest of international economic or foreign policy concerns. In this respect, the sponsor selected all forecasting questions independently of our research sample demographics and questionnaire batteries (see Questionnaire Batteries section). We elicited forecasts in either binary (yes/no; true/false) or multiple-choice format depending on the nature of the question. Examples of forecasting questions include the following:
Before April 13, 2012, will the Turkish government officially announce that the Turkish ambassador to France has been recalled?
Will Italy restructure or default on its debt by December 31, 2011?
For each forecasting question, participants indicated their expectation of the outcome and entered their level of confidence (as a percentage; see Figure 1). We allowed participants to update their expectations (and confidence levels) for a given forecast question as often as they wished, up until the point the question was resolved and a ground-truth answer was available. Forecasting results, both discrete and aggregated, are used solely for the purposes of research and testing the efficacy and accuracy of aggregation techniques. For the purposes of the research presented here, only forecasts with binary-answer choices are included for analysis.
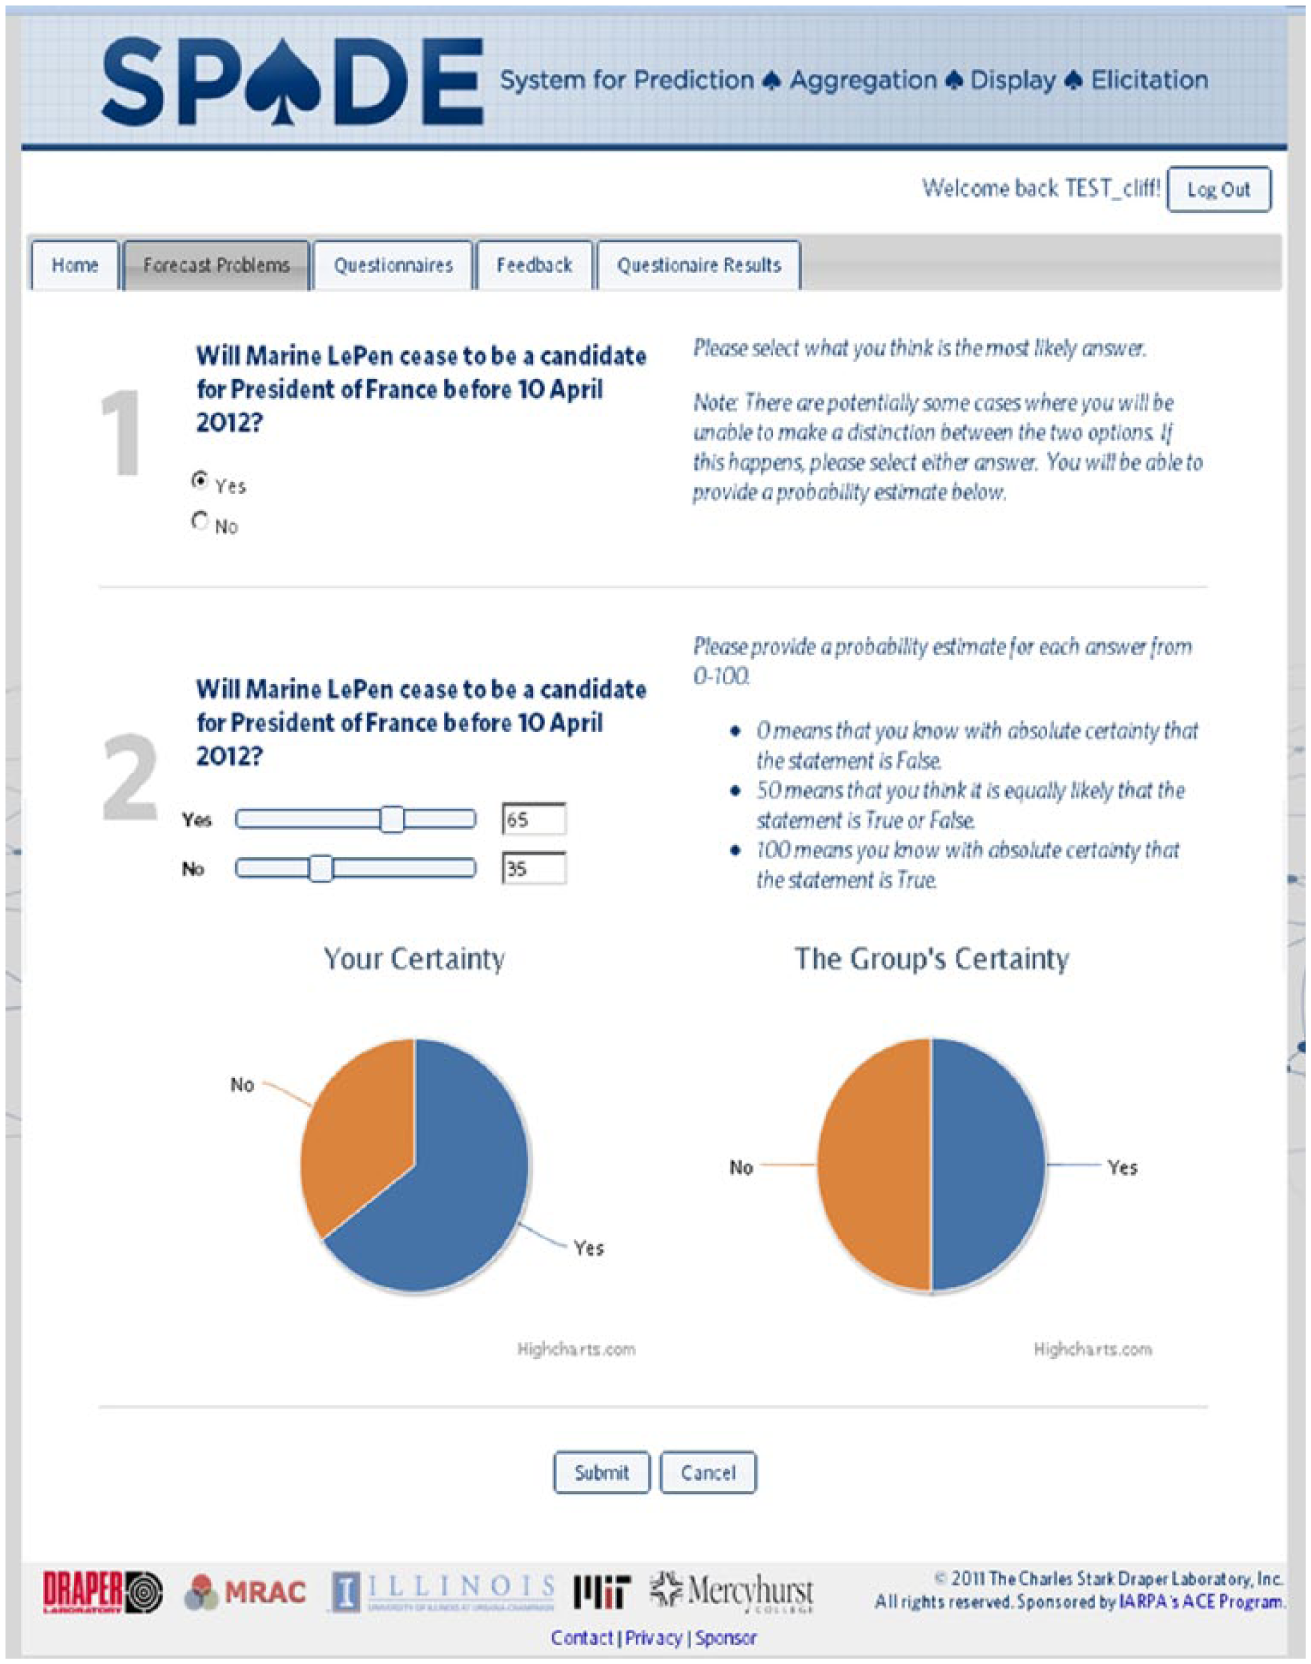
The iSPADE elicitation system. Each participant is given access to the iSPADE website, which alerts them to uncompleted, or current, forecasting questions and questionnaire batteries. Forecasting through the system involves both the question and a measure of confidence for each response choice.
Describing forecasting behavior
As this work focuses on understanding the impact of individuals’ differences in forecasting behavior, we utilized the Brier score (Brier, 1950) as our measure of forecast accuracy. Brier scores provide a clear illustration of the potential impact of individual differences on forecasting behavior and subsequent inferences made from this behavior. First, the Brier score is preferable to raw accuracy alone (i.e., sum of correct forecasts) as it reflects forecasters’ accuracy in terms of (a) expected outcomes and (b) confidence (expected probability) placed in expected outcomes. In this respect, confidence in expected outcomes is taken as analogous to the quality, credibility, or availability of data available to the forecaster or sample. However, should individual differences systematically bias confidence, aggregation efforts to establish the “true” frequency distribution of information could be dramatically undermined.
The Brier score is the mean squared error of the probability forecast over the outcome according to the following equation:
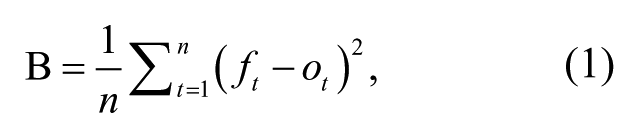
where n is the number of possible outcomes, t is the identifier, ft is the forecast probability, and ot is the actuarial event outcome at instance t.
Brier scores reflect the squared deviation between predicted probabilities for a set of events and the actuarial outcomes for each elicitation (response/update) of a forecast question, averaged across the total number of elicitations; low values, less than 0.5, indicate accuracy above chance. Brier scores were computed for each participant for each unique forecast. To reduce the complexity and simplify the nesting structure of our data for this research on generalized analytical forecasting performance, we aggregated across participants’ Brier scores on all answered forecasts. This method provides a single index of each participant’s forecasting ability, independent of the number of forecasting questions they responded to and the number of times they updated these forecasts. In addition to a single aggregated index of forecasting ability, we also computed Brier score indices across different subtypes of forecast questions: election outcomes and changes in leadership, economics and market trends, international relations and agreements, and military conflicts. Independently, we performed the same operation for participants’ confidence scores, associated with each elicitation, to provide an index of their confidence in their forecasts on average.
Questionnaire batteries
Participants completed an intake questionnaire at the onset of their tasking. Measures were distributed across six batteries and could be taken separately to reduce participant fatigue. All questionnaires were self-paced and administered via links to SurveyMonkey.com surveys hosted on the iSPADE system. Questionnaires included a range of demographic questions (e.g., age, sex, education, self-reported SAT scores). Additionally, personality and motivation inventories were included, such as measures of “Big Five” personality traits (Big Five Inventory [BFI]; John, Donahue, & Kentle, 1991)—Neuroticism (e.g., anxiety, indecision, volatility), Extraversion (e.g., outgoingness, social approach), Openness to Experience (e.g., open-mindedness, consideration of alternatives), Agreeableness (e.g., friendliness, approachability, acceptance), and Conscientiousness (e.g., thoroughness, vigilance). We also included measures of appetitive/aversive motivation (behavioral inhibition system/behavioral avoidance system scales [BIS/BAS]; Carver & White, 1994) and cognitive style assessments, such as inductive-intuitive and deductive-rational approaches to analysis (Rational-Experiential Inventory [REI], Hedgehog vs. Fox, Cognitive Style Index [CSI]; see Kozhevnikov, 2007, for review), as well as measures of motivated cognition—Need for Cognition (NFC; Cacioppo, Petty, & Kao, 1984) and Need for Closure (NFCL; Kruglanski, Webster, & Klem, 1993; Roets & Van Hiel, 2011).
Participants also completed both subjective and objective measures of aptitude, including subjective measures of numeracy or comfort with mathematical operands (Subjective Numeracy [SNS]; Fagerlin et al., 2007), short-form problem-solving sets requiring inhibitory control (Cognitive Reflections Test [CRT]; Frederick, 2005), and analogy, mathematical reasoning, and logic problem-solving questions taken from sample “practice” SAT/GRE items publicly available online (see supplementary material for complete list of problems). Finally, participants answered multiple-choice word problems related to analytical reasoning at the intersection of economic judgment and numeracy (i.e., sunk cost fallacy, conjunction fallacy, etc.; cf. Kahneman & Tversky, 1983; see supplementary material for complete list of items). Scaling, completion rates, and scale reliabilities for all individual difference and aptitude measures are presented in Table 1.
Descriptive Statistics and Composite Scale Reliabilities for Variables Used
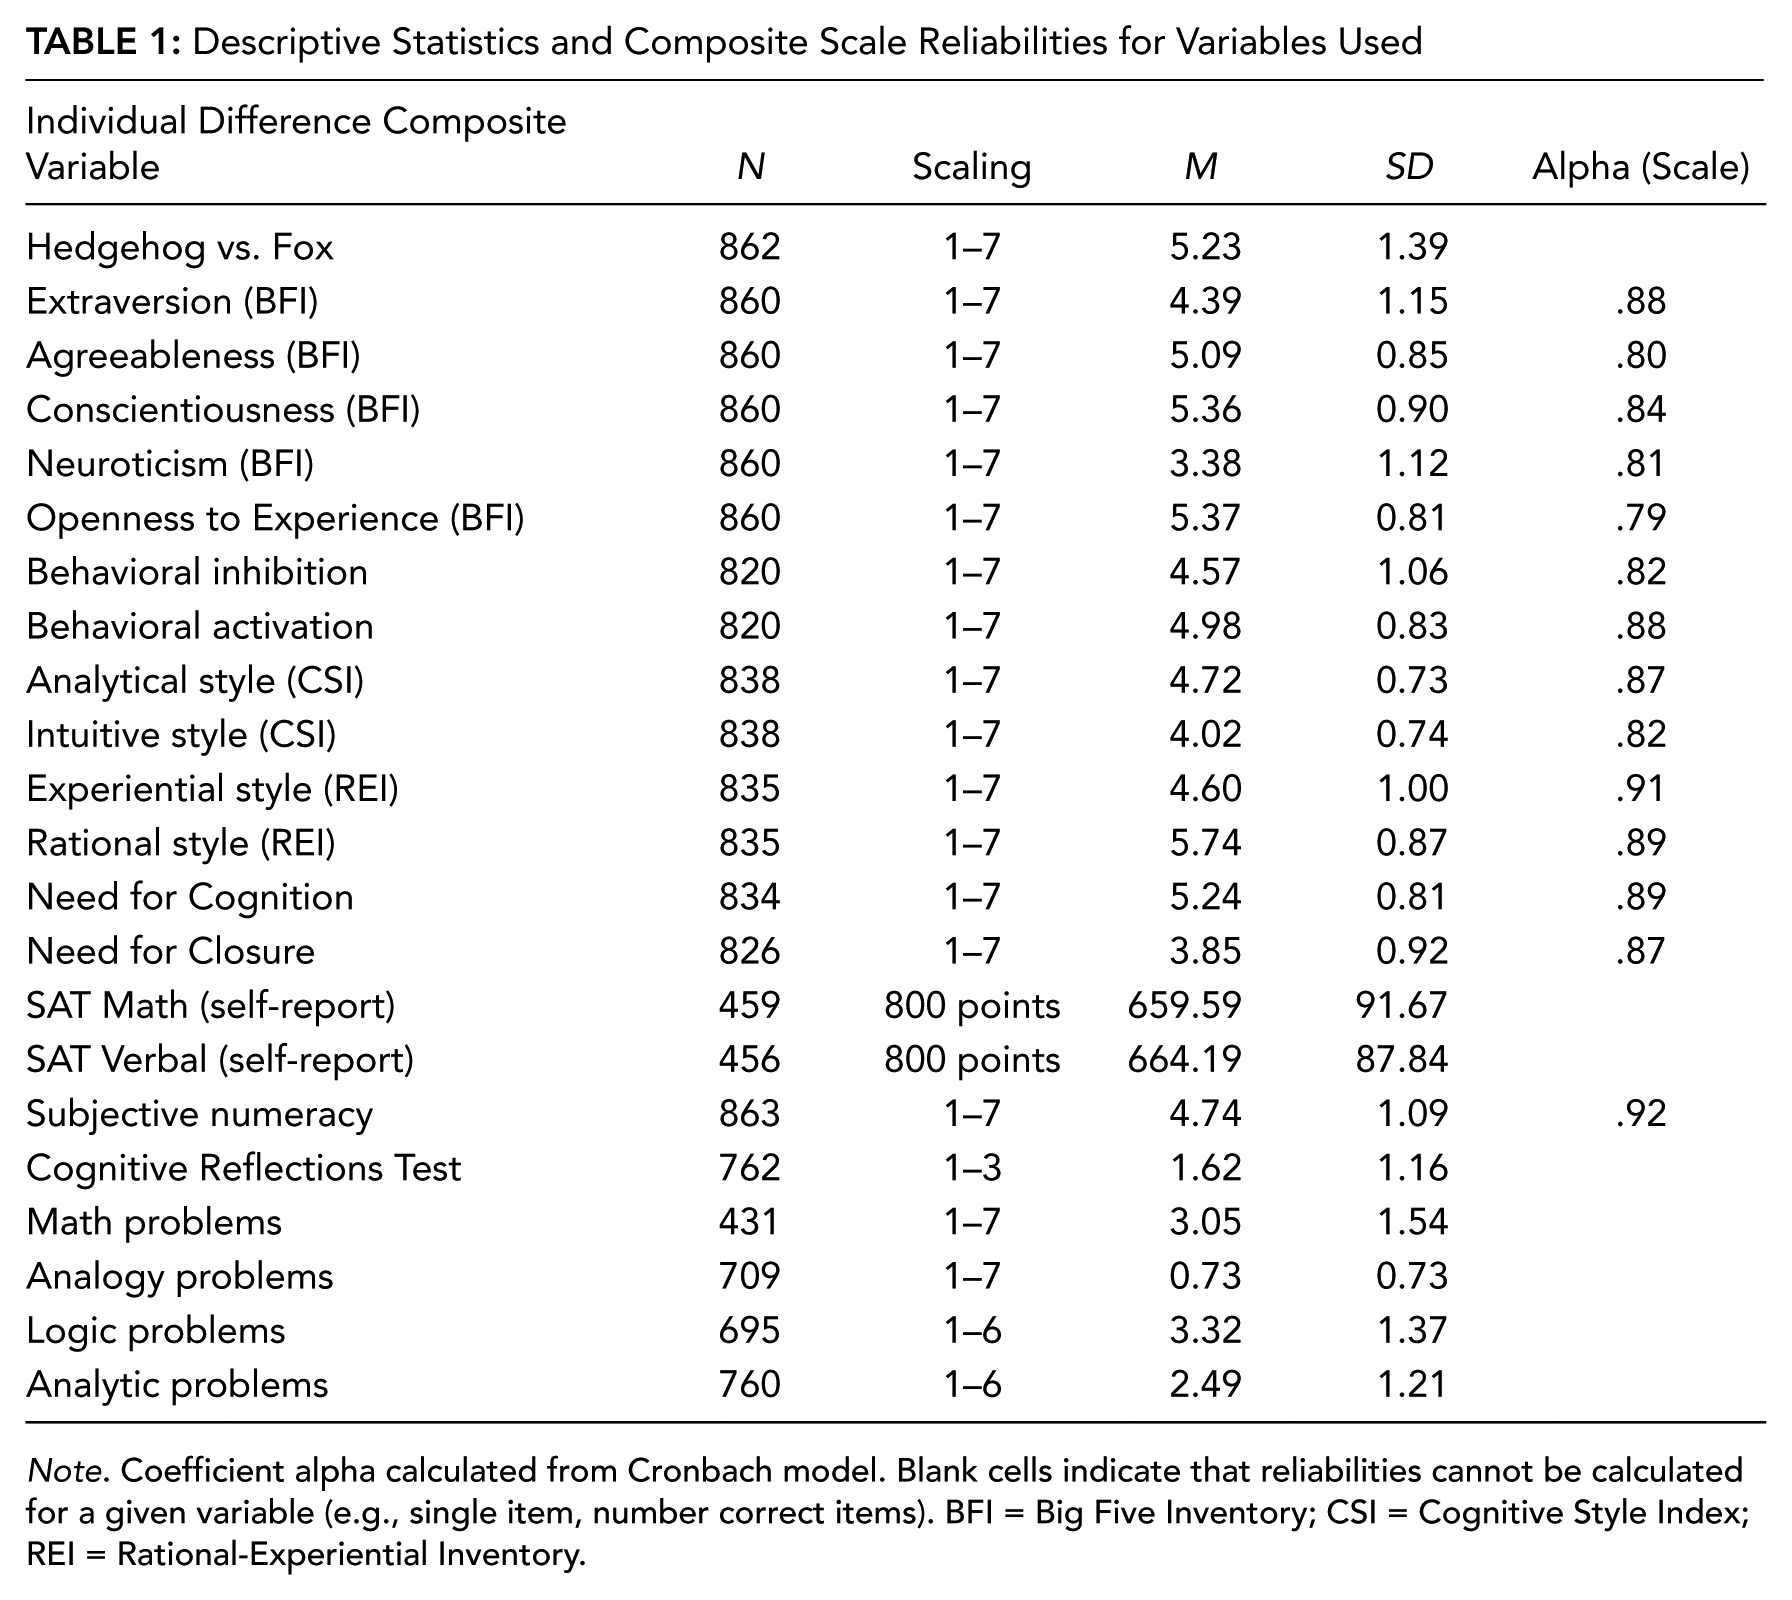
Note. Coefficient alpha calculated from Cronbach model. Blank cells indicate that reliabilities cannot be calculated for a given variable (e.g., single item, number correct items). BFI = Big Five Inventory; CSI = Cognitive Style Index; REI = Rational-Experiential Inventory.
Results
Sample Characteristics
Of the nearly 1,300 SPADE participants, we included 927 in this research sample if they completed intake questionnaires and at least one forecasting question during the 1st year of the project. Due to missing or incomplete data (i.e., questionnaire or forecasting data), sample sizes for most analyses ranged from 800 to 860 participants. Of reporting participants, 37.2% were female. 76.7% were Caucasian, 5.1% were Asian, and 4.3% were of African descent. On average, participants were 36.91 years of age (range = 64 years, SD = 13.32 years), and 14% of participants reported receiving formal training in intelligence analysis. The sample was generally educated above the high school level with 32.7% at a BA level, 32.3% at the MA level, and 18.8% holding a professional (e.g., MD, DDS, JD) or doctorate degree (e.g., PhD, EdD). Participants reported an average SAT Math score of 653.14 (SD = 100.18) and SAT Verbal score of 664.11 (SD = 98.160).
Out of 129 forecasting questions, participants answered 45.94% (SD = 25.7%). Although beyond the scope of the present study, there were no apparent systematic trends (to date) indicating that failure to respond is due to the content of forecasts (i.e., geographic region of interest, etc.). The average Brier score across forecasts in sample was .45 (SD = .11), and average confidence across forecasts was 70% (SD = 7%). For perspective, a Brier score of 0 indicates perfect forecasting performance, and a score of 0.5 indicates guessing at chance. The relatively high average Brier score of participants was indicative of the difficulty and format (i.e., binary questions) of forecasting questions.
Simple Direct Effects
For each individual difference and aptitude measure of interest, we calculated the simple bivariate (Pearson with pairwise deletion) correlation coefficient to describe its linear relationship with forecasting accuracy and forecast confidence (see Tables 2 and 3; see also supplementary material for cross-correlations across all study measures).
Direct Effects of Personality Measures on Forecasting Behavior
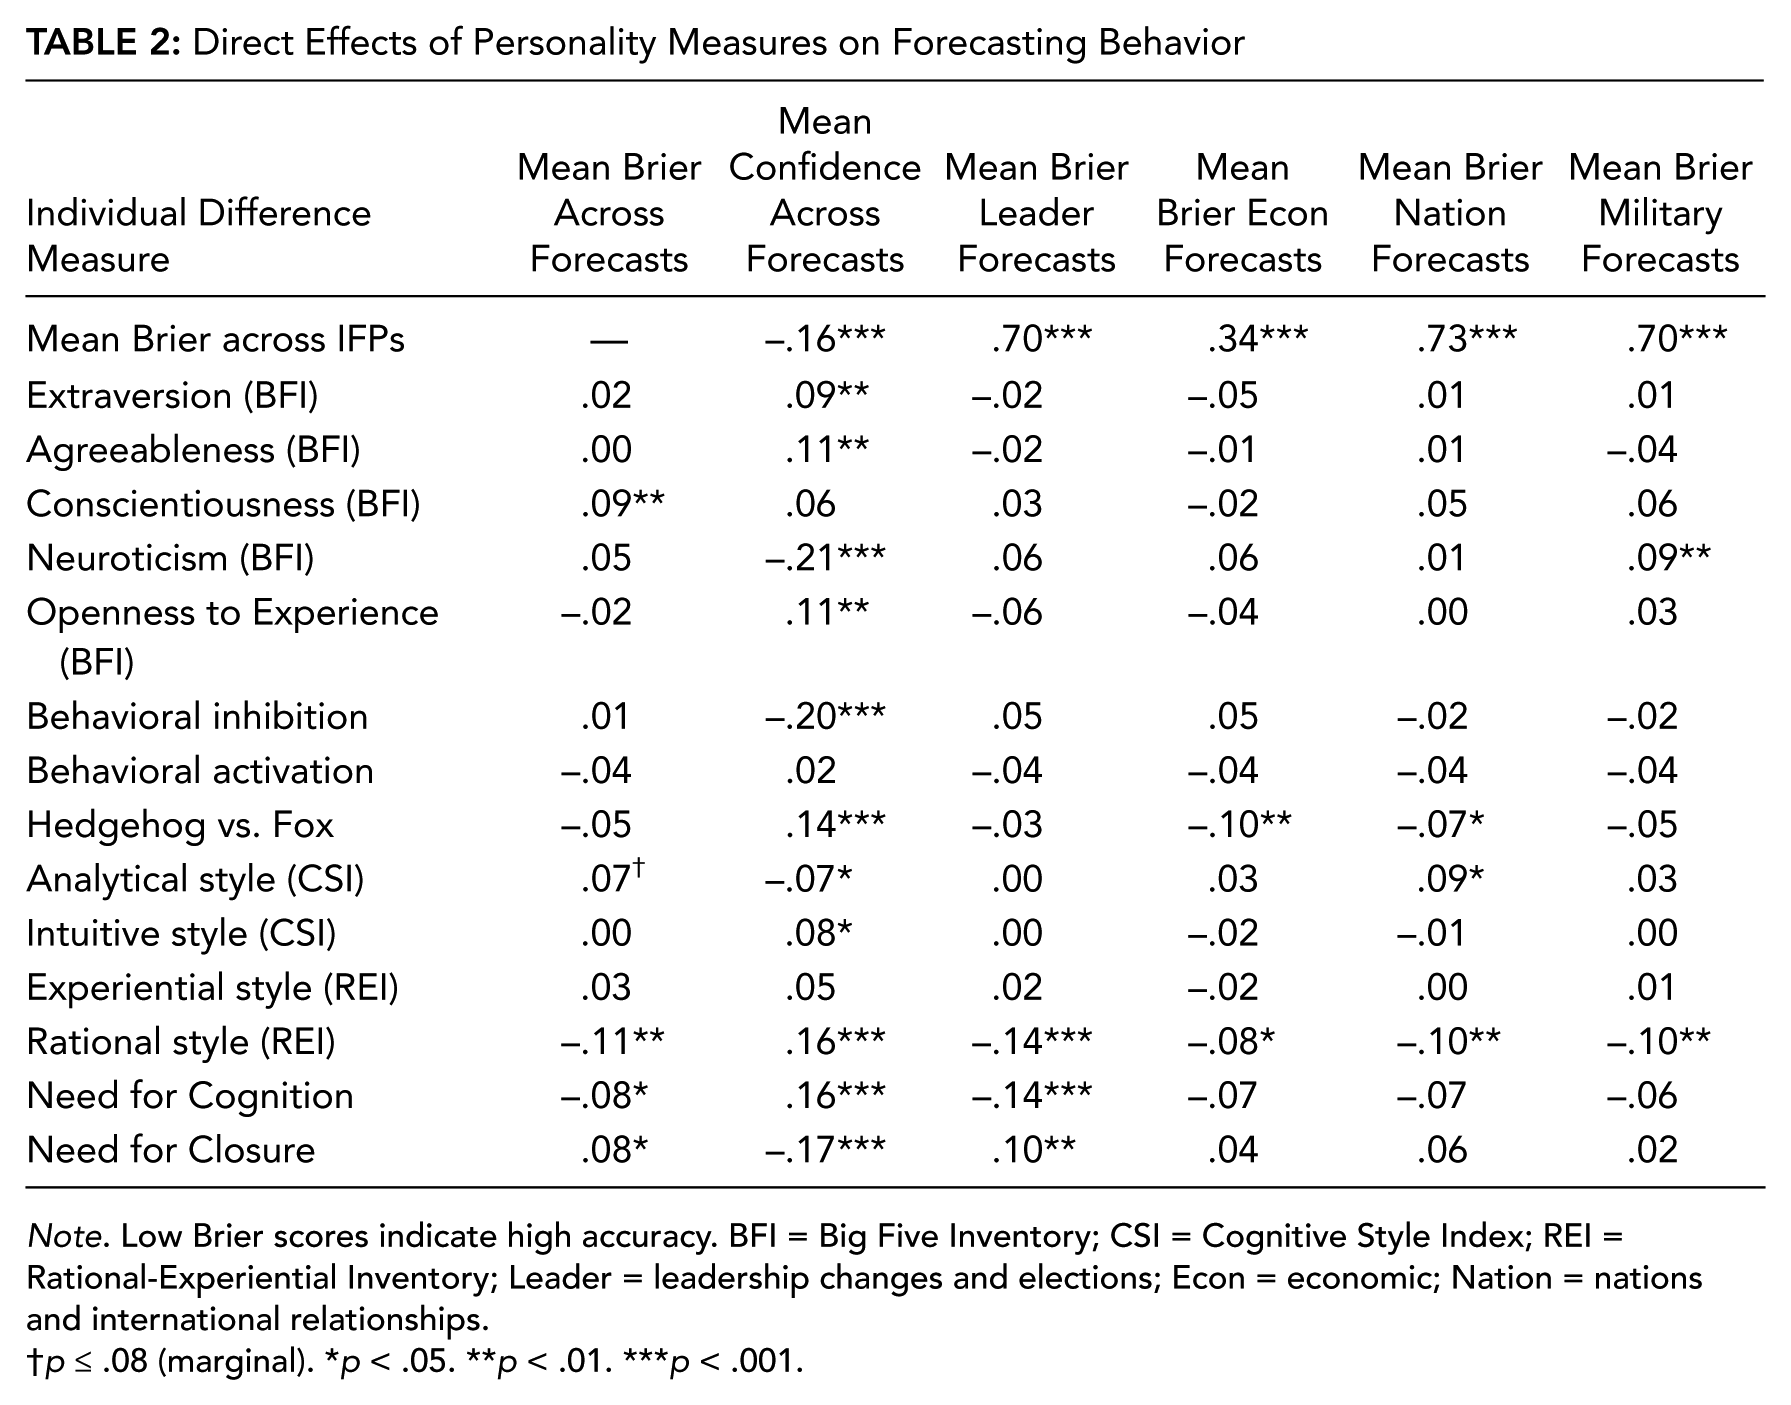
Note. Low Brier scores indicate high accuracy. BFI = Big Five Inventory; CSI = Cognitive Style Index; REI = Rational-Experiential Inventory; Leader = leadership changes and elections; Econ = economic; Nation = nations and international relationships.
p ≤ .08 (marginal). *p < .05. **p < .01. ***p < .001.
Direct Effects of Analytic Aptitude Measures on Forecasting Behavior
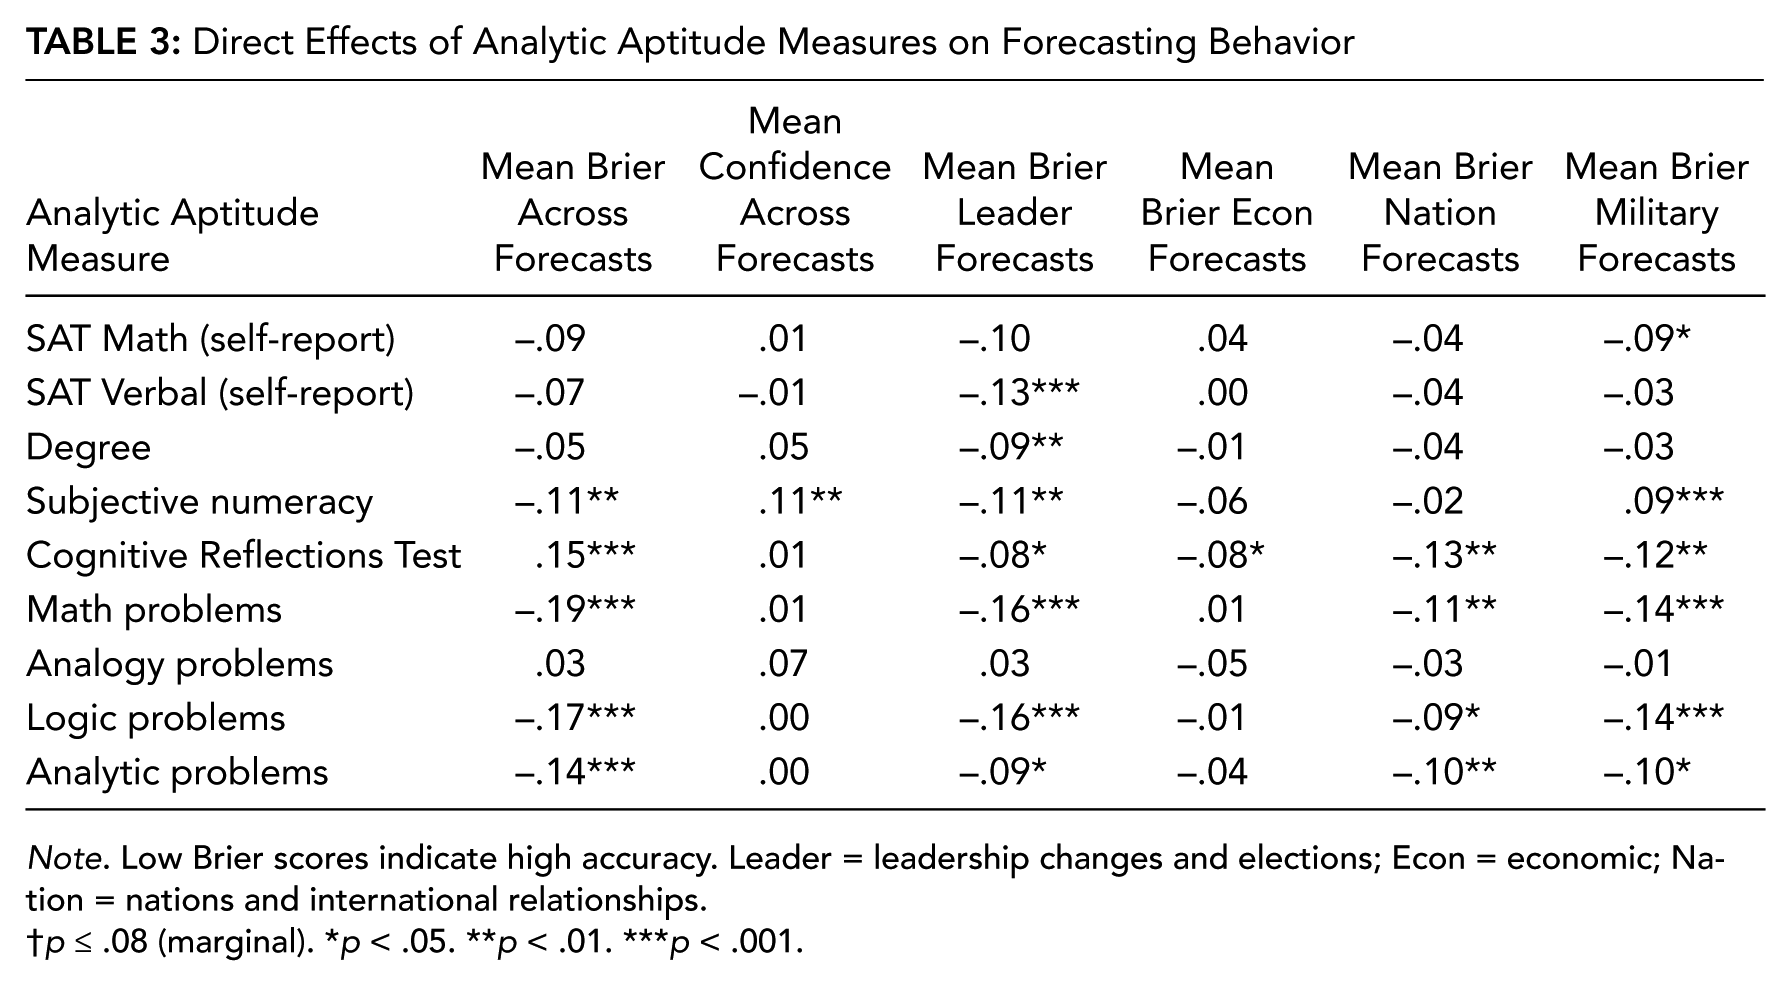
Note. Low Brier scores indicate high accuracy. Leader = leadership changes and elections; Econ = economic; Nation = nations and international relationships.
p ≤ .08 (marginal). *p < .05. **p < .01. ***p < .001.
Personality
We observed weak correlations (<.30; see Table 2 for effects) between all Big Five personality facets (Extraversion, Agreeableness, Conscientiousness, Neuroticism, Openness) and forecast accuracy (Brier scores). We found similar results with both behavioral activation and inhibition motivations. Of these measures, only Conscientiousness predicted (lower-than-average) forecasting accuracy. However, other personality measures were significant predictors of confidence; Extraversion, Agreeableness, and Openness were associated with higher-than-average confidence. Neuroticism and behavioral inhibition predicted lower-than-average confidence.
Cognitive style
We also observed few and weak effects (<.30; see Table 2 for effects) between different measures of “bottom-up” (i.e., intuitive, experiential) and “top-down” (i.e., analytical, rational) cognitive styles or motivated cognition (i.e., NFC, NFCL) and forecasting accuracy. However, both NFC and the Rational (i.e., top-down) subscale of the REI predicted higher-than-average forecasting accuracy. The NFCL was associated with lower-than-average forecasting accuracy. A number of items were related to forecasting confidence, specifically, the Hedgehog vs. Fox item and CSI Intuitive, REI Rational, and NFC scales were associated with higher-than-average forecasting confidence. The CSI Analytical and NFCL scales were associated with lower-than-average forecasting confidence.
Aptitude tests
Comparatively, we found many more, and larger, correlation coefficients in associations between aptitude tests and forecasting accuracy (see Table 3)—only self-reported SAT scores (both Math and Verbal tests) and analogy problem sets were unassociated with higher-than-average forecasting accuracy. However, of these aptitude measures, only participants’ self-reported comfort with numeracy (SNS) was associated with (higher-than-average) forecasting confidence indexes.
Dimension Reduction
To make analysis of direct effects more interpretable and reduce the number of items required to elucidate meaningful trends, we performed an extensive exploratory factor analysis of distal individual difference measures (all personality and cognitive style measures described earlier). Factors were extracted with principal axis factoring method under the criteria that they produce eigenvalues greater than 1. Given the procedures, all missing data were assumed to be randomly distributed (i.e., we did not anticipate that any group of subjects would omit answers disproportionately compared to others) and were handled with listwise deletion (analysis, n = 810). Resulting factors were obliquely rotated (promax method), given little reason to assume that resulting factors would be independent of one another (see Figure 2 for scree plot; see Table 4 for factor loadings).
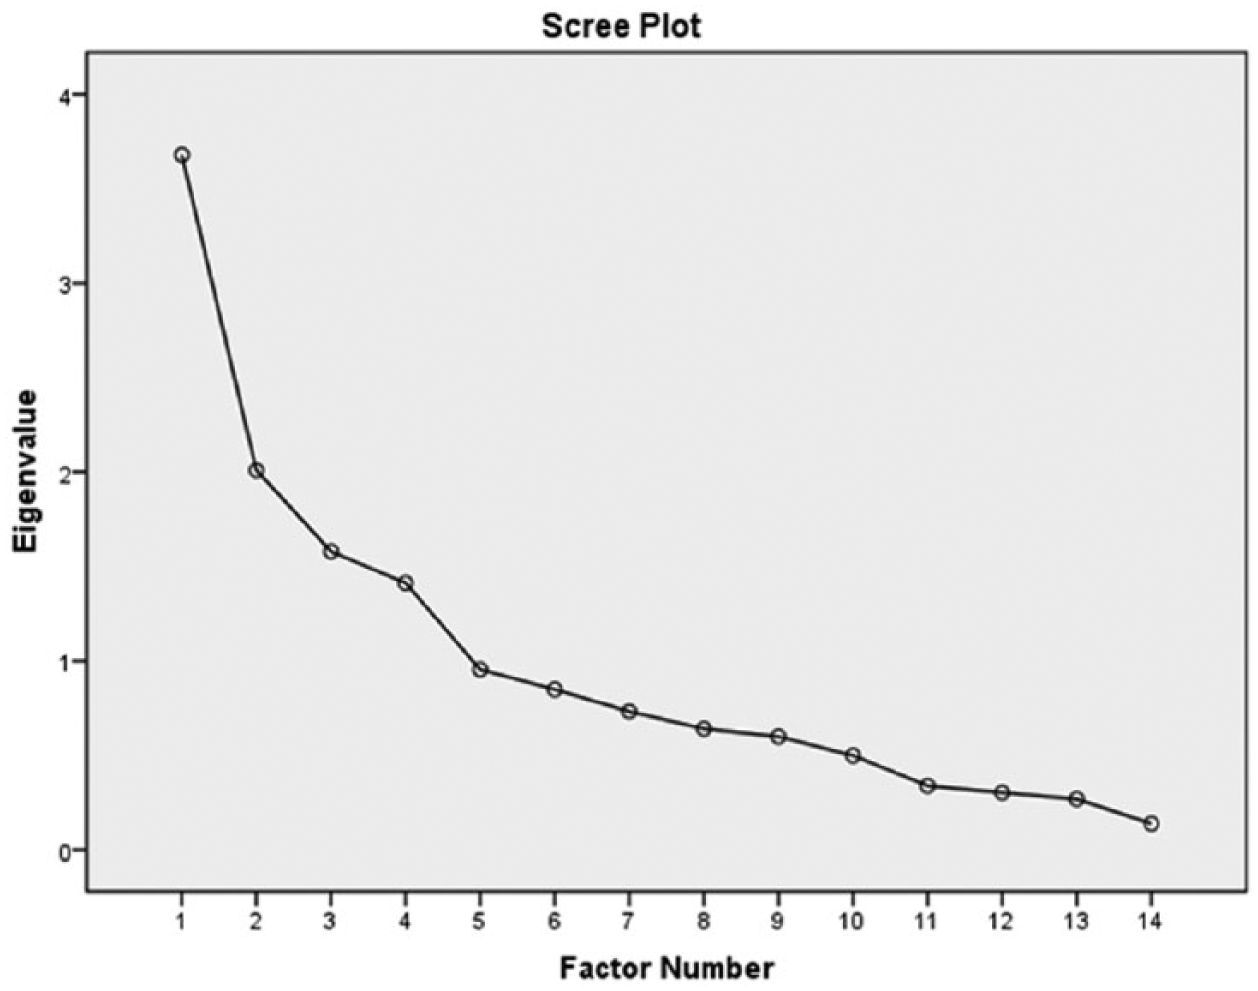
Scree plot from factor analysis.
Factor Analysis Results: Individual Difference Measures
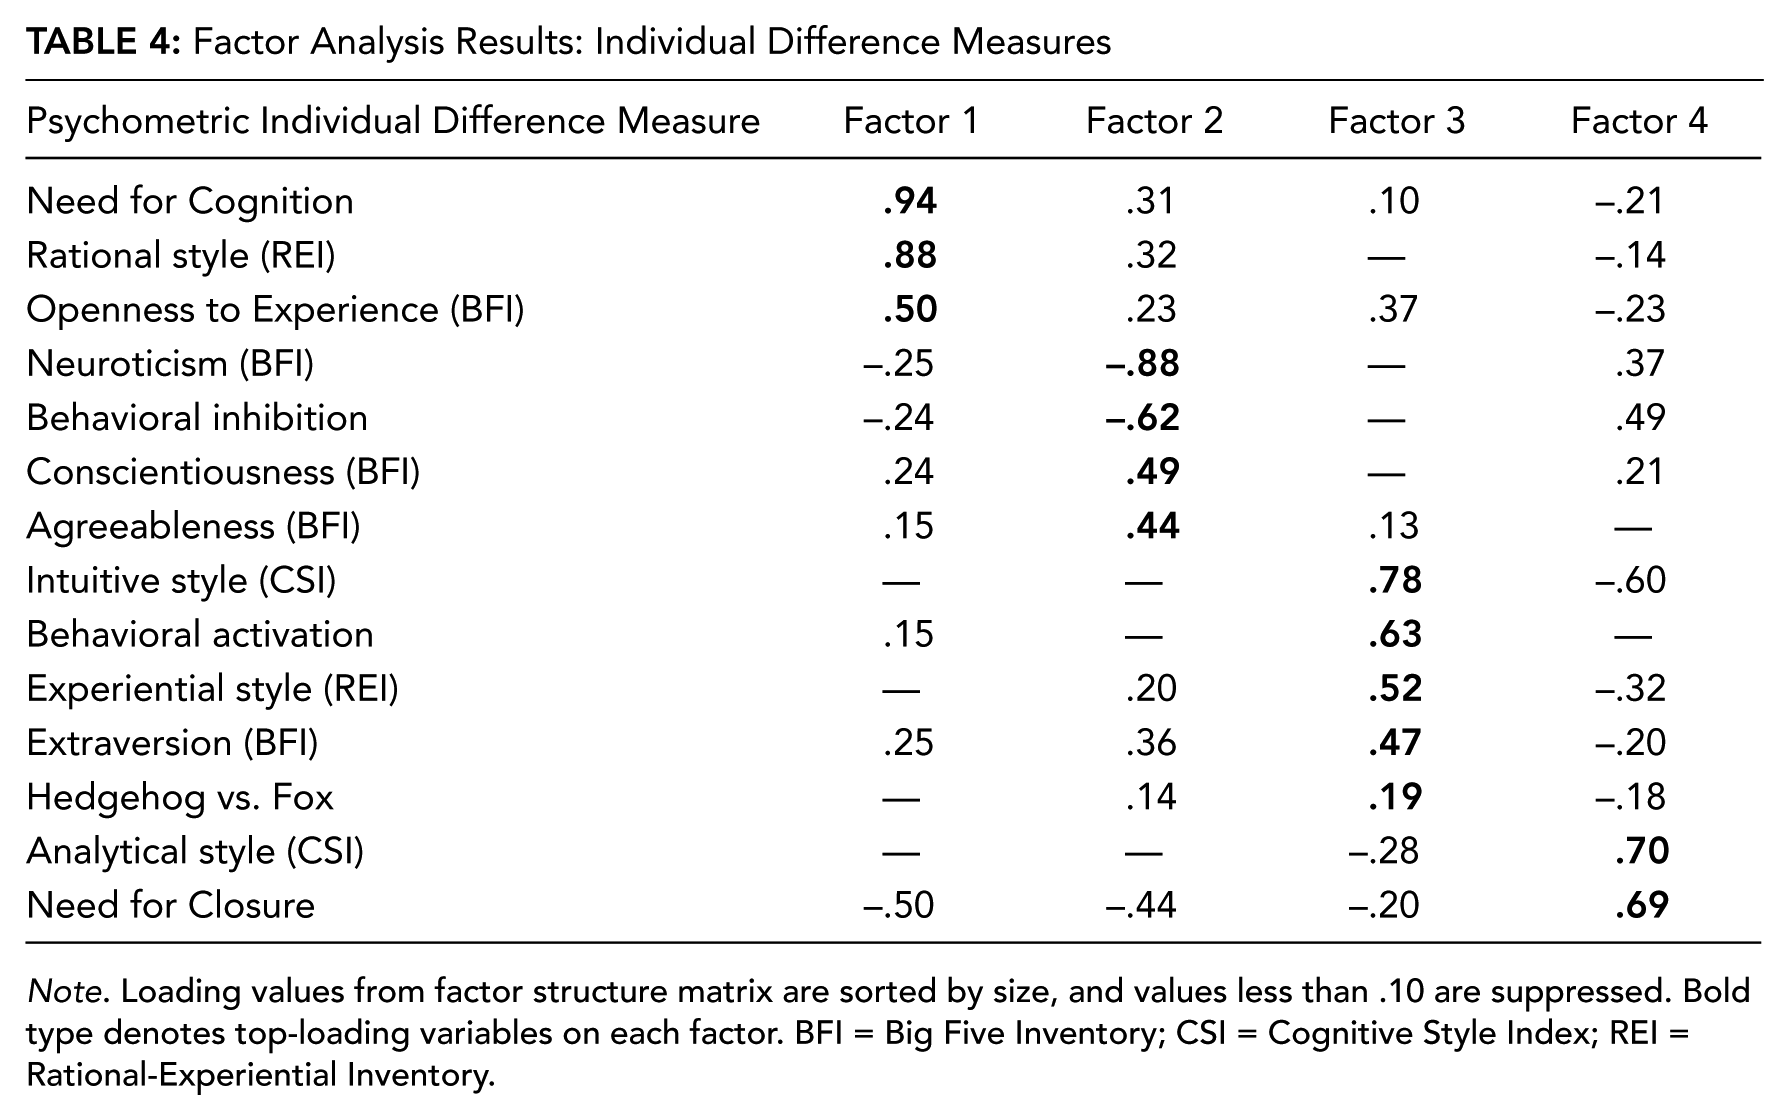
Note. Loading values from factor structure matrix are sorted by size, and values less than .10 are suppressed. Bold type denotes top-loading variables on each factor. BFI = Big Five Inventory; CSI = Cognitive Style Index; REI = Rational-Experiential Inventory.
Factor analysis produced a four-factor solution, accounting for 49.98% of the total variance (see Figure 2), and the rotational variance of each factor accounted for between 10% and 15% of variance. This result suggested that the factor solution was stable given the number of extracted factors relative to the degrees of freedom available. A few patterns emerged: (a) All cognitive style measures that reputedly tap into inductive-intuitive approaches to problem solving loaded with behavioral activation tendencies and extraversion (Factor 3), and (b) measures reputed to tap into deductive-analytical approaches to problem solving loaded on two different factors (Factors 1, 4), which highlighted fine distinctions between them characterized by co-loadings with motivated cognition and personality measures. Specifically, one deductive style (REI Rational; Factor 1) was characterized by a need for cognition and openness to experience, whereas the other (CSI-Analytical; Factor 4) was characterized by a need for closure and co-loads with behavioral inhibition (Table 4).
Following dimension reduction, regressive factor scores were extracted for each participant and correlated (Pearson) with both aptitude measures and forecasting behavior (see Table 5). Analysis revealed Factor 1 (REI Rational/NFC) scores were consistently and significantly related to higher-than-average scores across measures of aptitude and higher-than-average forecasting accuracy (lower Briers) and confidence. In contrast, an opposing pattern emerged for Factor 4 (CSI Analytic/NFCL) scores; high Factor 4 scores were associated with lower-than-average self-reported SAT Math scores and fewer correct CRT and analytical question items than average. Factor 4 scores were also related to marginally lower-than-average forecasting accuracy and forecasting confidence. Factor 2 (Neuroticism/Conscientiousness) scores were related to both high forecasting confidence and self-reported numeracy; however, they were related to fewer correct CRT, SAT Math, and analytical question items than average.
Direct Effects of Factor Scores on Forecasting Behavior and Analytic Aptitude Measures
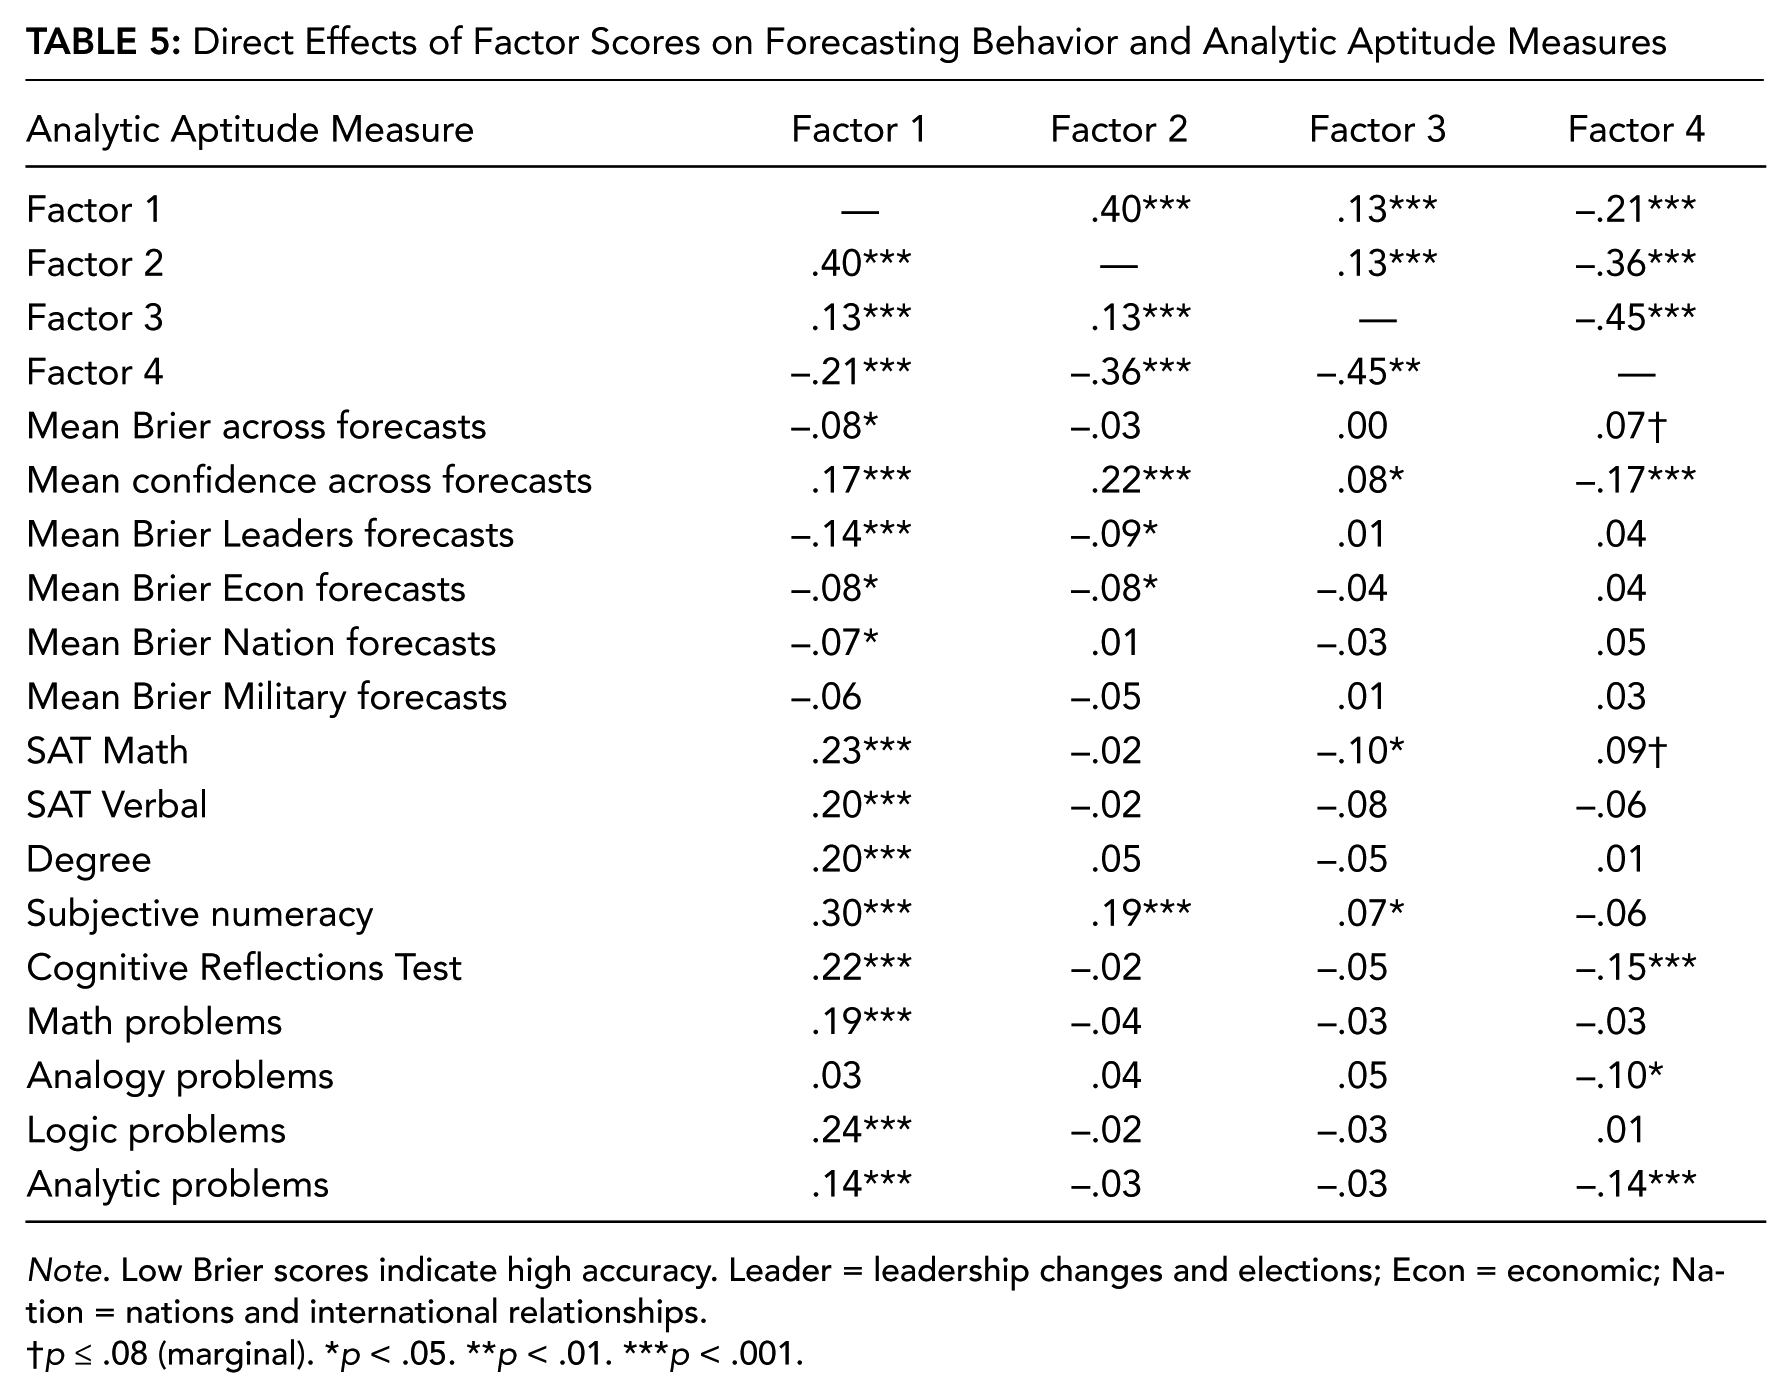
Note. Low Brier scores indicate high accuracy. Leader = leadership changes and elections; Econ = economic; Nation = nations and international relationships.
p ≤ .08 (marginal). *p < .05. **p < .01. ***p < .001.
Factor scores provide a useful means for describing high-level associations between shared variance among independent variables (i.e., personality, cognitive style) and dependent variables (i.e., forecasting accuracy and confidence). However, they represent a unique solution among the variables used in this study; a different selection of variables may result in a different solution, posing problems for generalizing these findings across studies. Therefore, we reanalyzed associations between aptitude measures and specific psychological disposition variables of interest selected from each factor reported earlier. This method allowed us to elaborate on how factors related to personality, cognitive style, and motivation might be related to specific kinds of aptitudes in a more generalizable way. From each factor, we extracted a representative variable based on factor loadings and variety: REI Rational (Factor 1), BFI Neuroticism (Factor 2), CSI Intuitive (Factor 3), and NFCL (Factor 4). We regressed all aptitude measures on each of these variables, within separate multiple regression models (not stepwise), using listwise deletion of missing data. We find that self-reported numeracy (SNS) was an independent predictor of REI Rational (b* = .28), t(310) = 4.70, p < . 001; BFI Neuroticism (b* = −.16), t(313) = −2.46, p < .05; CSI Intuitive (b* = .12), t(310) = 1.87, p = .06; but not NFCL (b* = −.10), t(307), p = .12. Only REI Rational scores (Factor 1) were independently predicted by measures of scholastic achievement, particularly, SAT Verbal scores (b* = .21), t(310) = 3.37, p < .01, and degree obtained (b* = .14), t(310) = 2.54, p = .01. Neuroticism (b* = .15), t(313) = 2.16, p < .05, was the only predictor related to the number correctly answered math problems. The number of correct CRT items was inversely related to NFCL scores (b* = −.19), t(307) = −2.66, p < .01. Finally, only REI Rational scores were associated with performance on logic problem sets (b* = .11), t(310) = 1.92, p = .06.
Collinearity Between Predictors of Forecasting Accuracy and Confidence
We next examined whether the influence of psychological dispositions (i.e., cognitive style) on forecasting performance is independent of (or redundant with) the influence of more proximal, domain-specific aptitudes (i.e., numeracy, analytic aptitude, mathematical aptitude, etc.). To accomplish this analysis, we subjected representative variables with direct effects on both forecasting accuracy and confidence, of which there were only two—REI Rational (Factor 1) and NFCL (Factor 4)—to multiple regression models in which these variables were regressed against overall forecasting accuracy and confidence with aptitude measures that also evidenced direct effects with forecasting accuracy—SNS, CRT, and math, logic, and analytic problems. This procedure resulted in four regression models (see Tables 6 and 7), again using listwise deletion of missing data. Results indicated that the REI Rational scale was not an independent predictor of forecasting accuracy (b* = −.04), t(588) = −.90, ns, and collinear with aptitude variables in the model. However, the NFCL scale was moderately independent of aptitude variables in predicting forecasting accuracy (b* = .08), t(583) = .19, p = .06. Both the REI Rational scales (b* = .18), t(588) = 4.05, p < .001, and NFCL scale (b* = −.22), t(583) = −5.34, p < .001, were independent predictors of forecasting confidence, whereas measures of aptitude were not independent predictors.
Independent Effects of REI Rational Cognitive Style on Forecasting Accuracy and Confidence
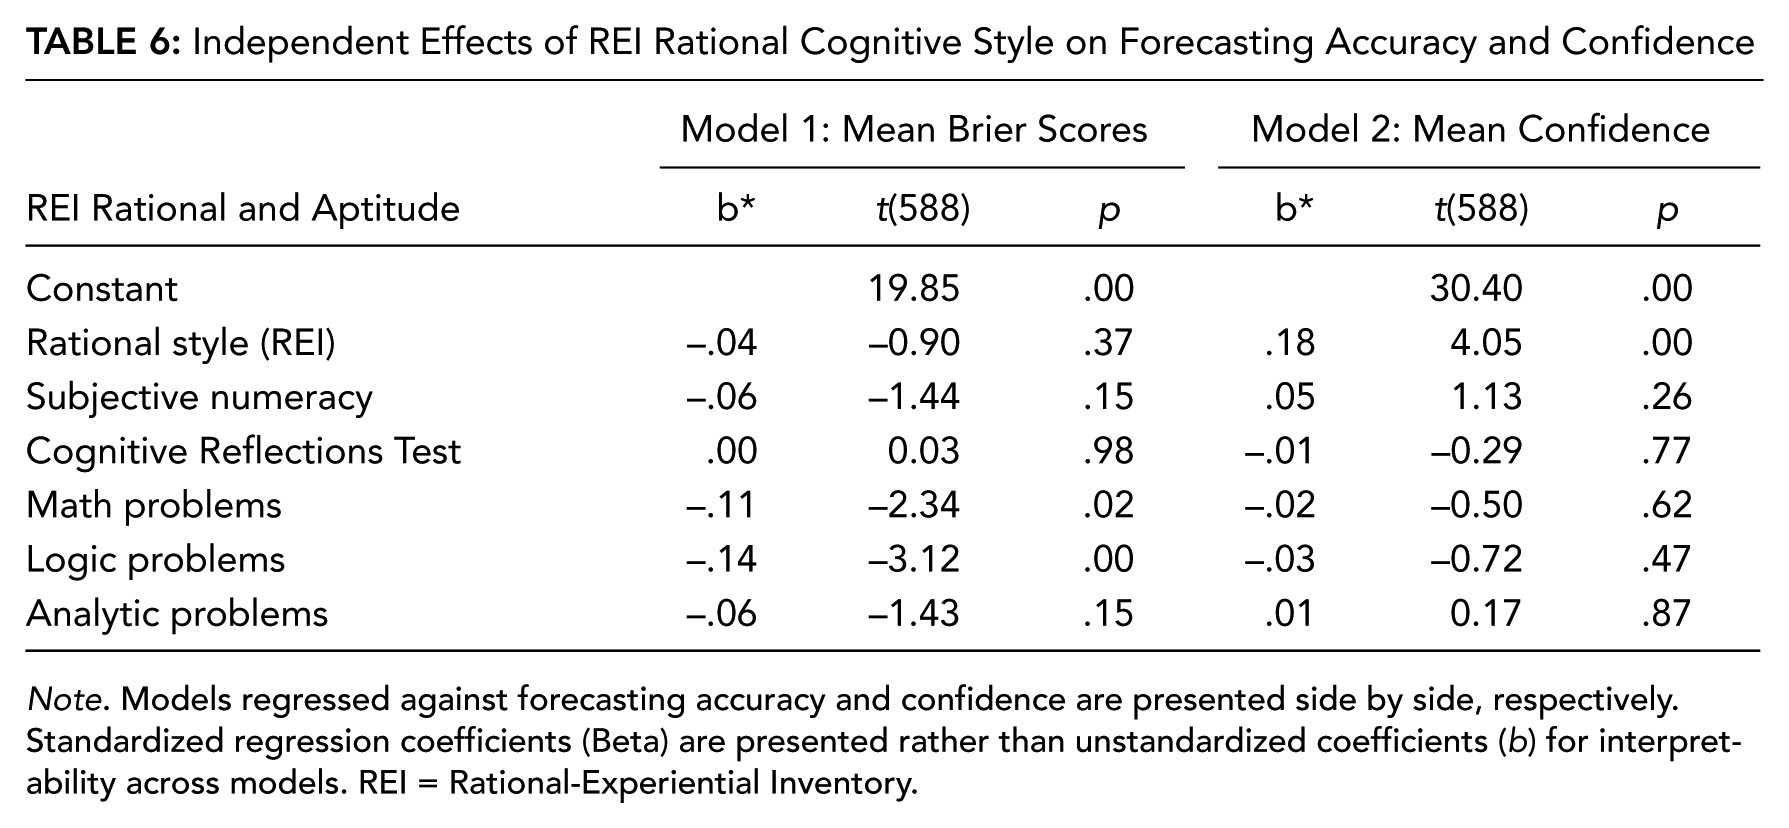
Note. Models regressed against forecasting accuracy and confidence are presented side by side, respectively. Standardized regression coefficients (Beta) are presented rather than unstandardized coefficients (b) for interpretability across models. REI = Rational-Experiential Inventory.
Independent Effects of Need for Closure on Forecasting Accuracy and Confidence
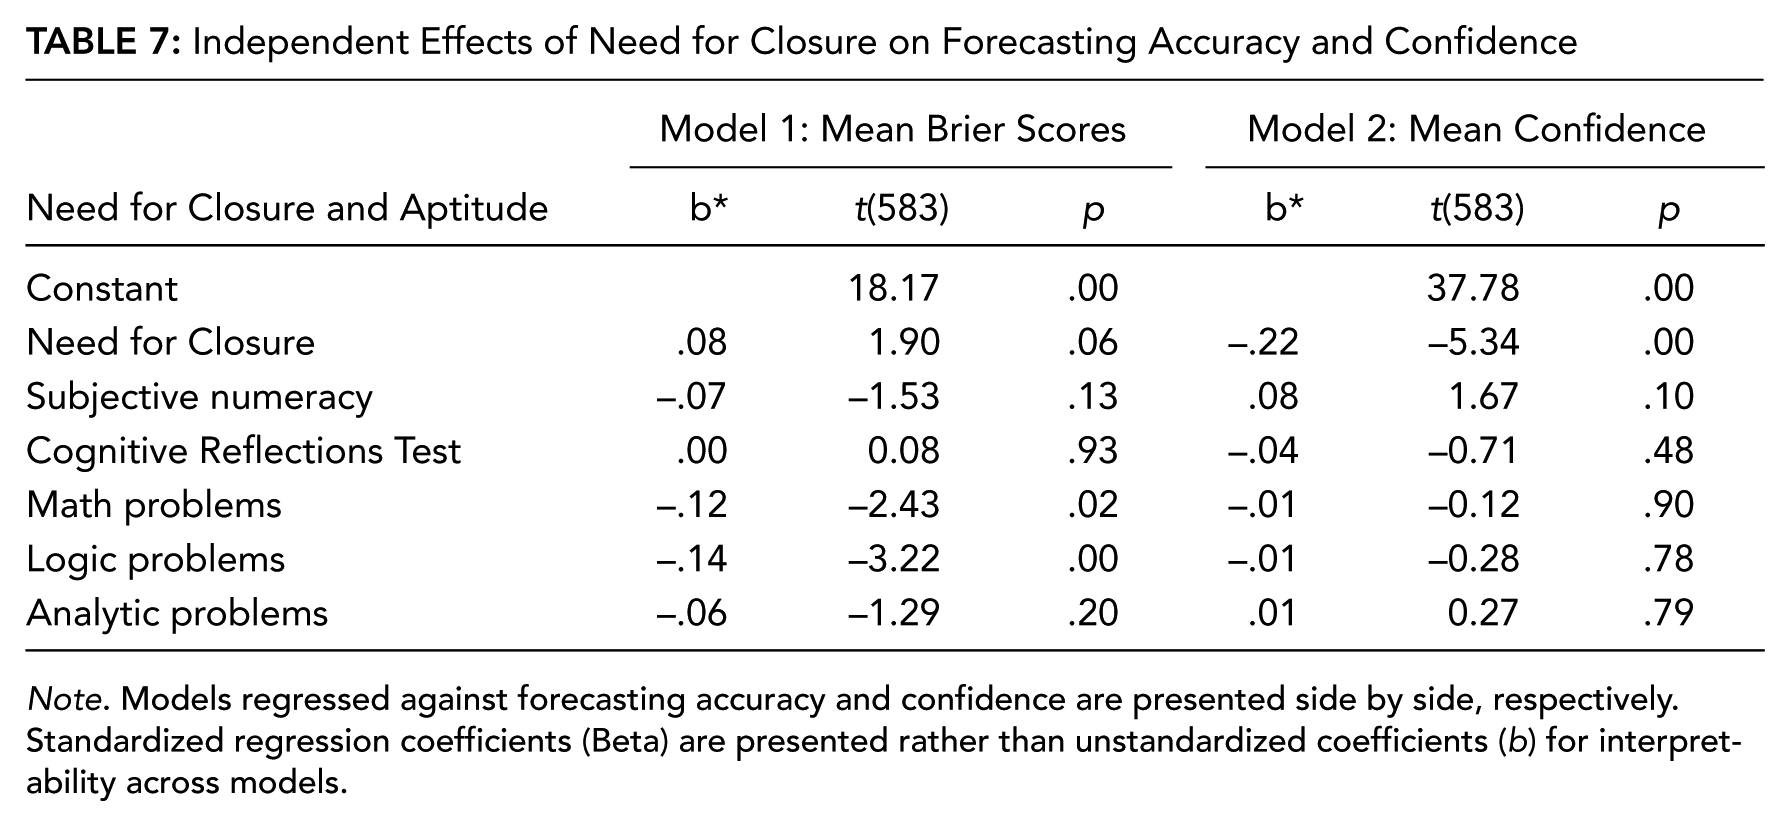
Note. Models regressed against forecasting accuracy and confidence are presented side by side, respectively. Standardized regression coefficients (Beta) are presented rather than unstandardized coefficients (b) for interpretability across models.
To further explicate the associations between psychological dispositions, aptitude, and forecasting performance, we conducted simple mediation analysis (Sobel method; Sobel, 1982). For each mediation model, we investigated whether the direct effects between either REI Rational or NFCL and forecasting accuracy were mediated by either an aptitude measure or forecasting confidence; specific variables included within each model were selected based on analysis of direct effects between aptitude, psychological disposition variables, and forecasting behavior. Only aptitude variables with direct relationships on both cognitive style variables (REI Rational, NFCL), and forecasting behavior (accuracy, confidence) were selected. This procedure resulted in four mediation models (see Figure 3).
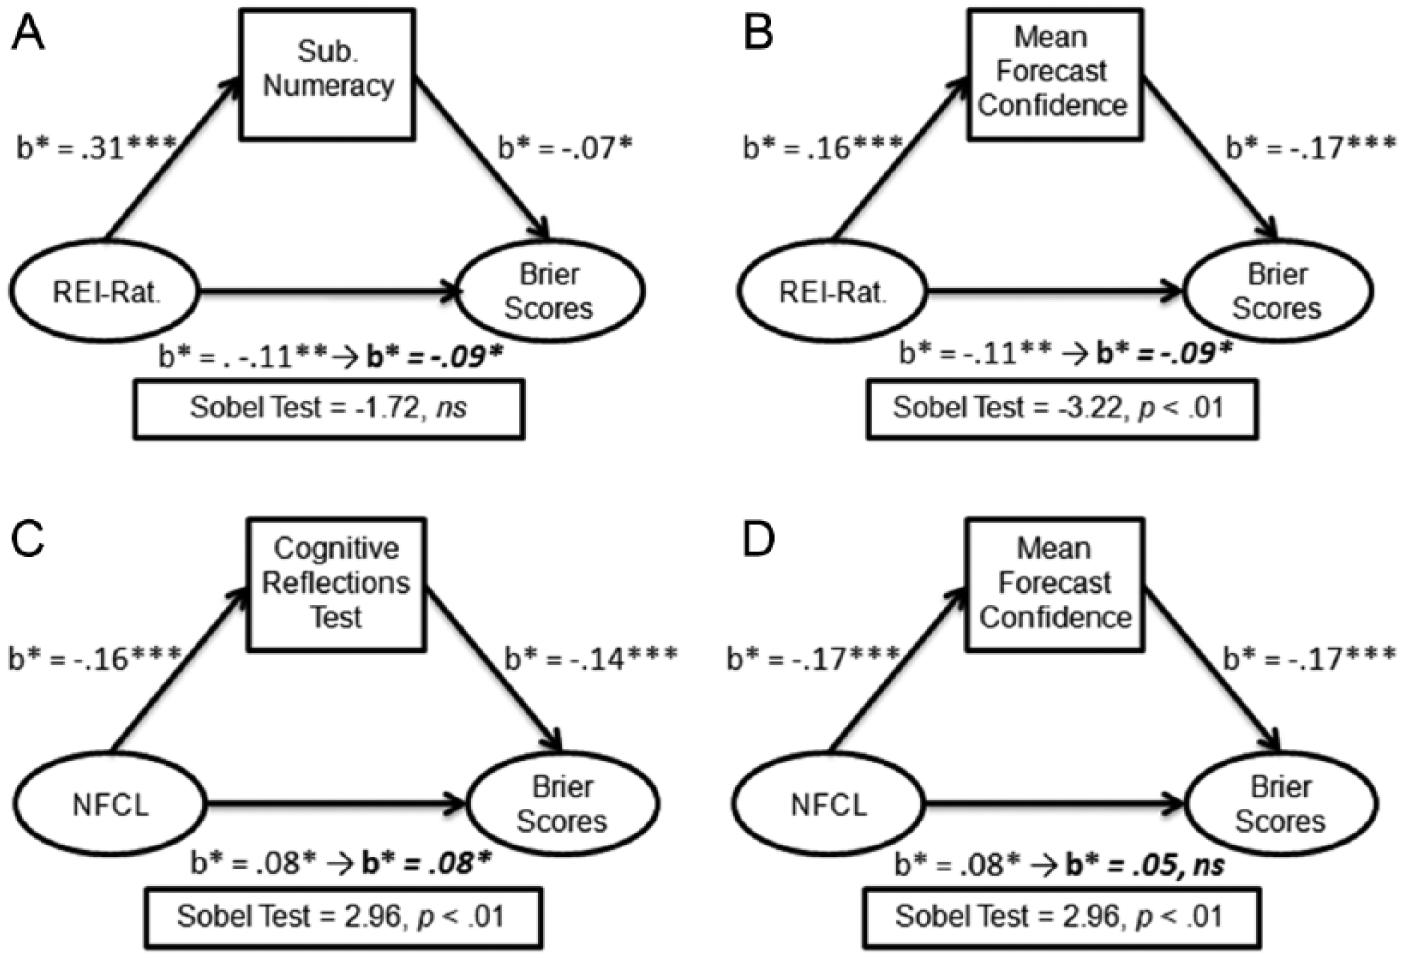
Results of mediation analysis of direct effects between facet variables and forecasting accuracy. (A) Mediation model depicting the direct relationship between Rational-Experiential Inventory (REI) Rational scale scores and Brier scores as mediated by Subjective Numeracy Scale. (B) Mediation model depicting the direct relationship between REI Rational scale scores and Brier scores as mediated by forecasting confidence. (C) Mediation model depicting the direct relationship between Need for Closure scale scores and Brier scores as mediated by Cognitive Reflections Test scores. (D) Mediation model depicting the direct relationship between Need for Closure scale scores and Brier scores as mediated by forecasting confidence. Coefficients following the → denote Beta weights in direct effects accounting for mediating variable. *p < .05. **p < .01. ***p < .001.
For the first model, we selected SNS scores as a mediator of REI Rational scores, given a strong direct effect between the former and Factor 1 scores (see Table 5). For the second model, forecasting confidence was entered as a mediator of REI Rational scores. Results indicated no evidence of a mediating effect of SNS on the direct effect of REI Rational score and forecasting accuracy (Sobel = −.172, ns; Figure 3A) and evidence of only partial mediation for forecasting confidence on the effect of REI Rational scores and forecasting accuracy (Sobel = −3.22, p < .01; Figure 3B). For the third, CRT scores were selected as a mediator of the direct effect between NFCL scores and forecasting accuracy on the basis of a strong direct effect between CRT and Factor 4 scores (see Table 5); forecasting confidence was entered as a mediator for the fourth model. Results show that whereas CRT scores only partially mediated the effect of NFCL on forecasting accuracy (Sobel = 2.96, p < .01; Figure 3C), forecasting confidence fully mediated this effect (Sobel = 3.27, p < .01; Figure 3D).
Sampling Criteria
Given associations between individual differences in personality, analytic style, aptitude, forecasting accuracy, and confidence, we next examined how this information might be leveraged to improve forecasting sample selection—whether individual difference measures might be effective in distinguishing subgroups within the larger sample that differ significantly in forecasting behavior. Specifically, given that Brier scores are susceptible to fluctuation driven by confidence estimates alone, we examined whether these measures might make useful selection criteria for discriminating between subsamples: those that might distinguish between groups that differ in forecasting accuracy but not in confidence. In this way, we attempted to mitigate the likelihood that systematic differences in confidence due to factors other than information and analytic competence (i.e., personality) contribute to accuracy differences. Additionally, we examined the trade-offs between potential improvements to forecasting information and overall sample size reduction.
In order to develop sampling criteria and test their efficacy and reliability in improving forecasting accuracy independent of confidence, we borrowed from “spilt-half” methods for scale constructions and evaluation of internal consistency (Crocker & Algina, 1986; John & Benet-Martinez, 2000). We randomly sampled 50% of “valid” cases (i.e., no missing data on psychological disposition measures used for sampling criteria), effectively splitting the data set into two smaller subsets (n = 405 each): one for development and initial testing of sampling criteria and the second to establish the reliability of sampling criteria. We found no significant effects of sample when tested for differences in forecasting accuracy, t(808) = −.76, p = .45, and confidence, t(808) = −.94, p = .35, between the two samples.
In developing sampling criteria, we used self-reported SAT scores (Math and Verbal), problem-solving sets, and variables selected from data reduction as simple sampling criteria. For each criterion, we used independent-samples t tests to compare Brier scores and confidence between independent samples created by separating the bottom 25th percentile from the rest of the sample or the top 25th percentile from the rest, in the case of Neuroticism and NFCL. Selection of the 25th percentile as a cutoff point was motivated to balance sample size with the removal of individuals with aptitudes and trait profiles associated with low forecasting accuracy. Additionally, we attempted more complex selection criteria derived from our data reduction efforts, particularly, findings related to systematic differences within analytic styles, forecasting accuracy, and confidence. We therefore created a filter designed to select the top and bottom quartiles of respondents’ average confidence ratings. Within the top quartile of confidence, we filtered out those respondents in the lower 25% of REI Rational scores. Within the bottom quartile of confidence, we filtered out those respondents in the top 25% of NFCL scores. In this respect, we attempted to use our initial findings to define criteria to separate those least likely to be accurate from those most likely, given their confidence. These criteria were tested in one of the two data subsets. Of the 11 criteria, testing at the 25th percentile resulted in four successful sampling criteria that produced subsamples with significantly better forecasting accuracy without significantly different confidence; namely, the SNS, the CRT, and logic test results emerged as successful criteria within the subset of data.
Next, we investigated different selection criteria using the same measures but comparing between the top 80th and bottom 20th percentiles of scores on each measure (these were again reversed for Neuroticism and NFCL). Similarly, we reconstructed criteria built from a combination of REI Rational scores and NFCL scores, this time using the top (NFCL) and bottom (REI) 20th percentile, within the bottom and top 25th percentiles of confidence scores, respectively. Given earlier findings using the 25th percentile as criteria, we anticipated that extreme scores and variability at the tails of each measure’s distribution would be more likely to influence forecasting accuracy and confidence than would scores closer to the mean. Using these criteria, we found that sampling criteria using the SNS, the CRT, and SAT Math questions produced marginally significant (p < .08) improvements in subsample-wide forecasting accuracy without significant change in confidence. However, sampling criteria built from a combination of REI Rational and NFCL measures produced significant different (improved) subsamples in forecasting accuracy, t(403) = −2.30, p < .05, but not confidence, t(403) = .09, p = .93.
From the two sets of analyses to develop sampling criteria, we selected the best sampling criteria. These included SNS scores, CRT scores, and logic test scores (using 25th percentile cutoff criteria) and the combined REI Rational and NFCL sampling criteria (using the 20th percentile cutoff criteria). We analyzed the performance reliability of these criteria in the second subsample. The only variables that were reliable in producing subsamples with significantly different (improved) forecasting accuracy but no differences in confidence criteria were the CRT, taccuracy(403) = −2.51, p < .01; tconfidence(403) = .25, p = .80; and combined REI Rational and NFCL criteria, taccuracy(403) = −2.1, p < .05; tconfidence(403) = .40, p = .41. These selection criteria, as well as unsuccessful ones, were then tested within the whole sample (N = 810). Results are summarized in Figure 4. Overall, we found that the performance of both reliable criteria—CRT and combined REI Rational and NFCL—generalized to the entire sample. Of these, the latter produced the largest effect: an increase of 8% in sample accuracy beyond unselected cases, compared to the former, which produced a 5% improvement beyond unselected cases. We also found that compared to the CRT criteria, our complex filter, inspired by empirical findings with respect to REI Rational and NFCL, was also more precise in that in produced larger effect sizes and removed fewer cases (n = 76 cases removed) compared from analysis than the other (n = 179 cases removed; see Figure 4).
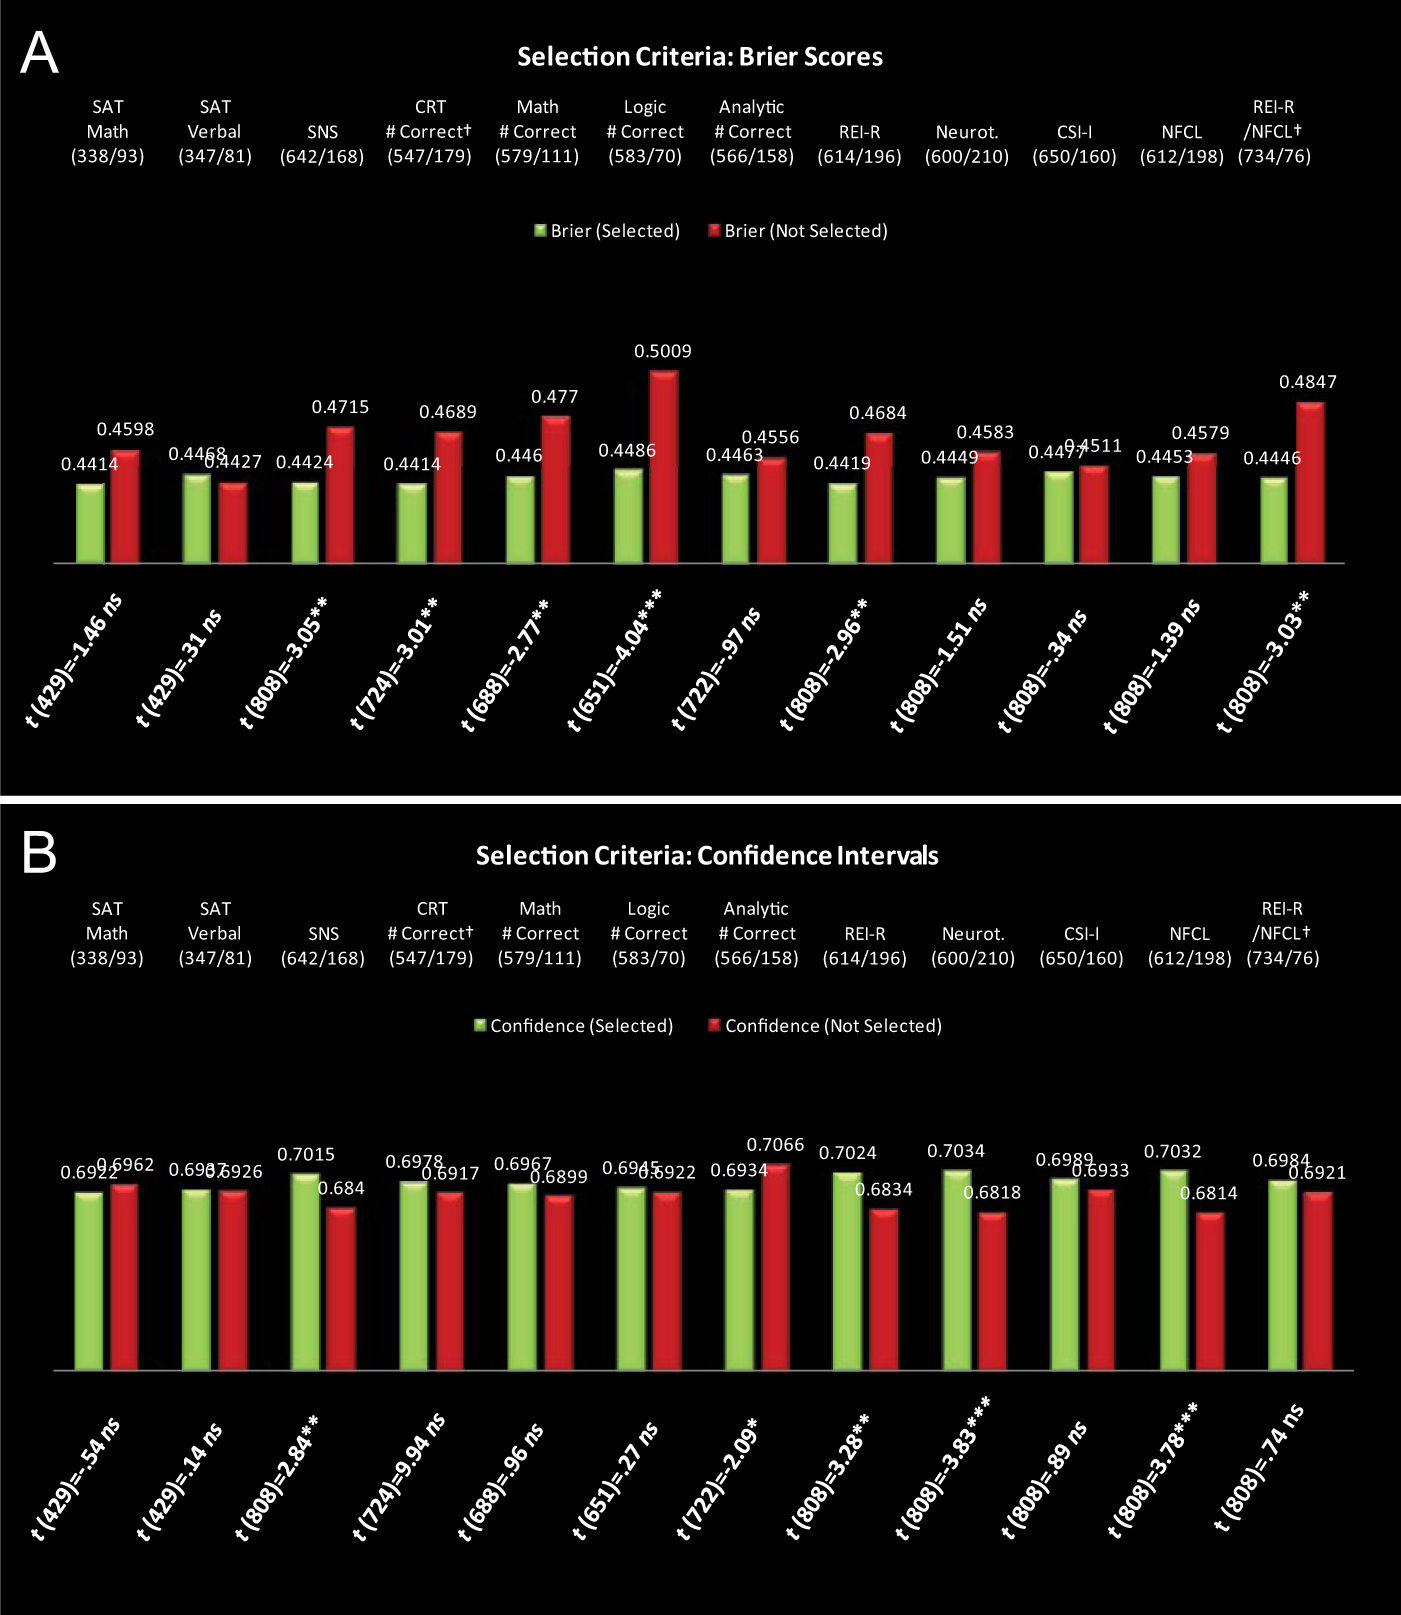
Results of sampling criteria comparison. (A) Mean differences between subsamples created by each selection criteria (horizontal axis). Green bars are mean Brier scores across participants selected by criteria; red bars are mean Brier scores across participants not selected by criteria. T test statistics are presented beneath bars. Low Brier scores indicate increased accuracy. (B) Mean differences between subsamples created by each selection criteria (horizontal axis). Green bars are mean confidence scores across participants selected by criteria; red bars are mean confidence scores across participants not selected by criteria. T test statistics are presented beneath bars. Sampling criteria were judged based on whether they improved accuracy with no change to confidence. † at variable name denotes reliable criteria that replicated results across both subsamples. *p < .05. **p < .01. ***p < .001.
Conclusions
Overall, our findings demonstrate utility for leveraging psychometric measures of individual differences to reveal core competencies and systematic biases in analytic domains. First, we find reliable trends suggesting that whereas measures of aptitude (e.g., math, analytic problem solving) are stronger predictors of forecasting accuracy, personality and cognitive style variables were better predictors of forecasting confidence. This finding suggests that whereas analytic aptitudes are indeed better predictors of accuracy, psychological dispositions influence the more subjective aspects of forecasting, as expected. Second, we find that measures of personality, cognitive style, motivated cognition, and motivational focus reduce to four interpretable dimensions. Factor scores extracted from two of these dimensions predicted diametrically opposed patterns of forecasting behavior and analytic aptitude—REI Rational scores and NFCL scores predicted high aptitudes and high confidence, and low aptitude and low confidence, respectively. We also find evidence suggesting different pathways through discrete aptitudes that these two dimensions might influence forecasting performance. However, their influence on forecasting performance was mediated through forecasting confidence. Finally, we demonstrate that measures of psychological dispositions may be competitive with measures of aptitude insofar as they may be used as sampling criteria to increase sample forecast accuracy while removing bias in forecast confidence. These findings have a number of important implications for the application of personality psychology and psychometrics and the basic science.
Among our most interesting findings is that measures of psychological dispositions appear to be relatively poor surrogates for predicting forecasting accuracy compared to measures of analytic aptitude. This finding is not altogether surprising, given that the aptitudes captured by our measures—analytic, logical problem solving, mathematical competency, numeracy—have more proximal application to core analytic skill sets and tradecraft, in general. Personality, cognitive style, and motivation, in contrast, represent domain-general dispositions that are further removed from analytic skill sets. Our findings suggest that these dispositions may find clearer expression in the confidence associated with forecasting. Collectively, our findings suggest that participants reporting a preference for a top-down analytic approach to problem solving and a motivation to solve complex problems for the sake of the problems’ resolution (i.e., high need for closure) evidence both lower accuracy and confidence in their forecasts; in this case, low confidence mediates the link between these dispositions and forecasting accuracy.
In contrast, we find an opposing pattern in those participants reporting a similar top-down analytic (or rational) approach to problem solving but instead being motivated toward problem solving because of a perceived intrinsic value in complex problem solving. In this case, we find more direct pathways of influence on forecasting accuracy, suggesting that psychological dispositions are diffusely convolved with core analytic aptitudes; individuals expressing this pattern may show more confidence in their forecast as a reflection of their diffuse intellectual competencies.
Our finding that psychological dispositions predict better the confidence placed in forecasts than their accuracy is reminiscent of findings in other domains of psychological inquiry. For example, a wide range of basic research findings highlight the myriad effects of framing the evaluation of motivational outcomes and their pursuit. A normative propensity for people to generally frame goals—whether they be social (Gable & Poore, 2008) or intellectual (Scholer & Higgins, 2012, 2013)—in terms of either incentives (e.g., appetitive goals) or threats (e.g., aversive goals) has long been known (Carver & White, 1994; Gray, 1982). Previous findings indicate that the success of goal pursuit is affected by how the goal is framed, or its motivational focus (Higgins, 1998); the same goal can be construed either in an appetitive (e.g., rise to the challenge) or averse frame (e.g., avoid a loss). Generally, an aversive frame tends to impede goals and bias how the outcome is experienced (Gable & Poore, 2008; Scholer & Higgins, 2013). Our findings resonate with these results; participants emphasizing a need for closure felt less confident about their forecasts and evidenced poor forecasting performance overall. Need for closure is akin to aversive motivation in many respects as it reflects a “need” to resolve a problem rather than master it (Kruglanski et al., 1993). In fact, observed behavioral inhibition (BIS) scores, which are designed to probe for dispositional aversive motivation, loaded on the same factor as NFCL scores.
Taken together, our findings reflect core psychological processes at play within an applied domain. Indeed, they imply a need for closer examination for how these widely studied processes might express themselves in complex problem solving and decision making within the domain of intelligence and international policy.
Our factor-analytic work reveals previously undocumented distinctions within top-down (analytic/rational) cognitive styles, whereas previous research has emphasized either a bipolar unidimensional spectrum or a bidimensional factor structure separating top-down (analytic/rational) and bottom-up (intuitive/experiential) style sets in cognitive styles analytic/rational versus intuitive/experiential (Allinson & Hayes, 1996; Epstein et al., 1996; Kozhevnikov, 2007). Rather than reflect novel, as-yet-undiscovered cognitive styles, we believe these findings highlight that different psychological dispositions do not express themselves exclusive of other dispositions. Indeed, the dimensional structure of pooled measures of psychological dispositions reduce in unpredictable ways, reflecting the degree to which one disposition—cognitive style—might be dynamically modulated in expression in the presence of another disposition, such as motivational focus, for example.
We also find that psychological dispositions as measured by psychometric assessments have practical application as sampling criteria—for analyst pools or samples used for crowdsourcing or other aggregation techniques. Again, Brier scores provide not only an index for the accuracy of forecasts but also the confidence with which the forecaster places in his or her conclusions and the provenance of information on which his or her forecasts are built. As such, Brier scores can be influenced by over- and underweighting confidence estimates—this influence is especially true in the case of dichotomous-choice forecasting questions. Therefore, it is preferable to mitigate such systematic fluctuations in confidence that may reflect disposition rather than competence in forecasting.
We demonstrate that sampling criteria built from combined findings relating REI Rational and NFCL scales to different patterns of forecasting behavior enabled identification of subsamples that vary systematically in forecasting accuracy but not in confidence. Moreover, whereas measures of aptitude (logic problems) produced subsamples with the largest differences in forecasting accuracy, independent of confidence, criteria built from data reduction strategies performed commensurately and reliably at a lower cost to sample size. These findings are practical illustrations that psychological dispositions comprise different information than aptitude alone and may be equally as useful in analyst evaluation or complementary. Furthermore, although many proprietary measures of aptitude and personality exist with population norms, many of these measures are cumbersome with respect to length, cost, and proctoring/scoring procedures; they may be impractical for use with the very large samples needed for crowdsourcing. We find, however, that with just a few instruments—most of which are published and publically available—much useful information can be learned about participants’ analytic abilities and biases.
Caveats and Future Directions
Though reliable and interpretable, we find predominantly weak (<.30) effects. This finding was not unexpected, given that sample sizes with respect to both participants and forecasts were very large and our analysis centered on aggregated forecasting behavior. Although well beyond the scope of this report, we expect that effect sizes would likely fluctuate across subsamples selected by virtue of performance in distinct forecasting question domains, especially those in which participants expressed expertise. We are currently investigating methods for clustering forecasting questions into cohesive and intuitive category sets, which is a distinct challenge within the field, given that questions of contemporary relevance arise unpredictably. Even when clustering on the basis of geographic region, topical area, and so on, forecasting questions may cut across these categories in ways that are difficult to associate with participants’ self-reported or demonstrated competencies. Much and more research is needed in this area to enable dynamic sampling techniques that may be able not only to pair a given forecast question with a sample of topical experts who have access to the widest range of data related to the question but also to pair questions with samples of those with aptitudes and dispositions that make them uniquely suited for drawing appropriate inferences regarding the question, given the kind of data and information available.
Additionally, the analyses presented here include only data extracted from forecasting questions with binary-answer choices (i.e., yes vs. no). We are currently working to compare the effects observed in this sample with a paired sample of multiple-choice forecast questions. These questions will be differently susceptible to individual differences (and confidence), and so this remains a fertile avenue for investigation.
Overall, future efforts require concerted efforts in classifying, categorizing, or clustering forecast questions on dimensions that are amenable to analysis of individual differences. This goal will in turn enable more detailed analysis of forecasting behavior over time, through multilevel modeling. Individual differences, modeled as mediating or moderating influences, may be critical for understanding averaged growth (or decay) trends across subsets of forecast question domains, in addition to sampling, and for correcting for individuals’ biases that may influence aggregation techniques that rely on reliable estimates of the amount and quality of unique information within a given sample.
Our findings have bearing on refining methods for analyst assessment as well as tasking analysts with particular skill sets and psychological dispositions with specific problem sets. They further serve to bridge a gap between how psychometric measures typically used in the laboratory may have practical application to pertinent, contemporaneous challenge in government and industry. In particular, these findings are most relevant for how best to leverage psychometric data for use in improving sampling procedures in aggregation and/or crowdsourcing techniques in analytic forecasting. Our findings suggest that psychometric data can be effective for eliminating systematic bias in confidence regarding forecasts, perhaps in a more effective way than traditional aptitude measures used for selection and job placement. In turn, such bias is likely independent of the information used to make forecasts and can dramatically (and deleteriously) impact how various aggregation techniques weigh information within a wide pool of forecasts and ultimately recommend an expected outcome. In sum, our findings have broad applicability to crowdsourcing and forecasting techniques germane to data and information science. They also provide a means for connecting research on forecasting techniques to domain-general psychological processes that, when reduced to practice, may provide significant improvements to data collection and interpretation. However, our findings best address questions for when to include analysts’ responses as part of an analytic product (e.g., reports, forecasts), based on their psychometric data.
Our findings should not necessarily be taken to address the issue of analyst selection as it might pertain to exclusionary hiring practices. Much more research is needed regarding whether psychological dispositions—personality, cognitive style, and so on—would so systematically affect all aspects of an analyst’s day-to-day duties that they might present a bona fide occupational qualification (as per Title VII of the U.S. Civil Rights Act of 1964 and the U.S. Age Discrimination in Employment Act) that employers would be allowed to consider in hiring (beyond security-related concerns). Beyond that, there are additional pros and cons to consider in using psychological dispositions in hiring: Traditional measures of aptitude (i.e., SAT, GRE, etc.) provide straightforward ways of assuring test reliability, standardization, and sufficient proctoring. However, psychometric scales (i.e., personality, cognitive style) may provide alternative means of assessment that are less susceptible to well-noted socioeconomic biases, which appear to be endemic to standardized aptitude testing (Croizet & Millet, 2012). These trade-offs and others must be weighed carefully with legal implications before findings, such as those we present, are used to guide analyst selection practices beyond data-sampling methods that may be used for forecasting.
Footnotes
Acknowledgements
This research was supported by the Intelligence Advanced Research Projects Agency (IARPA) via the Department of Interior National Business Center (DoI/NBC) Contract Number D11PC20058. We would also like to thank our partners—Martin Research and Consulting, Massachusetts Institute of Technology, University of Illinois at Urbana-Champaign, and Mercyhurst College—and the following staff members for their assistance in this work: Alex Kirlik, Drazen Prelec, Danica Mijovic-Prelec, Laura Major, Srinivasamurth Prakash, Jason Beauregard, Stuart Peskoe, Jana L. Schwartz, and Kirk Smedley.
The U.S. Government is authorized to reproduce and distribute reprints for government purposes notwithstanding any copyright annotation thereon. The views and conclusions expressed herein are those of the authors and should not be interpreted as necessarily representing the official policies or endorsements, either expressed or implied, of IARPA, DoI/NBC, or the U.S. government.
Authors’ Note
Clifton L. Forlines is now vice president of software at Tactual Laboratories and an adjunct professor at the Department of Computer Science, University of Toronto.
Joshua C. Poore, PhD, is a senior staff member within Draper Laboratory’s Human-Centered Engineering group. He is an experimental psychologist with expertise in psychometric assessment, behavioral neuroscience, and both social and personality psychology.
Clifton L. Forlines, PhD, is a principal staff member working in the Human-Centered Engineering group at Draper Laboratory. His expertise lies in interface design, evaluation, and human–computer interaction.
Sarah M. Miller, PhD, is a human-centered engineer at Draper Laboratory. She received her PhD in industrial and systems engineering from the University of Illinois at Urbana-Champaign in 2008.
John R. Regan is a member of the technical staff within Draper Laboratory’s Networks and Information Concepts group. He is an applied mathematician specializing in data mining and data-driven modeling of complex systems.
John M. Irvine, PhD, is the chief scientist for data analytics at Draper Laboratory. He was a principle investigator for the Intelligence Advanced Research Projects Agency’s Aggregative Contingent Estimation program. He holds a PhD in mathematical statistics from Yale University.
References
Supplementary Material
Please find the following supplemental material available below.
For Open Access articles published under a Creative Commons License, all supplemental material carries the same license as the article it is associated with.
For non-Open Access articles published, all supplemental material carries a non-exclusive license, and permission requests for re-use of supplemental material or any part of supplemental material shall be sent directly to the copyright owner as specified in the copyright notice associated with the article.