
Abstract
Cognitive fatigue is a prevalent issue across multiple military operational domains, resulting in degraded mission performance and costly mishaps. One approach to mitigating the effects of fatigue in operational environments is to develop technology, such as biomathematical, physiological, and cognitive models, that can help individuals assess and predict their fatigue and its impacts on performance. We can further enhance the accuracy of these models by incorporating individual difference metrics that allow for increased individualization. In the current study, we examine how individual differences in circadian typology, typical sleep duration, sleep duration need, and hardiness relate to fatigued performance during a 24-hr long mobility aircraft simulator session with mobility aircrews. Specifically, we examine individual difference relationships with performance on three cognitive tasks, the Psychomotor Vigilance Test, the N-back task, and the Change Signal Task, which measure processes crucial to operational performance: attention, working memory, and executive functioning.
Cognitive fatigue is an issue across multiple military operational domains, resulting in degraded mission performance and costly mishaps (Gaines et al., 2020; Miller et al., 2008; US Navy, 2017). One approach to mitigating the effects of fatigue in operational environments is to develop technology that can help individuals assess and predict their fatigue and its impacts on performance. Biomathematical models of fatigue have been used extensively within the government and private sectors to help organizations and workers assess, predict, and manage fatigue (see Civil Aviation Safety Authority, 2014 for an overview of some common biomathematical models). These models include processes such as sleep homeostasis and circadian rhythm, among others, to predict fatigue and typically output a general fatigue or cognitive effectiveness metric. Other modeling formalisms such as computational cognitive architectures have been used to model the effects of fatigue on specific behavioral outcomes in laboratory tasks (e.g., Gunzelmann et al., 2009; Veksler & Gunzelmann, 2018). There has also been some success in developing initial models that integrate these different modeling formalisms to predict specific operational effects of fatigue (e.g., Veksler et al., 2023) that can be matured and integrated into operational technology. A common limitation of these predictive models is that they typically only take into account sleep and wake/work times for an individual and provide fatigue predictions based on the average person. To further increase the effectiveness of these models, there is a need to incorporate individual differences as research suggests that beyond sleep inputs, individual operators show different levels of susceptibility to fatigue (e.g., Van Dongen et al., 2004). Studies have found circadian typology (or chronotype) (Adan et al., 2012), individual differences in the circadian rhythmic expression of individuals, to be related to experiences of fatigue depending on work schedules and environments (e.g., Gander et al., 1993). Another possible individual difference factor affecting fatigue is sleep duration type. Individuals differ in the amount of sleep they require for adequate cognitive functioning, with habitual short sleepers often requiring < 6 hours of sleep and habitual long sleepers requiring > 9 hours of sleep. Research has found short sleepers to have a higher subjective tolerance to long wake durations and to have a decreased response to sleep loss compared to long sleepers (Aeschbach et al., 1996), suggesting short sleepers might be less susceptible to the effects of fatigue. Hardiness is another individual difference variable that might affect individuals’ fatigue. Hardiness is a broad personality style that includes being actively engaged and having a strong sense of commitment to life and work, believing one can control or influence what happens in their lives, and open to change and challenges (Kobasa, 1979). The few studies that have examined hardiness and fatigue tend to focus on chronic fatigue and suggest that there is a negative relationship (e.g., Clark, 2002; Michielsen et al., 2003). However, it is yet to be examined how hardiness relates to acute fatigue in operational settings. The current effort examines how these individual differences relate to fatigued performance during a 24-hr long mobility aircrew simulator session on three tasks that measure cognitive processing crucial to operational performance: attention, working memory, and executive functioning.
Method
Participants
Forty-three airmen from a United States Air Force mobility unit participated in the study. Thirty-nine pilots (Mage = 27.9; SDage = 3.0; Male = 32) had usable data for the current analysis. The study was approved by the Air Force Research Laboratory Institutional Review Board.
Materials
Individual Differences
Individual differences in circadian rhythmic expression were measured with the reduced Morningness-Eveningness Questionnaire (rMEQ; Adan & Almirall, 1991). Item scores were summed, with higher scores (highest possible is 25) reflecting morningness and lower scores (lowest possible is 4) reflecting eveningness (Cronbach’s Alpha α = .8).
Individual differences in sleep need and typical sleep duration were assessed with two self-report items derived from van Oostrom et al. (2018): “How many hours of sleep do you think you need in a 24-hour period?” and “How many hours of sleep do you usually get in a 24-hour period?”
Individual differences in hardiness were assessed with the 15-item Dispositional Resilience Scale (DRS-15; Bartone, 1995). Negatively keyed items were reversed scored. Item scores were summed with higher scores (highest score possible is 60) reflecting higher hardiness and lower scores (lowest score possible is 15) reflecting lower hardiness (Cronbach’s Alpha α = .73).
Cognitive Task Suite
Fatigue effects on attention were measured with a 10-minute Psychomotor Vigilance Test (PVT; Dinges & Powell, 1985). The PVT is a simple reaction time task (see Figure 1) that has been used extensively in the sleep literature to assess declines in attention (Lim & Dinges, 2008). Participants make a key press as soon as they see a millisecond counter appear on the screen. Between trials is a random interstimulus interval of 2 to 10 seconds.

PVT trial progression.
Fatigue effects on working memory processes (Jaeggi et al., 2010) were assessed with a 10-minute N-back task (Kirchner, 1958). The 2-back task included a subset of letters from the alphabet, where participants pressed a key when a letter presented two back was repeated (see Figure 2 for trial progression).
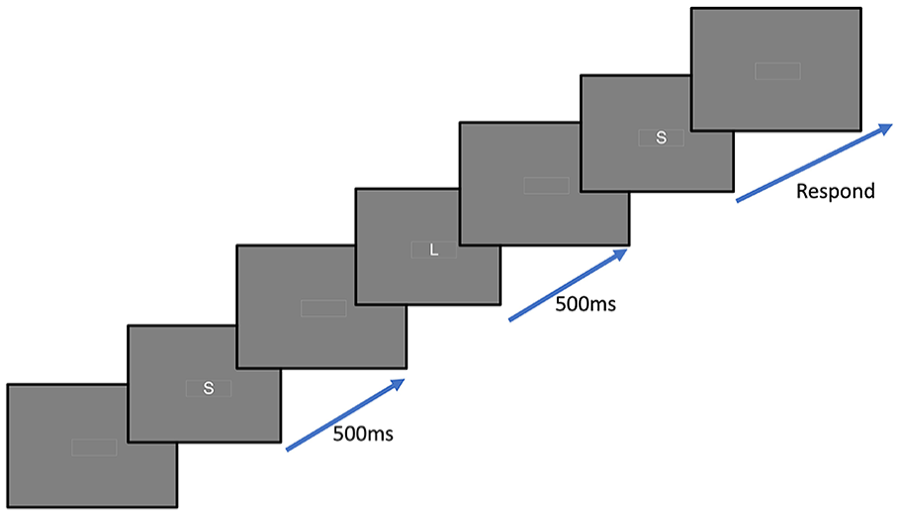
N-back task trial progression.
Fatigue effects on executive functioning processes were measured with a 10-minute Change Signal Task (CST; Brown & Braver, 2005). This task adapts the delay between an initial stimulus and a “change signal” to ensure that errors occur in performance (longer delay results in worse performance), providing insight into aspects of executive functioning such as response re-engagement in inhibitory control (Boecker et al., 2013). The task used in the study adjusted the delay based on performance: correct responses resulted in 2 ms increments of the delay and incorrect responses resulted in 50 ms decrements to the delay (see Figure 3). Due to an issue with software, 33 pilots had usable data for the CST.
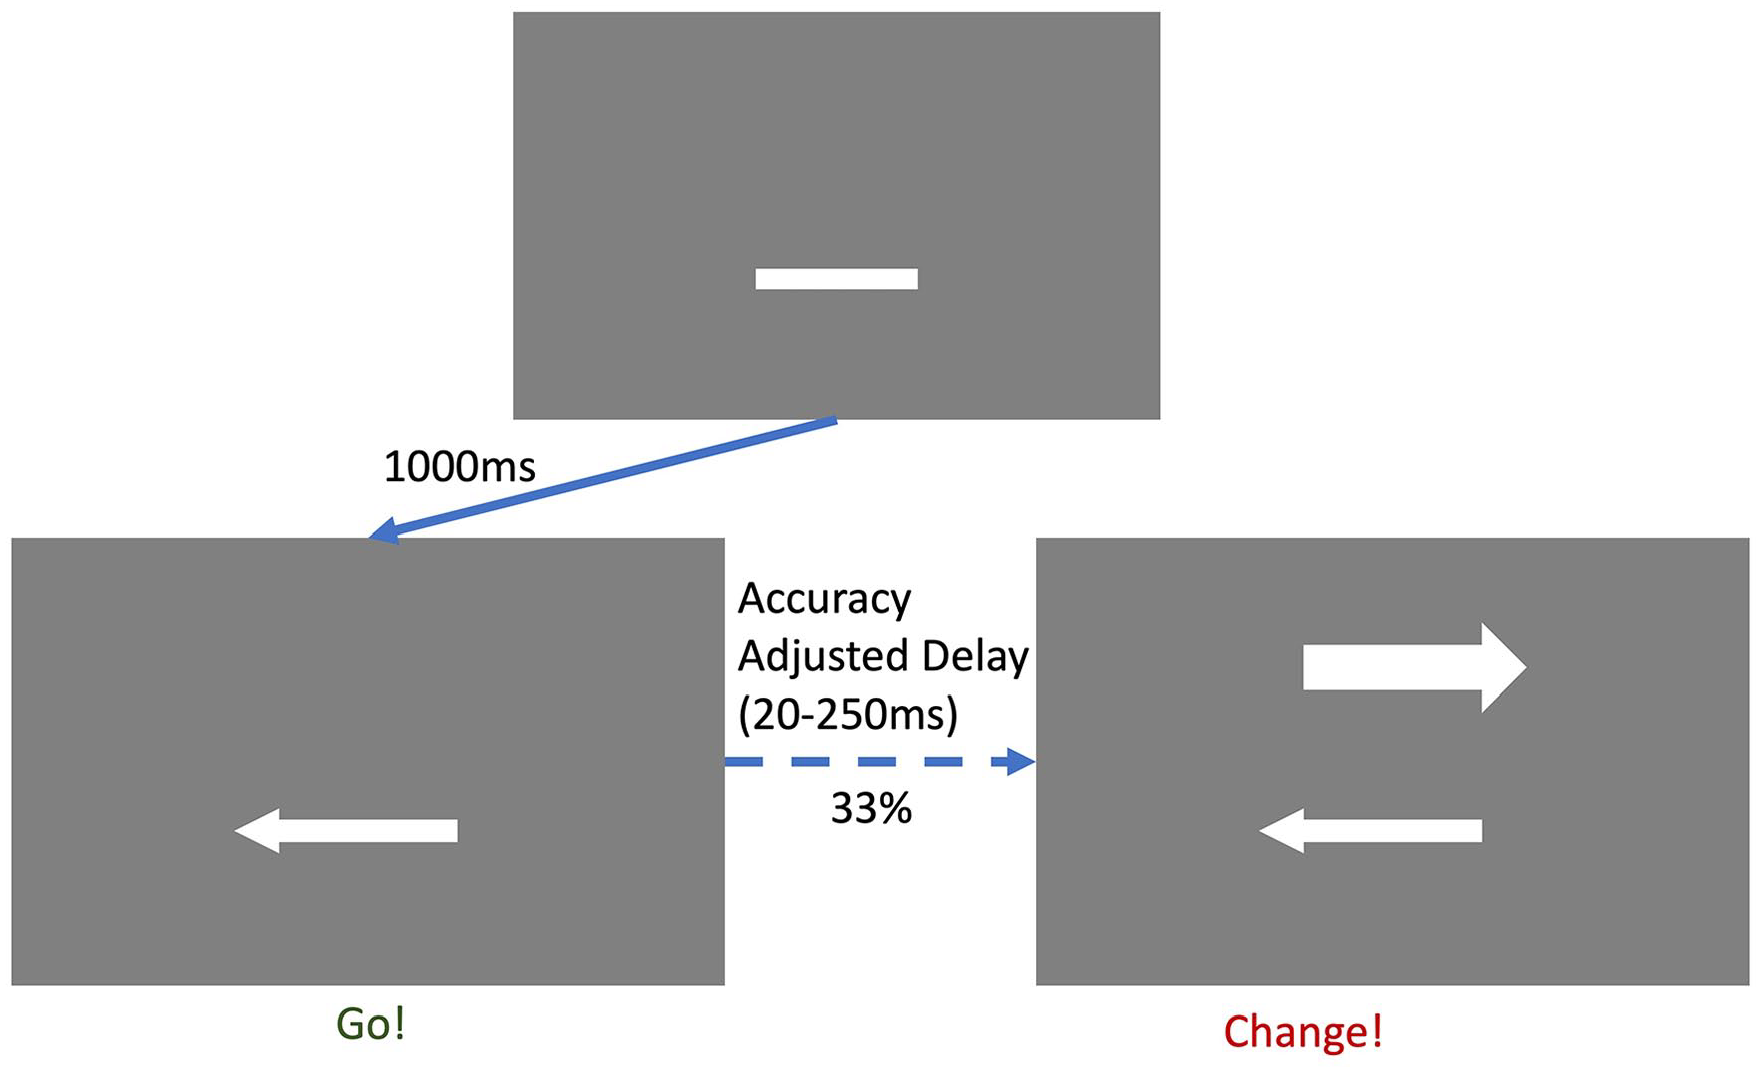
CST trial progression.
Procedure
The study collected data from 14 cohorts of augmented mobility crews (i.e., three pilots to each cohort). The study spanned 6 days, with 2 days of pre-simulator session (Day 1 and 2) and 2 days of post-simulator session (Day 3 and 4) data collection. For the current effort we only focus on the demographic and individual difference data collected on Day 1 before the simulator session and a subset of data collected right before, during, and right after the simulator session (Day 3 and 4). The simulator session began on Day 3 of the study and lasted 24 hours (into Day 4) with various mobility mission tasks of different complexity levels. Participants completed a cognitive task suite (PVT, N-Back, and CST) throughout the simulator session after the completion of major mission tasks. To increase the realism of the simulator session, participants engaged in crew rest similar to what they would experience in real missions. Crew rest was not controlled in the study, but left to the crews to organize. Given this uncontrolled crew rest and other simulator-related issues, each participant (pilot) had varying numbers of the cognitive task suite bouts.
Statistical Analyses
We analyzed several relationships between the individual difference measures and cognitive task performance throughout the simulator session with a median split and several behavioral outcomes, respectively. For the PVT we focused on median reaction time (RT), lapses, and false starts. For the N-back we focused on median RT, false alarms, and hit rate. Lastly, for the CST we focused on median RT and hit rate. Analyses were conducted with general linear mixed effects models in Python (statsmodels.mixedlm).
Results
RT was significantly slower in the PVT and N-back, number of lapses increased significantly in the PVT, and hit rate was significantly lower in the N-back and CST with simulator session time (highest p = .007). PVT false start (p = .16) and CST RT (p = .61) did not change significantly with simulator session time.
There was a main effect of circadian typology (M = 14.95, SD = 3.71, Mdn = 15, Range = 7–23) on N-back accuracy, with participants higher in morningness, performing worse (b = −0.14, SE = 0.06, CI = [−0.26, −0.03], p = .014) (see Figure 4).
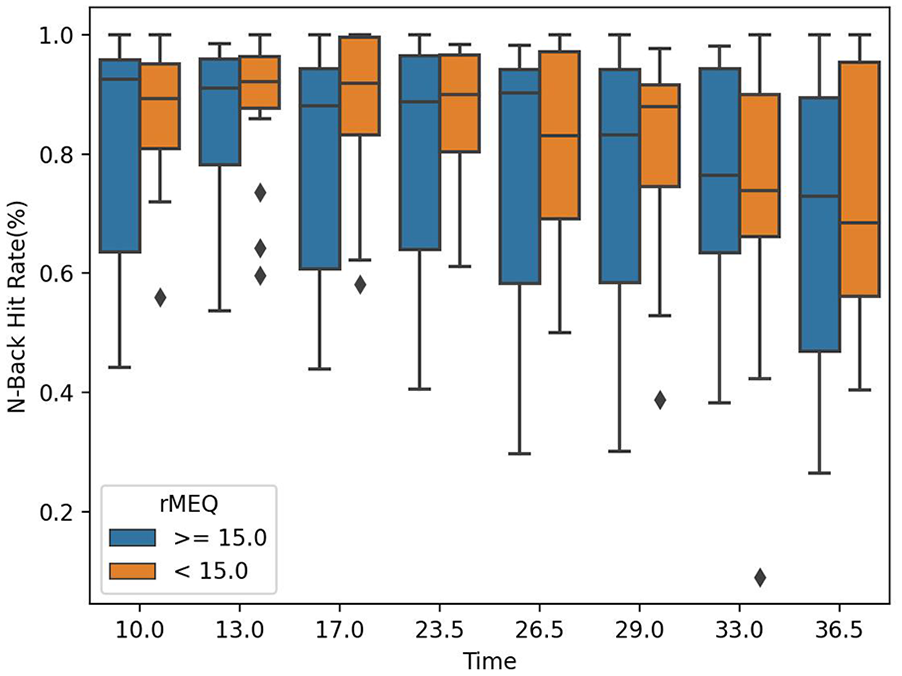
Circadian typology and simulator session time interaction on N-Back hit rate.
There was a significant interaction between typical sleep duration (M = 7.20, SD = 0.71, Mdn = 7, Range = 6–9) and simulator session time on PVT lapse, with those reporting less sleep performing worse over time (b = −.39, SE = 0.2, CI = [−0.78, 0.0], p = .05) (see Figure 5). However, in terms of sleep need (M = 7.90, SD = 0.84, Mdn = 8, Range = 5–9), those that reported that they needed more sleep had slower RTs on the PVT (b = .001, SE = 0.000, CI = [0.000, 0.002], p = .004) (see Figure 6) and N-back (b = .005, SE = 0.002, CI = [0.001, 0.009], p = .017) (see Figure 7) and more lapses during the PVT (b = .48, SE = 0.16, CI = [0.16, 0.8], p = .003) (see Figure 8) with simulator session time. Those individuals also had significantly more PVT lapses than those who reported needing fewer hours of sleep (b = −5.6, SE = 2.16, CI = [−9.83, −1.36], p = .01) (main effect) (see Figure 8).
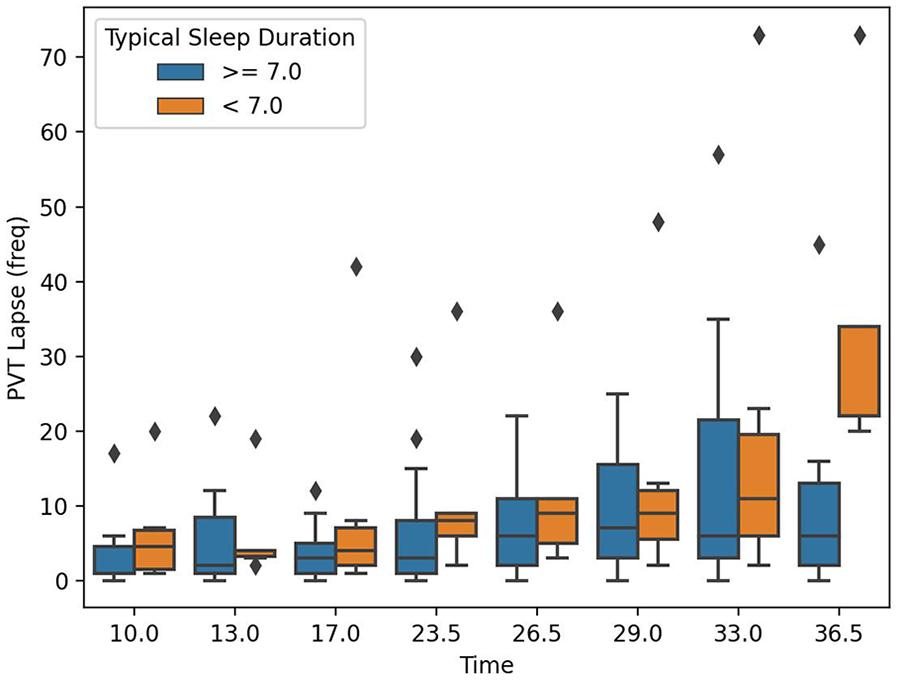
Typical sleep duration and simulator session time interaction on PVT lapses.
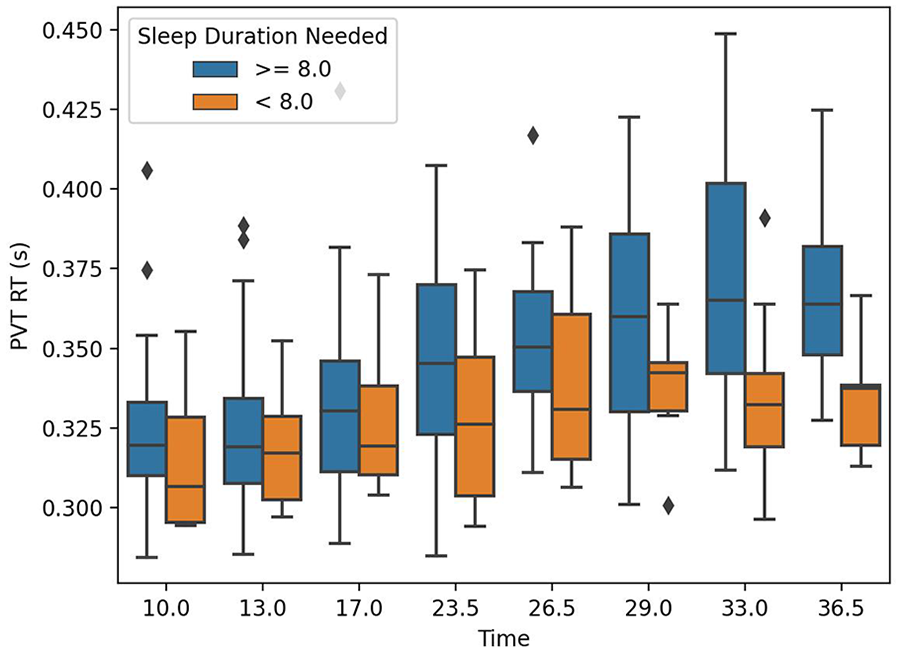
Sleep duration need and simulator session time interaction on PVT RT.
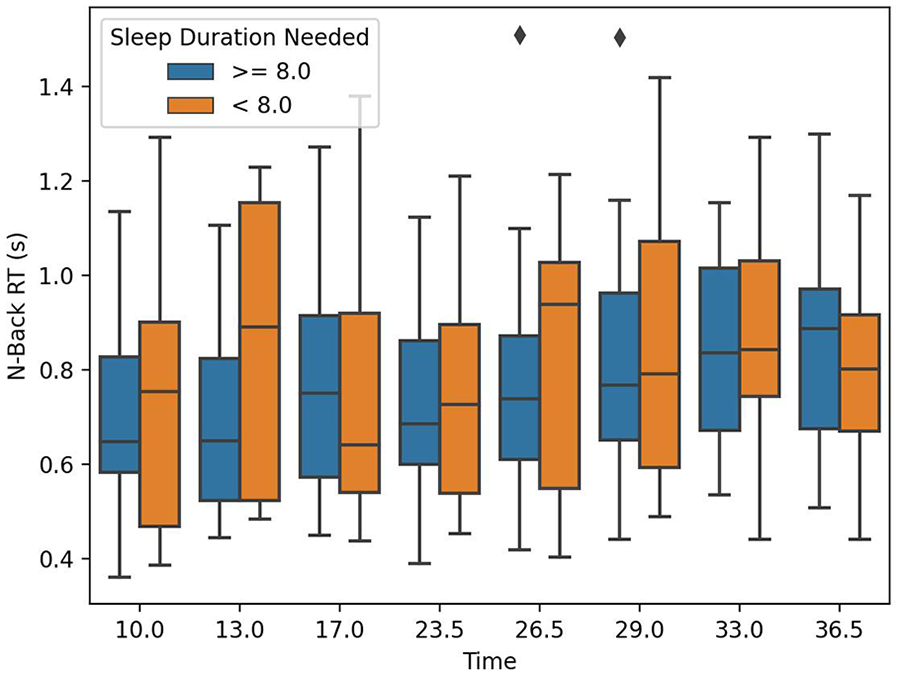
Sleep duration need and simulator session time interaction on N-back RT.
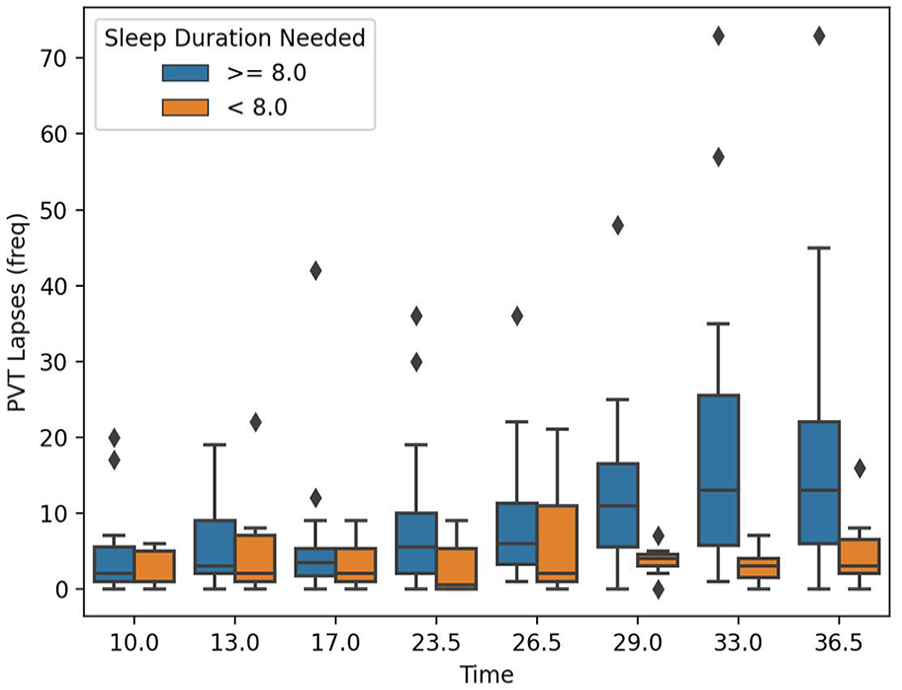
Sleep duration need and simulator session time interaction and main effect on PVT lapses.
In terms of hardiness (M = 45.85, SD = 4.40, Mdn = 46, Range = 36–56), participants higher in hardiness had lower accuracy in the N-back (b = −.006, SE = 0.002, CI = [−0.01, −0.001], p = .009) with simulator session time (see Figure 9). Hardiness had another significant interaction with simulator session time for PVT false starts (b = −.142, SE = 0.064, CI = [−0.27, −0.02], p = .027), suggesting those higher in hardiness had a lower rate of increase in false starts than those lower in hardiness (see Figure 10). Lastly, those higher in hardiness had a lower CST hit rate (b = −.08, SE = 0.03, CI = [−0.138, −0.023], p = .006) (main effect) (see Figure 11).
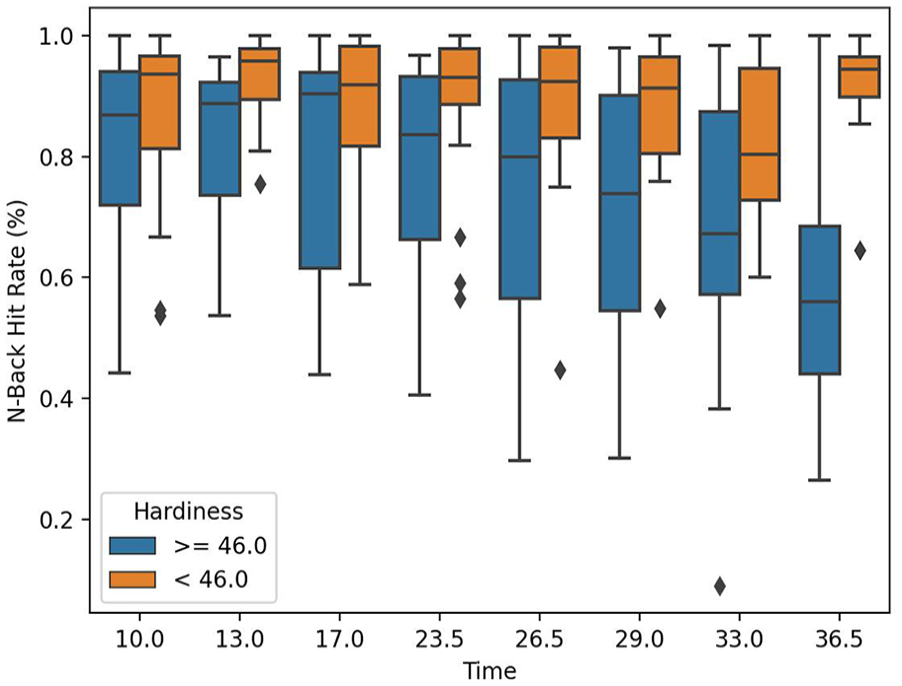
Hardiness and simulator session time interaction on N-Back hit rate.
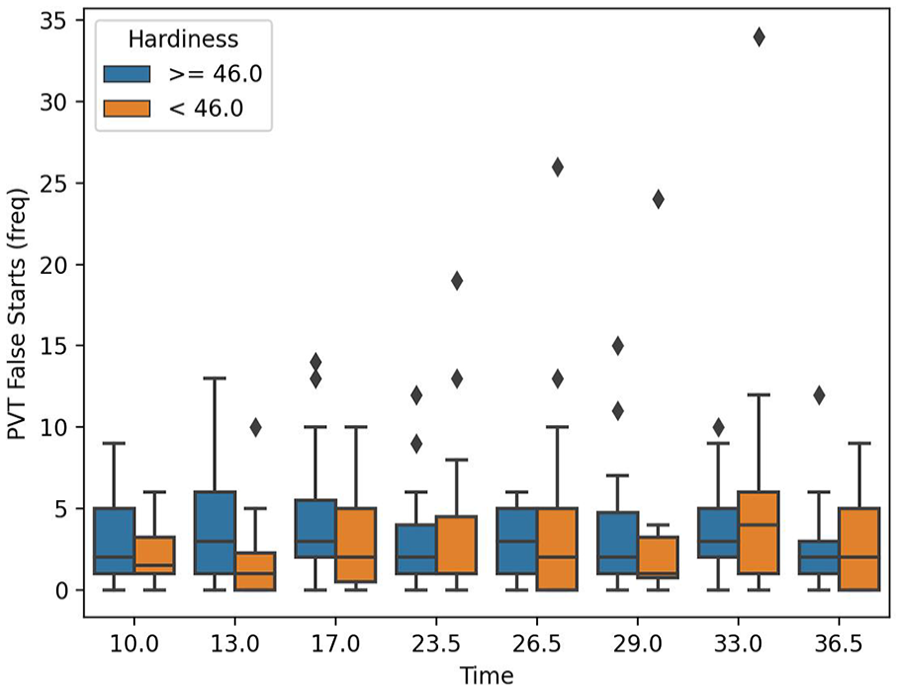
Hardiness and simulator session time interaction on PVT false starts.
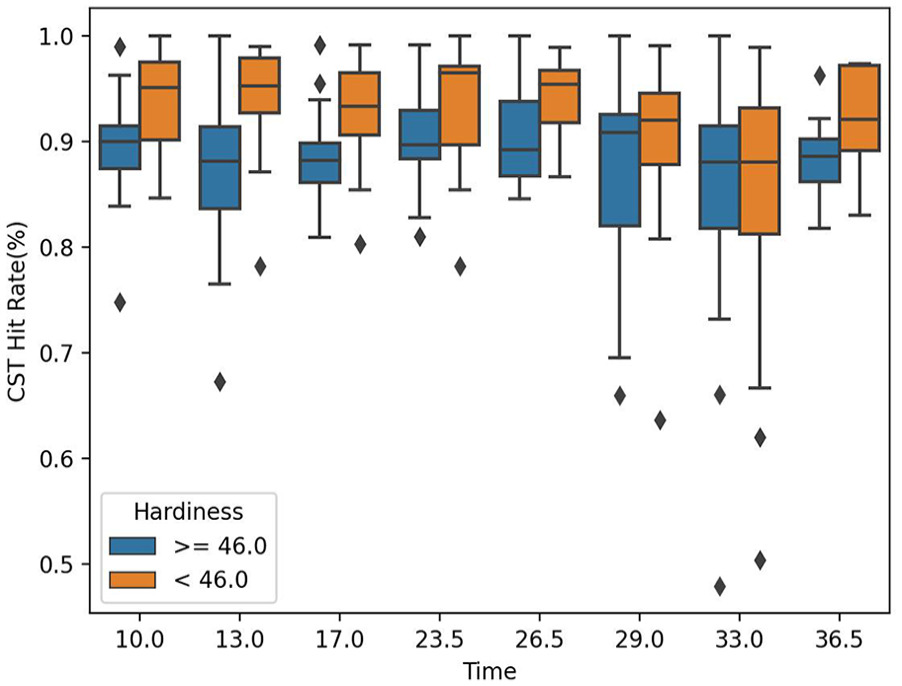
Main effect of hardiness on CST hit rate.
Discussion
Cognitive fatigue is a pervasive issue within several military communities and accurate predictive modeling of fatigue is needed to increase fatigue risk management effectiveness. Including individual difference metrics into this modeling could increase individualization and accuracy of fatigue predictions. In working toward these capabilities, the current effort examined the relationship of individual differences with fatigued pilot performance over a 24-hr simulator session. Findings suggest that easily measurable, stable individual differences (via questionnaires) are associated with fatigued performance in an operationally-relevant context. Specifically, aircrew higher in morningness tended to have reduced working memory. However, the lack of any other effects does not align with research suggesting morningness is associated with increased fatigue during long-duration missions (Gander et al., 1993). Those that reported getting less sleep had more PVT lapses, but those who thought they needed more sleep were less attentive and had reduced working memory throughout the simulator session compared to those who thought they needed less sleep. This is consistent with past research suggesting those individuals who need less sleep are less susceptible to fatigue effects (Aeschbach et al., 1996). Lastly, results suggested hardiness might be associated with acute fatigued performance, although the results were mixed with hardiness levels affecting working memory and inhibition differently. Diverging from findings with chronic fatigue, it is possible hardiness might make one more susceptible to acute fatigue with certain cognitive processes as they believe they can withstand the effects of fatigue and persevere. Further research is needed to verify these relationships with acute fatigue in operational settings. Researchers have recently started to integrate cognitive and latent variable modeling (Vandekerckhove, 2014) to help better explain cognitive processes and their outcomes. In future work we plan to incorporate estimates of these individual difference factors into cognitive fatigue models to increase the predictive effectiveness of these models.
Footnotes
Acknowledgements
The opinions expressed herein are solely those of the authors and do not represent the official positions of the United States Government, the U.S. Department of Defense, the U.S. Air Force, or any of their subsidiaries or employees. Distribution A: Approved for Public Release. Case number: AFRL-2024-2716.
Declaration of Conflicting Interests
The author(s) declared no potential conflicts of interest with respect to the research, authorship, and/or publication of this article.
Funding
The author(s) disclosed receipt of the following financial support for the research, authorship, and/or publication of this article: The research was supported by the Joint Program Committee-5/Military Operational Medicine Research Program Working Group: Fatigue Mechanisms and Countermeasures (Project MO210251).