
Abstract
Aiming at the key optimization problems of wireless sensor networks in complex industrial application environments, such as the optimum coverage and the reliability of the network, a novel topology optimization of coverage-oriented strategy for wireless sensor networks based on the wolf pack algorithm is proposed. Combining the characteristics of topology structure of wireless sensor networks and the optimization idea of the wolf pack algorithm redefines the group’s wandering and surprise behavior. A novel head wolf mutation strategy is proposed, which increases the neighborhood search range of the optimal solution, enhances the uniformity of wolf pack distribution and the ergodicity ability of the wolf pack search, and greatly improves the calculation speed and the accuracy of the wolf pack algorithm. With the same probability, the cluster heads are randomly selected periodically, and the overall energy consumption of wireless sensor networks is evenly distributed to the sensor node to realize the balanced distribution of the data of the member nodes in the cluster and complete the design of the topology optimization of wireless sensor networks. Through algorithm simulation and result analysis, compared with the particle swarm optimization algorithm and artificial fish swarm algorithm, the wolf swarm algorithm shows its advantages in terms of the residual energy of the sensor node, the average transmission delay, the average packet delivery rate, and the coverage of the network. Among them, compared with the particle swarm optimization algorithm and artificial fish swarm algorithm, the remaining energy of nodes has increased by 9.5% and 15.5% and the average coverage of the network has increased by 10.5% and 5.6%, respectively.
Introduction
In the context of the rapid development of natural science and technology, the Internet of things technology and wireless sensor networks (WSNs) are widely used in military, smart manufacturing, industrial monitoring, smart agriculture, environmental monitoring, smart logistics, and transportation. 1 WSNs are network systems that integrate multiple modern technologies such as wireless communication technology, computer processing technology, and sensor technology. The WSN is mainly composed of the micro sensor nodes, and the way of forming a network between sensor nodes is self-organization. 2 The topology control and coverage optimization have become the core issue of the WSN research, which determines the size of the sensor network’s perception and monitoring capabilities, and directly reflects the quality of service of the wireless sensor. In order to reduce the coverage blind area of WSNs as much as possible while improving the ability of the sensor nodes to obtain information, it is necessary to deploy the sensor nodes reasonably and effectively. 3 In recent years, the research of WSNs has developed rapidly, and its hotspot is to achieve the purpose of the resource optimization configuration through the topology control and the coverage optimization strategy. Even when the computing power, the node energy, and the communication bandwidth do not meet the conditions, the goal of improving the quality of services such as the monitoring and communication can be achieved, thereby prolonging the lifetime of the network. 4
Coverage enhancement and topology control are the key issues in WSN-based target monitoring applications. It uses the coverage performance or the lifetime of the network as the main criteria for evaluating the network service quality, and improves the overall monitoring the capabilities of WSNs by optimizing the deployment and topology of the network. This problem is directly related to the effective monitoring quality and time length that WSNs can provide for the specific monitoring tasks. At present, the existing research results have problems such as not considering the heterogeneity of the network, the algorithm convergence to the local extreme value, and the single application scenario. Therefore, it is necessary to design a reasonable and efficient coverage enhancement algorithm and topology control scheme based on the characteristics of WSNs and the specific application scenarios.
Related work
Recently, many scholars at home and abroad have studied the coverage optimization of WSNs.5–10 The main purpose of the topology control and optimal coverage is to improve the efficiency of the network, balance the energy consumption, and increase the coverage of the network. The commonly used methods include the power control and the hierarchical topology design to optimize the communication link to reduce the energy consumption and improve the performance of WSNs. In recent years, many experts and scholars have done a lot of research around optimizing the coverage of the network and improve the network’s lifetime, coverage, robustness, reduce the energy consumption, and the link failures. Zárraga-Rodríguez et al. 11 presented a novel strategy to connect a large number of wireless sensors for distributed consensus with low power consumption by combining small networks with basic topologies. Xenakis et al. 12 used an unequal energy distribution algorithm, and provided the best effort coverage by arranging the nodes using topology control principles, formulated an optimization problem, and defined an objective function that incorporates both the network coverage and lifetime. Khedr et al. 13 proposed a coverage-aware and efficient planar face topology structure (CAFT) for WSNs, and the proposed design is effective in reducing the energy consumption and thereby improves the WSN lifetime. To handle the uncertainty related to sensor connectivity and coverage, Senouci and Mellouk 14 devised a probabilistic-based communication cost model, and we exploit the belief functions theory to define a generic evidence fusion scheme that captures several characteristics of real-world applications. They considered deriving optimal conditions for connectivity with coverage in WSNs. Most versions of this problem are non-deterministic polynomial (NP)-complete, Al-Karaki and Gawanmeh 15 presented a dynamic programming study of the connectivity with coverage of clustered structure and its effect on routing in generalized WSNs. Ramazani et al. 16 introduced a novel centralized method for detection and relative localization of WSN coverage holes in coordinate-free networks, created a hole-equivalent planar graph that has the same number and position of holes as the original sensor network graph while preserving the embedding. Jameii et al. 17 proposed adaptive multi-objective optimization framework based on non-dominated sorting genetic algorithm and learning automata (LA) for coverage and topology control in heterogeneous WSNs. A small probability mutation replacement strategy is proposed in Li et al. 18 to replace individuals who do not meet the coverage requirements in the search process, and the fitness function is improved so that the network density can be adjusted by modifying the parameters in the improved fitness function. In order to improve area coverage with minimal energy consumption and faster convergence rate, the edge-based centroid (EBC) algorithm is presented to improve the area coverage with faster convergence rate in a distributed network. 19
The intelligent algorithm is an optimization algorithm that does not require centralized control. The structure of the algorithm is simple and easy to understand and implement. The swarm intelligence optimization algorithm plays a very important role in the optimization of information monitoring and control. While improving production efficiency, it also saves network resources to the greatest extent. In order to devise a lightweight and efficient sensor placement algorithm, the characteristics of the binary particle swarm optimization (PSO) with the WSNs deployment requirements are proposed in Senouci et al. 20 The effectiveness and efficiency of the proposed approach are evaluated through extensive simulations. In order to maximize the network coverage and minimize the energy consumption on the basis of ensuring the quality of service, a WSN coverage optimization method based on an improved artificial fish swarm algorithm (AFSA) was proposed. 21 To monitor the interest field and obtain the valid data, this article proposes a WSN coverage optimization model based on improved whale algorithm, and the proposed algorithm could effectively improve the coverage of nodes in WSNs and optimize the network performance. 22
As the problems encountered in actual engineering are complex and changeable, there are many constraints. Therefore, it is very difficult to establish a corresponding model, so it is very important to find an intelligent optimization method that meets the engineering practice. This is one of the reasons why many scholars use the intelligent optimization algorithms to solve the practical problems, and it is also a research hotspot. Therefore, a new topology control and optimal coverage method for WSNs based on the wolf pack optimization algorithm is proposed, which can improve the coverage and work efficiency of the network and prolong the lifetime of the network.
The related problems of topology optimization and coverage are explained, and the application of wolf pack optimization algorithm in the topology of WSNs is explained. Specifically, it includes the topology modeling of the optimal coverage for WSNs, and the optimization design of the topology and optimal coverage for WSNs based on the wolf pack optimization algorithm. And through experimental simulation, the wolf pack optimization algorithm is compared with the particle swarm algorithm and the AFSA. It is verified that the coverage optimization problem of the wolf pack optimization algorithm for WSNs has been substantially improved in terms of increasing the coverage of the network, reducing the energy consumption, and improving the lifetime of the network.
The remainder of this article is organized as follows. Section “Optimal coverage problem of topology optimization” is the mathematical modeling of optimal coverage problem of topology optimization. Section “WPA” is the mathematical modeling and detailed implementation process of the wolf pack algorithm (WPA). Section “Application of WPA in topological structure optimization of WSNs” is the application of WPA in topological structure optimization of WSNs. Simulation analysis and discussions are presented in section “Algorithm simulation comparison and result analysis.” Section “Conclusion” presents the conclusion.
Optimal coverage problem of topology optimization
As the basic model of research, the two-dimensional perception model is widely used in WSNs. It has the characteristics of simple structure and low difficulty in solving problems. In a node with a sensing radius of r, the size of the radius depends entirely on the inherent physical characteristics of the sensing original. The condition that the target node can be sensed by the detection node is that the target node is located in the sensing circle of the detection node with a radius of r. Figure 1 shows the basic Boolean perception model. The target node within the sensing radius of the sensor node has a probability of being sensed 100%, and the probability of perception outside is 0%.

Boolean perception model.
In order to more easily express the superiority and effectiveness of the wolf pack optimization algorithm, the experiment sets a coverage plane based on the binary perception model. This plane has M sensor nodes, and the communication radius and the sensing radius of the sensor nodes are r and R, respectively. The coordinates of each sensor node are set to (xl, yl), and the set of sensor nodes of all two-dimensional coverage planes is represented by O = {O1, O2, O3,…, OM}. Set the coordinates of any point Rt in the plane as (xt, yt), then the distance from the sensor node to any point is expressed as

The measurement rate sensed by the sensor node Ol to the target node is

In the two-dimensional detection plane, where the target node in Ol covers a node with coordinates (x, y), and the coverage rate is expressed as

Suppose the coverage area is I and its area is represented by a × b, and the coverage of the network is represented by the coverage of the grid center. The parameter f1(xl, yl) is the area coverage of the sensor network (CovArea(I)) and the effective coverage of the network. The parameter f2(xl, yl) is the node utilization rate (SenRat(I)) and the number of reaction working nodes. In order to ensure that the network coverage is maximized and the node utilization rate is minimized, the overall objective function is obtained by weighted conversion of the f1(x) and f2(x) sub-objective functions by setting the fitness function. The objective function is as follows


In formula (4), the parameter
WPA
WPA is a bionic optimization algorithm proposed by HS Wu and FM Zhang 23 and other scholars in 2013 to simulate the hunting behavior of wolves. The algorithm refers to the division of hunting and food distribution of wolves in nature. With artificial wolves as the main body, the collaborative path search structure based on the division of responsibilities is used to abstract the engineering optimization solution process into five stages of wolf hunting: wolf detection, wolf call, wolf attack, group siege, and elimination update. 24 Compared with other swarm intelligence algorithms, the WPA has the better local search and the global optimization capabilities, the stronger optimization stability, and the more competitive.
Division of wolves
According to different fitness values, artificial wolves can be divided into three categories: the head wolves, the fierce wolves, and the scout wolves. Among them, the head wolf has the most sensitive sense of smell and the best adaptability, which represents the location of the optimal solution. There are often several scout wolves, with better sense of smell and second only to wolves in fitness. 25 They often explore in multiple directions around the optimal position and randomly change their identities according to changes in fitness, which increases the randomness and accuracy of the optimization algorithm. Ferocious wolves have a poor sense of smell and a large number, which represents the main force of the attack, making the algorithm converge to the global optimum. After capturing the prey, the wolf pack does not distribute the food equally, but according to the principle of “distribution according to work, rewards based on merit.” First, the food is allocated to the wolf with the greatest credit first, and then allocated to the wolf detection, and the rest is divided by the pack of wolves. This cruel rule of survival of the fittest guarantees the survival and reproduction of wolves. In the WPA, after each round of hunting, several wolves with poor fitness values are also eliminated, and the same number of artificial wolves is randomly generated to ensure the accuracy of the algorithm’s convergence. 26
Algorithm description
Using the WPA to solve the optimization problem can be visually described by the wolf pack hunting process. 27 First, release the wolf pack to perform a global search, and select the wolf that smells the strongest food as the head wolf (the applicability is the best, and its value is Xb). Take Q wolves whose fitness value is second only to the head wolf as the wolf detection (fitness value Xi, Xi < Xb), and the rest are all ferocious wolves (fitness value Xm, Xm < Xi). Each scout wolf can perform a local search in P directions. If its fitness value is greater than that of the head wolf during the wandering process, that is, Xi > Xb, then the wolf is regarded as a new wolf (Xb = Xi). Otherwise, return to the original position and continue searching. Second, the wolf sends a signal. When the fierce wolf initiates a run, it moves closer to the position with the best fitness, and rushes to a distance dm from the wolf (dm < dmin). During the raiding process, if the ferocious wolf smells more food than a wolf (Xm > Xb), then the ferocious wolf transforms into a wolf and sends a signal. Then, the fierce wolf and the wolf scout launched a siege on the prey, and decided whether to update the position according to the change in the food odor concentration of the new prey that the individual smelled after the hunt was over. Finally, the artificial wolves are arranged in descending order of fitness value, and several wolves with poor fitness are eliminated, and the remaining R wolves are retained for the next generation to initiate a new round of hunting operations.
Group behavior and rule description
The hunting process of wolves is divided into five stages, and each stage of behavior conforms to the laws of survival of nature, all embody the group wisdom of division of labor and cooperation, and all have fixed update rules: 28
1. The head wolf update rule: in the initial calculation, the wolf with the best fitness is selected as the head wolf. After the iteration of the WPA, compare the value of the wolf with the best fitness at this time with the fitness value of the previous wolf. If the wolf has better fitness, update the identity and position of the wolf; otherwise, the position of the wolf remains unchanged. If there are multiple wolves with the best fitness at the same time, one wolf is randomly selected as the head wolf. The head wolf only issues the siege signal and does not participate in the specific optimization process until it is replaced after the next iteration.
2. Wandering behavior of the scout wolf: suppose there are N wolves in the entire wolf pack, among which Q wolf detection, the parameter Q is randomly selected as an integer between [N/(α + 1), N/α], and the parameter α is the wolf detection scale factor. The mechanism of transforming the scout wolf into the head wolf is as described above. If the detection wolf does not need to be updated as a head wolf, it will make independent decisions, and proceed one step in P directions, respectively (this step is called the walking step length stept), record the fitness value after moving forward and return to the original position. After advancing in the h direction (h = 1, 2, 3,…, P), the position of the wolf i in the dth dimension is

The fitness value of the original location where the proactive wolf is located is xi0. The scout wolf selects the optimal fitness value xi (xi > xi0) from the recorded P fitness values to move forward and updates the location state xi of the wolf detection. Until the scout wolf is updated to a head wolf or the number of wanderings T reaches the maximum Tmax. Due to individual differences, the search direction p of the wolf hunter is different. Too large selection of p will improve the accuracy of the search, but the search speed is slower, so it is often randomly selected between [pmin, pmax]. The wandering behavior of scout wolves reflects the intelligent division and cooperation mechanism of wolves.
3. The fierce wolf running behavior: when the number of fierce wolves Z receives the siege signal of the head wolf (Z = N − Q − 1), they will quickly move closer to the area where the head wolf is located, and keep larger step size step m . Then, the position of fierce wolf i in the d-dimensional space after the kth iteration is

In the formula, the parameter

The parameter R in formula (9) represents the number of all variables to be optimized in the engineering problem, and the parameter β represents the distance determination factor. The increase of the value of β can accelerate the algorithm convergence. However, too much will affect the siege behavior and reduce the accuracy of the algorithm. The aggressive behavior of the fierce wolf reflects the highly developed information sharing mechanism in the wolf pack and the absolute leadership and command role of the head wolf.
4. Group siege behavior: when the fierce wolves rush to the attack range, the joint detection wolves immediately initiate a siege on the prey. For the kth generation wolf pack, the head wolf position
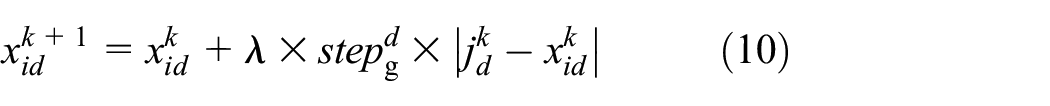
The parameter λ in formula (10) is a random number uniformly distributed between [−1,1], and stepg represents the attack step length of the wolves launching a siege. Assuming that the value range of the rth variable to be optimized is [min r , max r ], the wandering step length stept of the scout wolf, the step length stepm of the fierce wolf rush, and the step length stepg of the wolf attack in the same dimension have the following relationship
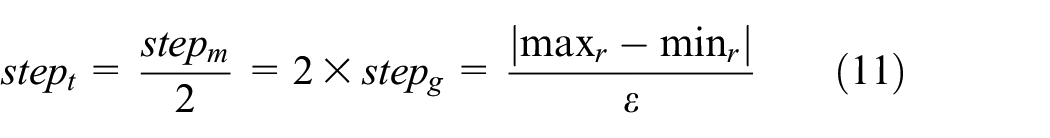
The parameter ε in formula (11) represents the step size factor, which represents the fineness of the individual artificial wolf’s optimization within the search range.
5. Elimination and renewal stage: after completing the siege behavior, the artificial wolf decides whether to update the current position according to whether the fitness is optimized. In the algorithm, according to the natural “survival of the fittest” rule, y wolves with poor fitness are eliminated, and the y artificial wolves are randomly generated. The value of y also affects the optimization performance of the algorithm. As the y-value increases, the individual diversity of the wolf pack increases. But the y-value is too large, making the search more random. The value of y is too small, which reduces the ability of the wolf pack to develop the optimal space. In actual operation, y is often randomly selected as an integer between [N/2 × θ, N/θ], and the parameter θ is the population update factor.
The algorithm steps based on the WPA to solve the optimization problem are as follows:
Population initialization: a total of N artificial wolves are initially set up and randomly assigned to the solution space. Set the relevant parameters: the maximum number of iterations is kmax, the maximum number of wanderings is Tmax, the scout wolf scale factor is α, the distance determination factor is β, the population update factor is θ, and the step size factor is ε. After the initialization is complete, go to Step 2.
Select the head wolf, the scout the wolf wanders: an artificial wolf with the best current fitness is selected as the head wolf (its fitness value is Xb), and the number of Q wolves walk around. In the process of wandering, if the applicability of scout wolf i is better than that of the head wolf, that is, Xi > Xb, it will immediately change to the head wolf; otherwise, it will remain in the wandering state until the maximum number of wanderings Tmax is reached, and go to Step 3.
Wolves call and pack of wolves rush: when the scout wolves finish their wandering, the wolves send out a hunting call, and the fierce wolves rush according to formula (9). During the run, if the fitness of the fierce wolf m is better than the fitness of the head wolf, that is, Xm > Xb, the fierce wolf m is transformed into a head wolf; otherwise, it runs to a position away from the head wolf dm, and then go to Step 4.
Group siege: the fierce wolf and the scout wolf initiate a siege on the prey in the manner described in formula (10). After the siege is completed, go to Step 5.
Elimination update: the artificial wolf judges whether to update the location according to the fitness value of the current location. Eliminate y artificial wolves with poor fitness, randomly generate y artificial wolves, complete the population replacement, and then go to Step 6.
Termination judgment: judge whether the requested optimization solution meets the accuracy requirements or reaches the maximum number of iterations kmax. If it is satisfied, the algorithm terminates; otherwise, go to Step 2. The flowchart of the WPA is shown in Figure 2.
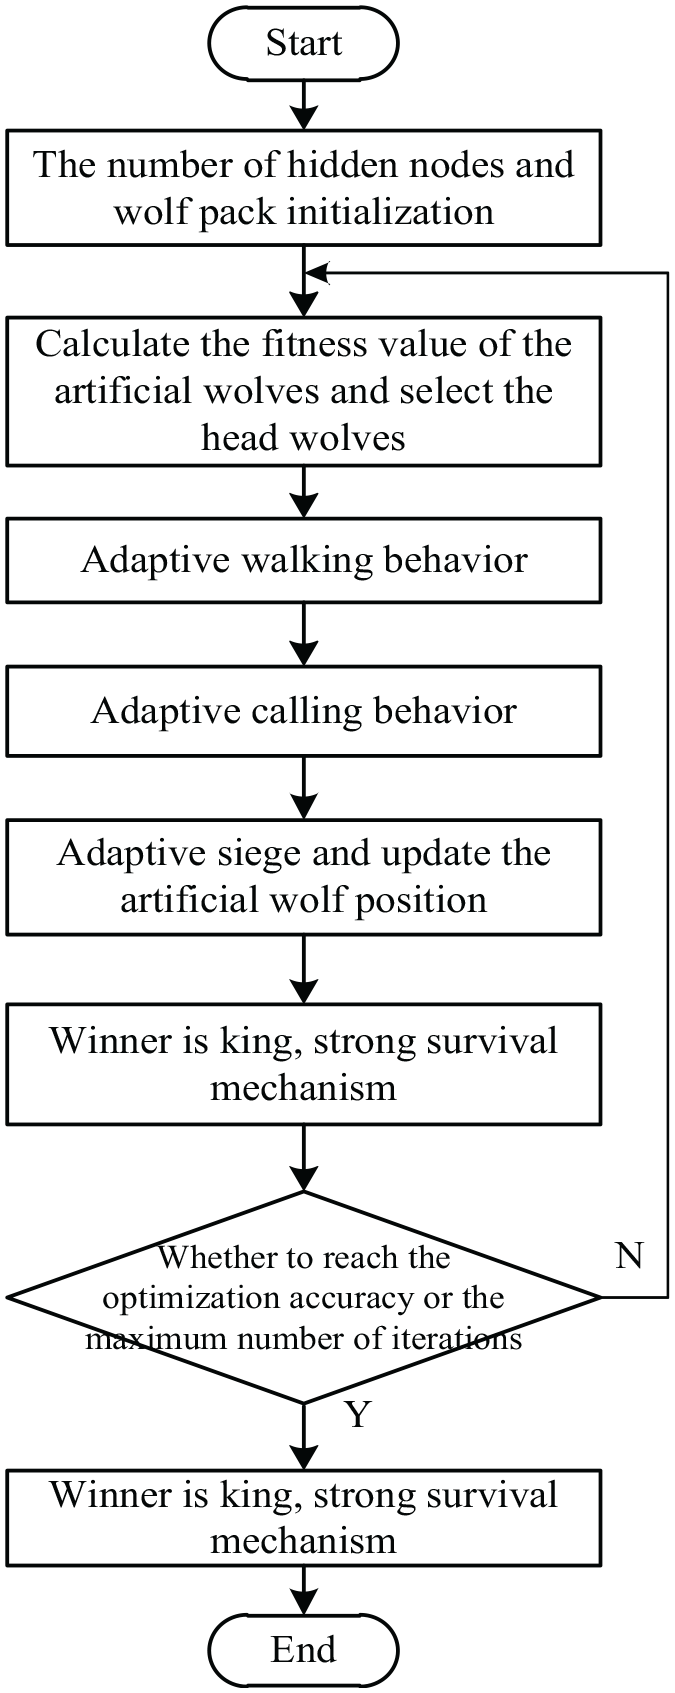
The flowchart of wolf pack algorithm.
Application of WPA in topological structure optimization of WSNs
In the actual application environment, in order to ensure that the sensor nodes can cover the entire area, researchers often need to spread a large number of the sensor nodes, and use the high-density node spreading to keep the coverage of the network at a high level. But from the perspective of economic and energy efficiency, the sensor nodes have the disadvantages of the high cost and the limited energy. Therefore, the research on the optimal coverage of the network is a research hotspot in the field of WSNs. Due to the characteristics of dynamic topology changes, energy constraints, and limited transmission, the coverage of the network can reasonably allocate network space resources, and better complete tasks such as environmental perception and information acquisition, the current coverage method of WSNs cannot fully cover the sensor network.
Based on the basic characteristics of the WSN topology, this article constructs artificial definitions and optimizes them under the constraints of characteristic conditions. At the same time, the hierarchical topology structure is used as the basic structure of the WSN topology. After detailed analysis of it, an efficient and energy-saving automatic topology control algorithm is proposed. The cluster heads are randomly selected with the same probability in a fixed period, so that the sensor node balances each part of the overall energy consumption of WSNs, ensures the balanced distribution of the node data of the members in the cluster, and completes the optimal design of the topology of WSNs. This algorithm can meet the requirements of the data latency, improve the coverage of the network, and ensure the safe and stable data transmission.
The topology optimization design and coverage optimization steps of WSNs are as follows:
Set algorithm parameters. Set the coverage model parameters of WSNs sensor nodes, generate initialized the position of the sensor nodes, and calculate the coverage of the network according to the objective function. The wolf population size is N, the maximum number of iterations is Maxgen, the maximum number of wanderings is Tmax, the wolf detection scale factor is α, the distance determination factor is β, the population update factor is θ, and the step size factor is ε.
In the initial population, the head wolf with the largest prey odor concentration is selected as the scout wolf, and the wolf with the best excluding the first wolf is used as the scout wolf. And according to formula (7), it will walk until the odor concentration of the scout wolf is greater than the odor concentration of the head wolf or reaches the maximum number of wanderings Tmax.
Enter the summoning behavior. The fierce wolf rushes and approaches the head wolf, and uses formula (8) to calculate the state after the rush. If the scent of the prey smelled by the wolf during the raid is concentrated on the wolf, the wolf replaces the wolf and performs a summoning behavior. Otherwise, the fierce wolf has been rushing to the distance dm between the head wolf.
Conduct an act of siege. The artificial wolf participating in the siege behavior uses formula (10) to update its position after the siege.
Sort the individuals in the wolf pack, choose the best one as the head wolf, and then update the position of the head wolf. The population was updated according to the regeneration pattern of wolves.
Determine whether the termination conditions of the algorithm are met. If it is satisfied, the optimal solution is output and the algorithm ends; otherwise, go to Step 2.
Finally, the topology optimization of the WSN based on the wolf pack optimization algorithm is realized, which increases the coverage of the network and improves the work efficiency of the network.
Table 1 shows the pseudo-code of the implementation steps of coverage optimization for WSNs based on the WPA.
Implementation steps of the coverage optimization based on WPA.

WPA: wolf pack algorithm.
Algorithm simulation comparison and result analysis
The simulation environment of this article is based on MATLAB 2017a. The performance of WPA, PSO, and AFSA was compared. The simulation shows that in the optimization design of the topology, the WPA performs significantly better than the PSO algorithm and the AFSA in indicators such as the average remaining energy of nodes, average transmission delay, average packet delivery rate, the coverage of the network, and the number of the surviving nodes. In the simulation environment set in this article, the calculation formulas for the sensor nodes to perceive the data energy consumption, receive the data energy consumption, transmit the data energy consumption, the average transmission delay, and the average packet delivery rate are as follows


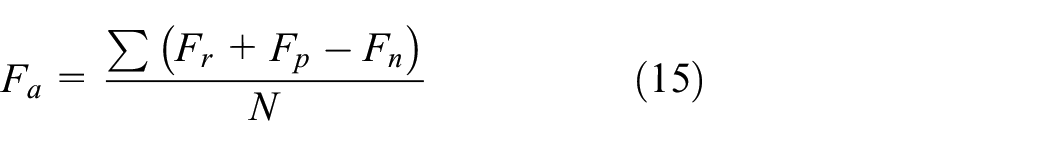
In formula (12), the parameter εs is 60 × 10−9 J/bit, in formula (13), the parameter εr is 135 × 10−9 J/bit, in formula (14), the parameter ξmp is 0.0013 × 10⁻¹² J/bit/m4 is a multipath transmission parameter, and the parameter ξfs is 10 × 10−12 J/bit/m2 is a common space transmission parameter. The control packet length is 200 bits, the parameter Eelect is 45 × 10−9 J/bit, the parameter l represents the data length of the sent data packet, and the parameter l is 4000 bits. The threshold d0 is 87 m, and the initial energy E0 is 1 J. Table 2 shows the simulation environment parameters. For the reliability of the algorithm simulation results, the simulation results in this article are obtained after the algorithm runs 100 times on average. In formula (15), the parameter Fa is the average transmission delay, the parameter Fr is the transmission time of the previous data packet, the data processing time of the parameter Fp, and the arrival time of the parameter Fn to the next hop. In formula (16), the parameter Rgad is the average packet delivery rate, the parameter Trdp is the total number of received data packets, and the parameter Tsdp is the total number of sent data packets.
Simulation environment parameters.

Comparison of algorithm coverage effects
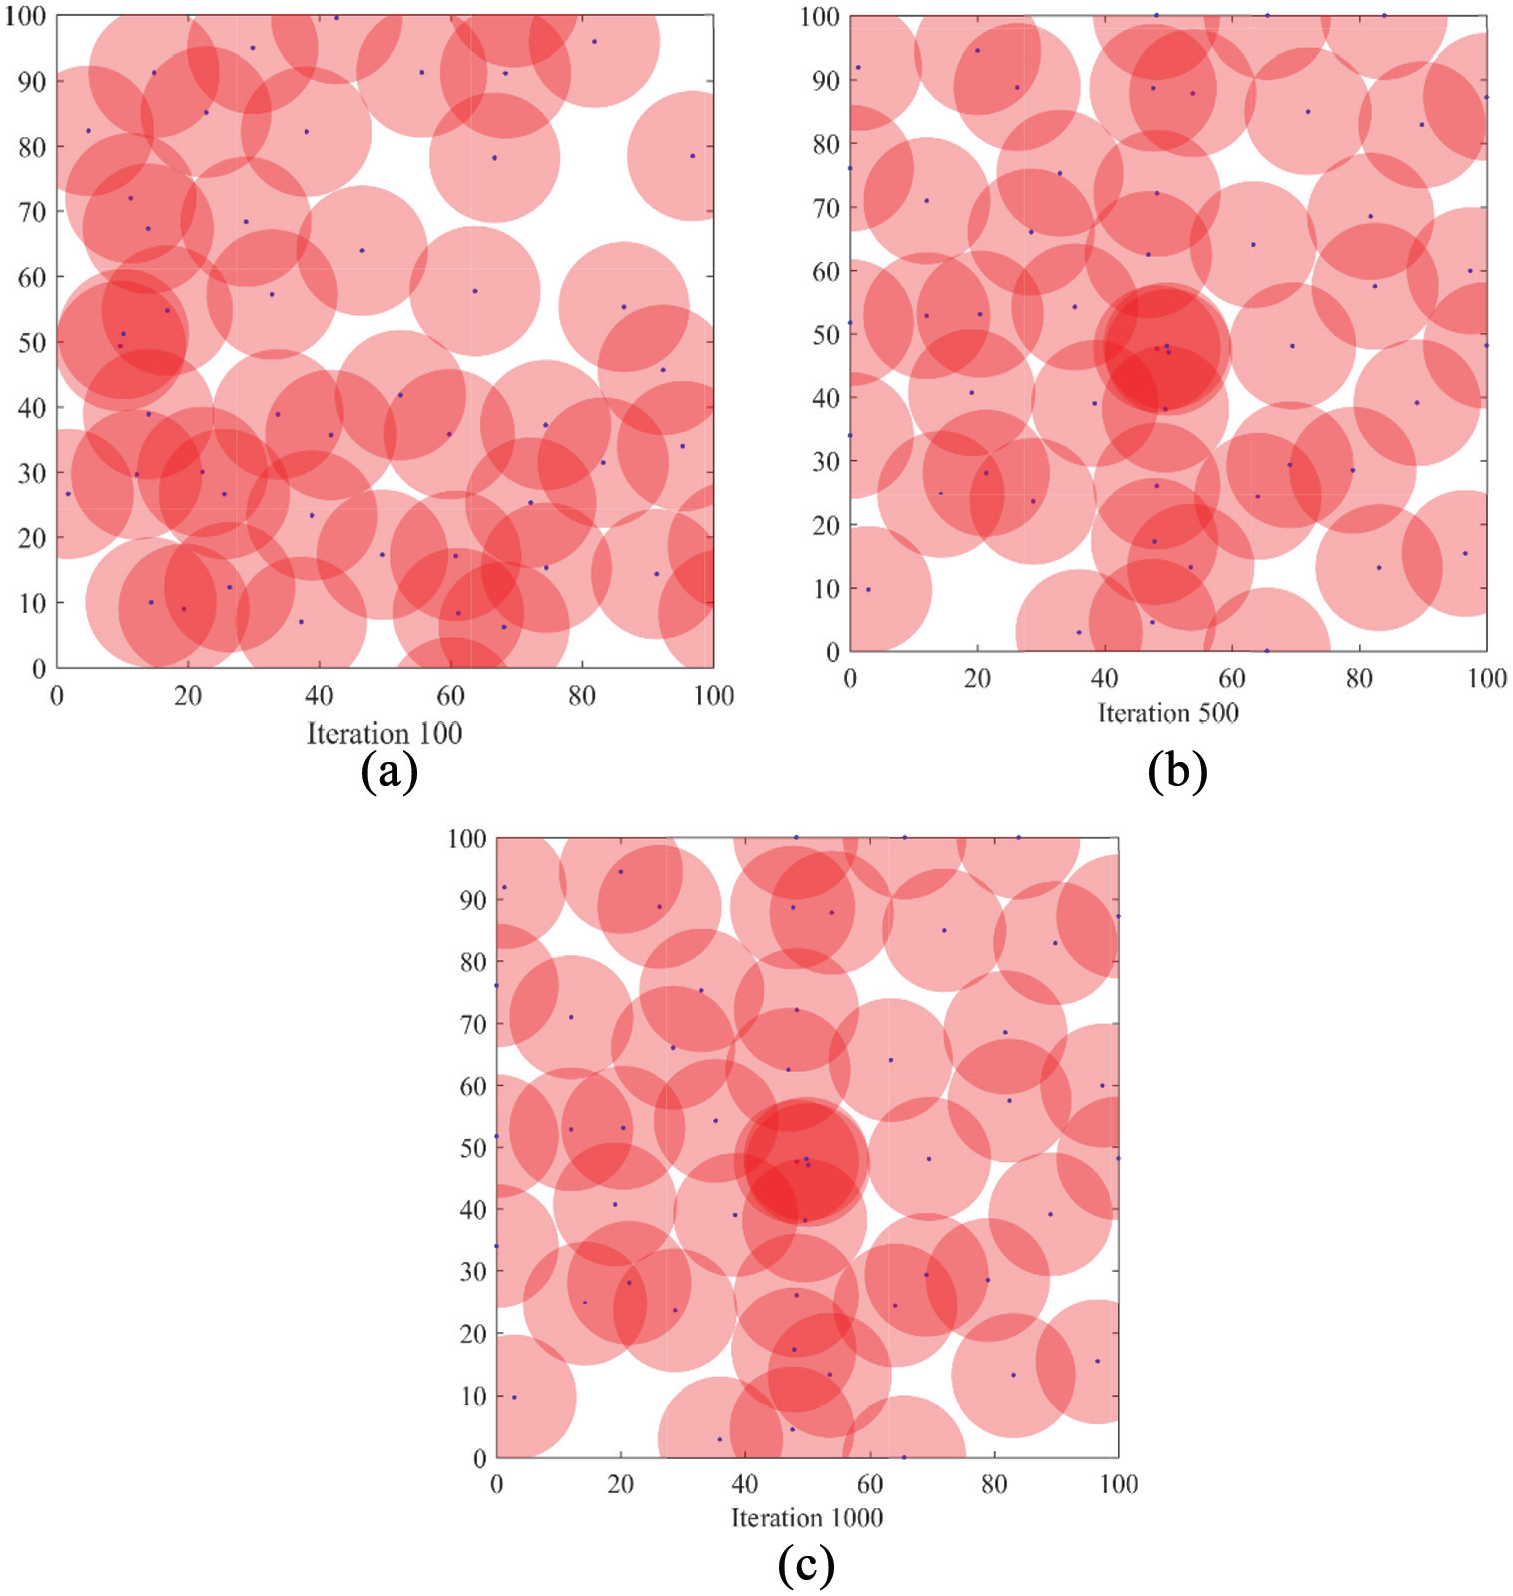
In order to verify the coverage effect of the wolf pack optimization algorithm, it is carried out in a homogeneous network where all nodes have the same perception radius. In order to compare and analyze the coverage performance of the PSO algorithm, the AFSA, and the WPA, the same simulation conditions are used. First, randomly generate the position of the sensor node in the monitoring area. In the figure, a square frame represents the covered monitoring area, “•” represents the location of the sensor node, and a circle represents the coverage area of the node. Figures 3–5 respectively show the final position of the sensor node after PSO algorithm, AFSA, and the WPA optimization.
Coverage effect of PSO: (a) 100, (b) 500, and (c) 1000.

Coverage effect of AFSA: (a) 100, (b) 500, and (c) 1000.
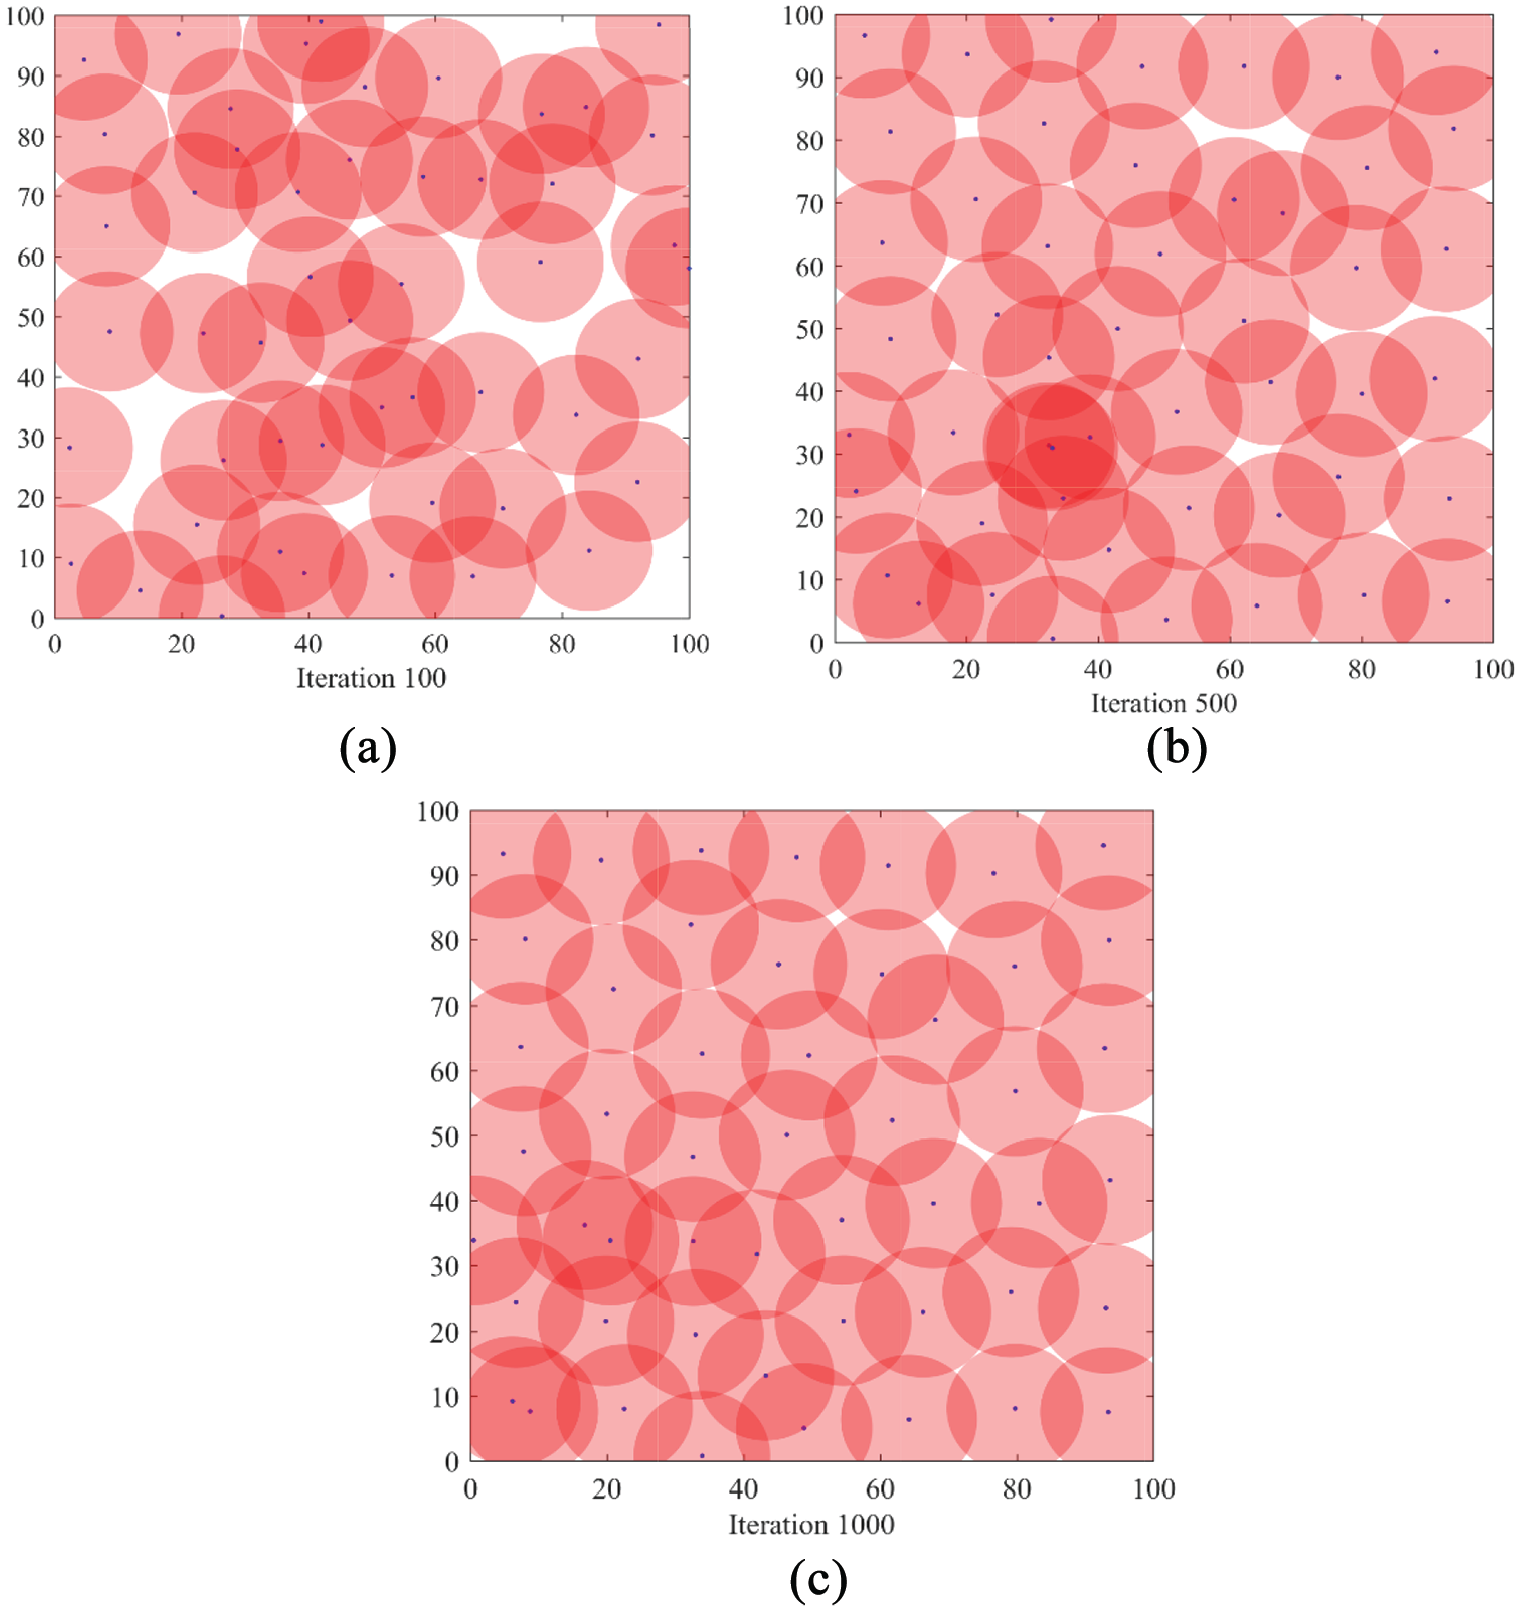
Coverage effect of WPA: (a) 100, (b) 500, and (c) 1000.
Comparing the three node distribution diagrams, it can be found that after the optimization of the PSO algorithm, there is a certain improvement compared to the initial conditions, but the node distribution is very uneven, and there are still a large number of blind spots and repeated coverage areas. After the optimization of the AFSA, the node distribution is more uniform than that of the PSO, and the coverage dead zone and repeated coverage area are reduced, but the ideal coverage effect has not been achieved. After optimizing the WPA, the distribution of nodes is more uniform, and the coverage blind area and repeated coverage area are relatively less. It can be seen from the distribution diagram that the distribution effect of the WPA is obviously better than that of the PSO algorithm and AFSA.
Average remaining energy of nodes
The average remaining energy of a node is one of the important indicators to evaluate whether the sensor network topology deployment mechanism is superior. A good topology deployment mechanism can increase the remaining energy of the sensor node, thereby effectively improving the network life cycle. The simulation results of the node average remaining energy of the WPA, the PSO algorithm, and the AFSA are shown in Figure 6.

Comparison of average remaining energy of the sensor nodes.
Figure 6 shows the remaining energy of the sensor nodes for the three algorithms of PSO, AFSA, and WPA. The average residual energy of the WPA and the AFSA node is higher than that of the PSO algorithm. The sensor network node optimized for the topology of the algorithm in this article has the highest residual energy, and the residual energy consumption is relatively slow as time increases.
Average transmission delay
WSNs have high requirements for the real-time and effectiveness of data transmission. This requires data transmission from the source node to the destination node to overcome many problems such as path congestion, link failure, node energy consumption, and data transmission rate to ensure that the transmission delay is as low as possible. The average transmission delay comparison of the three algorithms is shown in Figure 7.

Comparison of average transmission delay.
It can be seen from Figure 7 that the WPA deployment strategy proposed in this article has a significantly reduced average delay compared to the AFSA and the PSO algorithm, and the deployment strategy based on particle swarm algorithm has the worst effect. This is because the restricted competition strategy of the wolf pack optimization algorithm greatly improves the speed of the subgroup to find the optimal solution, and at the same time avoids falling into the local optimum. On the contrary, the particle swarm algorithm is too large to find the global optimum directly, and the division of labor has fallen into the local optimum. It can be seen from Figure 7 that the average transmission delay of the algorithm in this article is between 0.14 and 0.17 s, and the lowest can reach 0.14 s. The AFSA is between 0.16 and 0.20 s, and the average transmission delay of the particle swarm algorithm is between 0.18 and 0.22 s. A large amount of experimental data shows that the WPA proposed in this article is superior to the PSO algorithm and the AFSA in all aspects of data transmission.
Group average delivery rate
The average packet delivery rate is the ratio of the total number of the received data packets to the total number of the sent data packets. The magnitude of this value directly reflects the reliability of the data transmission. The higher the average packet delivery rate, the lower the packet loss rate, and the more stable the data transmission performance of the WSN. Figure 8 shows the comparison of the group average delivery rates of the three algorithms.

Comparison of group average delivery rates.
It can be seen from Figure 8, in the process of increasing communication radius, the difference in packet delivery rate of the PSO algorithm, the AFSA, and the WPA is becoming more and more obvious. Although all are declining, the packet delivery rate of the WPA proposed in this article has fallen the slowest. When the communication radius is 35 m, the average packet delivery rate of the PSO algorithm is only 42%, and the AFSA is 50%. The WPA proposed in this article still maintains a high delivery rate, reaching 56%.
Network coverage
The coverage of the network is an important parameter to evaluate the quality of the topology. Whether the deployment method is the most effective when the sensor’s sensing range is certain determines whether the network coverage can be maximized. The comparison of the network coverage of the three algorithms is shown in Figure 9.

Comparison of network coverage.
It can be seen from Figure 9 that the convergence speed of the WPA proposed in this article is better than that of the PSO algorithm and AFSA. And from Figure 10, it is found that as the number of iterations increases, the coverage of the network gradually becomes flat, which shows that the convergence speed of the algorithm is accelerated. The proposed algorithm in this paper and the PSO algorithm, the AFSA, the average coverage of the network has increased by approximately 10.5% and 5.6%, respectively. At the same time, the WPA proposed in this article can find the optimal solution with fewer iterations. Compared with other algorithms, the response time is shortened, and the stability has been substantially improved.

Comparison of the number of surviving nodes.
Number of the surviving nodes
The sensor nodes of the WSN have the characteristics of large deployment and wide range. Therefore, the more of the surviving nodes, the better of the network transmission performance. As time increases and node energy is consumed, many sensor nodes will fail. Therefore, it is necessary to increase the survival number of network nodes. Figure 10 shows the number of surviving nodes in the three algorithms.
As shown in Figure 10, it can be seen that the number of surviving nodes in the entire sensor network decreases with time. The PSO algorithm has the phenomenon of node failure at about 100 polling times, and the number of survivors at 600 polling times is only 35, and the survival rate is 70%. The AFSA and the algorithm in this article only have node failures when the number of survivors is about 200 polling times. At 600 polling times, the AFSA survived 38, and the survival rate was 76%. The WPA proposed in this article still has 43 nodes alive, and the survival rate can still be maintained at about 86%. From the comparison of the number of surviving nodes of the three algorithms, it can be seen that the topology optimization of WSNs proposed in this article has the longest network’s lifetime.
From the above simulation results, the topology optimization method of WSNs based on the WPA proposed in this article has better performance than the PSO algorithm and the AFSA, longer network’s lifetime, lower energy consumption, and the better coverage of the network.
Conclusion
Aiming at the problems that need to be solved urgently, such as the topology of WSNs in the industrial application field, the low coverage quality, and short network’s lifetime in the deployment methods, a novel topology optimization of coverage-oriented strategy for WSNs based on the WPA is proposed. The proposed algorithm makes full use of the characteristics of the wolf pack optimization algorithm of the limit competition strategy to optimize the traditional intelligent optimization algorithm, and uses the deployment strategy to improve the energy utilization rate of WSNs and increase the coverage of the network. The simulation shows that the wolf pack optimization algorithm used in this article is effective and reliable, and can better solve related problems such as coverage optimization of WSNs in industrial production and greenhouse agriculture. In the future work, the wolf pack optimization algorithm and its improved methods are applied to mobile WSNs and heterogeneous WSNs in the direction of topology optimization design still need further research.
Footnotes
Handling Editor: Yanjiao Chen
Declaration of conflicting interests
The author(s) declared no potential conflicts of interest with respect to the research, authorship, and/or publication of this article.
Funding
The author(s) disclosed receipt of the following financial support for the research, authorship, and/or publication of this article: This work was supported, in part, by the Natural Science Foundation of Hubei Province under grant 2020CFB304, the Talent Introduction Project of Oujiang College of Wenzhou University, and, in part, by the Science and Technology Program of Sichuan, China (2020YFH0124), the Guangdong Natural Science Foundation of China (2114050002219), the Zigong Key Science and Technology Project of China (2020YGJC01), and the Huzhou Science and Technology Plan Project (2020GG33).