
Abstract
In the current long-term care environment, there is a shortage of manpower and a high turnover rate of staff. Therefore, residential institutions are eager to build an effective Internet of Things integration mechanism to assist institutions with automatic sensor detection and early warning capabilities. Although Internet of Things facilities have enabled prompt notification and warning of emergency events, the following problems exist when implementing Internet of Things in the facilities: (1) low compatibility between sensors has led to excessive installation costs; (2) warning systems that are based on fixed threshold values and lack of flexibility can cause false or omitted reports that result in the incapability of reflecting real conditions and additional labor costs would be required. This study uses a medical-grade Internet of Things module that can calculate the environmental values with edge computing to generate different levels of alarms by combining the index-weighted moving average method to dynamically calculate the optimal threshold value for the environment. It takes 2 months to collect data from care institutions. The average F1-Score obtained in different environments is between 0.46 and 0.88. The results show that compared with using a fixed threshold, this method can effectively reduce sensor error notifications and missed notifications.
Introduction
The rapid growth of the aging population has prompted increased demand for medical resources. According to World Population Prospects published by the World Health Organization (WHO) in 2019, those aged ≥65 years account for 9% of the total global population, and this proportion is expected to increase to 16% by 2050. This means that one of every six people will be older than 65 years. In conventional geriatric care models, older adults are generally assembled in large medical centers to receive care services. Many studies have applied Internet of Things (IoT) technologies to facilitate health care providence.1,2 Aware of the effects of rapid population aging on society and families, governments have focused on establishing policies related to geriatric long-term care (LTC). LTC policies have been researched, developed, and planned through diverse administration systems. These policies mainly support diverse care provision by families, communities, and residential institutions to gradually expand their range of care services to benefit older people; reduce dependence on services in places with concentrated resources, such as large medical centers; distribute medical resources to meet future demands for LTC; and alleviate families’ care burdens. Specifically, the responsibilities of caregivers in residential institutions involve not only general nursing services but also monitoring of patients’ physiological data, which is a crucial component of protecting the health of older adults. In conventional care models, data are recorded manually by nursing staff; reviewing medical records required laborious searches through hard copies of documents, which disrupt and increase the time intensiveness of long-term patient monitoring, further exacerbating the shortage of medical human resources. Patient life and safety are the focus of institutions. Patients residing in LTC institutions generally consist of older adults with chronic diseases who require long-term medical services. In instances of disasters, these older adults are less autonomous or competent than younger people in their responses. Therefore, additional attention is required regarding awareness of disaster prevention and seeking shelter, as well as effective public safety. Although fires cannot be prevented completely, the golden hour for saving patients can be extended. Since long-term care facilities are not like hospitals with many manpower units, they are a part of external organizations. Therefore, in order to solve the problem of human resources, scholars such as Laplante et al. 3 explored how to build a caring healthcare system, designed to provide a good healthcare environment for patients, professional caregivers, and families through a structured framework of the IoT, which has ensured the safety of patients’ lives; by contrast, to monitor institutional environmental safety, this study used the exponential weighted moving average (EWMA) control chart 4 in statistical process control (SPC) 5 to analyze data on temperature, humidity, and air quality recorded by sensors deployed in different environments. The upper and lower control limits of the environmental data were analyzed using several sets of sensor signals to determine the optimal threshold value for an area and send alarm messages to institution staff in instances of environmental abnormalities to resolve incidents.
In the present age of consistent breakthroughs and innovation in information technology, integrated circuit chips have become light and compact, and they have been integrated with emerging IoT technologies. The use of digital and wireless network transmission is gradually driving written and manual operation procedures in institutions toward smart technologies. Moreover, the prevalence of cloud storage has contributed to the development of IoT concepts in mobile health care.6,7 Although IoT devices have been incorporated in institutions, integration of such devices remains difficult due to the devices having different brands. Institutions that require physiological monitoring devices for care and data tracking have a diverse selection of brands to select from. However, the communication modes of these devices may differ. For example, devices using Wi-Fi, Bluetooth low energy (BLE), and Zigbee are mostly wireless transmission technologies used in daily life. To explore whether chronic heart failure increases the ratio of hospitalization among older adults, Fanucci et al. 8 developed several biomedical devices with Wi-Fi communication for hospitals to monitor personal physiological data. Ohmura et al. 9 addressed nurses’ caring behaviors and deployed several wearable Bluetooth devices called “B-packs” inside hospitals to track and record health care services provided in the hospital.
Currently, several front- and back-end technologies integrated with biomedical10–12 and environmental systems13,14 have been produced on the basis of IoT concepts. These technologies are suitable for institutions that specialize in LTC and data tracking. However, technologies in the biomedical and environmental fields remain separate. For these institutions, introducing several incompatible devices for wireless data transmission would involve cost-intensive installation and communication incompatibilities among data integration systems. Therefore, integration is indispensable. By considering the crucial factors of rescuing and preserving life as well as data tracking, this study had the following three goals:
Combine wireless transmission technologies with cross-domain gateways to connect biomedical and environmental sensors and develop edge computing technology to determine signal conditions in advance, thereby increasing time-effectiveness in two-way signal transmission.
Use sensor data that were analyzed and integrated using the control chart of the SPC to dynamically calculate optimal threshold values monthly to reduce false and missed alarms from the site and accurately send alarm messages to institution staff.
Process data correspondingly, provide assistance according to data on emergencies and the degree of urgency transmitted from the sensor, develop smart care services in residential institutions, and create adequate living environments for geriatric care.
Related work
This section consists of four parts. Section “Application and integration of information and communications technology in medicine” explores the development of information and communications technology applications in the medical field; section “Cross-domain gateway designs” analyzes the internal design of cross-domain gateways; section “Embedding and application of edge computing” briefly describes the relevant research on using edge computing to reduce redundant data; and section “Dynamic threshold adjustment” explains current methods of data monitoring in combination with SPC.
Application and integration of information and communications technology in medicine
This study focused on institutions requiring LTC services. IoT technologies have been introduced to resolve recording problems but have yet to be informationized, and modes of integrating health care and information in large medical centers were imitated. For example, Kodali et al. 15 integrated IoT into the medical systems of hospitals. They used Zigbee wireless transmission technology, which not only minimized power consumption and extended the battery life of devices but also integrated the medical information of various distributed devices. Information was transmitted to a cloud network, which collected, stored, and analyzed large amounts of data, and activated alarms according to situations thereby enabling the regular tracking of patients’ physiological parameters while increasing care quality and reducing care costs.
In 2019, Kang et al. 16 designed a questionnaire to learn about demand among 1086 medical staff for IoT devices; the questionnaire included items on patient safety and hospital environment. The results indicated that medical staff considered functions that enabled IoT systems to conduct immediate tracking of patients’ physiological data and remote data transmission as the most urgent demand requiring integration. This is because medical staff must often evaluate patient stability to rapidly understand and provide assistance for changes in the patients’ situations. The study indicated the large demand for embedded physiological data systems in institutions. Similarly, the study focused on the connection between physiological measurement devices and back-end health data platforms to reduce caregiver workload.
Cross-domain gateway designs
The diversity of IoT applications and communication protocols has increased the threshold for the integration of IoT devices to a cloud by means of wireless transmission. A complete set of gateways for cross-domain communication protocols are required to achieve data transmission among different protocols in clinical practice. For example, Amiruddin et al. 17 developed three types of communication protocols in a cross-domain gateway, selected the wireless transmission corresponding to the communication protocols used by diverse IoT devices, and integrated the data received by the three communication protocols. In 2018, Vargas et al. 18 proposed a design for an intermediate gateway layer that involved the following steps: (1) data conversion: JavaScript Object Notation was used as the standard data format; (2) data processing: information processing was conducted to reduce delay time; (3) protocol conversion: data were matched selected, and used according to different communication protocols; (4) data storage: device data were uploaded to a cloud archive through Ethernet using the TCP/IP transmission mode for cloud computing and data storage. In 2015, Al-Fuqaha et al. 19 introduced IoT technologies, protocols, and procedures to explain exchange and matching among different communication protocols as well as their application in IoT services. This study referenced and combined the intermediate transmission structures in the aforementioned literature with MQ Telemetry Transport (MQTT) lightweight data transmission to establish the communication bridge between the gateway and the cloud server for uploading sensor data.
Embedding and application of edge computing
New communication network structures have been produced to respond to problems of delay and high demand for network bandwidth. These problems occur when numerous IoT devices send data through the gateway to the cloud for computing. In residential institutions, when an emergency occurs in an immediate physiological monitoring system, uploading data to the cloud for computing and then to the emergency department is time intensive in conventional communication network structures. To solve this problem, edge techniques are used to facilitate distributed implementation; their similarities with the devices are used to facilitate early response to urgent cloud computing needs to remove redundant data and send only filtered data to the cloud for complex analysis or permanent storage. This reduces the transmitted data volume, power consumption, network bandwidth, and delay.20,21 In 2015, Rahmani et al. 22 proposed a patient monitoring system for medical environments; they used edge computing to develop the Smart e-Health system and employed the smart gateway UT-GATE to achieve distributed computing in smart health care, thus improving services involving medical data requiring immediate response. In 2017, Morabito et al. 23 used a lightweight edge gateway IoT to create a network of IoT devices that enabled three functions, namely, expansion, intercommunication, and optimization. Ren et al. 24 added a core network layer to the IoT structure; during data transmission from the IoT device to the edge service device (such as gateways, mobile phones, and computers), the core network layer was used to exchange and process data, and the results were sent to the cloud for access.
Currently, the embedding and application of edge computing have reached certain extents of development and effectiveness. This study developed a gateway with edge computing functions as the transmission mode in the IoT environment. Edge computing was used to achieve distributed data processing, and the computation and analysis of patient physiological data or sensed environmental data were performed immediately. For example, Mahmoud et al. 25 introduced edge computing and applied it to remote patient monitoring in health care; simulations were conducted in environments with four hardware configurations. The results indicated that power consumption, bandwidth, and delay in transmission could be effectively reduced using a fog computing environment, which was particularly evident in complex hardware configurations. In addition, in 2017, Gia et al. 26 used a health monitoring system based on IoT concepts to track an individual’s health situation. By means of edge computing through the gateway, they reduced the delay in the transmission of sensor signals to the system and subsequently to the remote cloud server. The results indicated that edge computing increases transmission efficiency and provides immediate responses with minor delay.
Dynamic threshold adjustment
In the clinical areas of residential institutions, the main goal of deploying diverse devices is to preserve life, health, and quality in patients’ health and safety. However, simultaneous monitoring by numerous devices and their abundant alarms causes power consumption by edge nodes and overloads the bandwidth.27,28 In addition, the alarms are not entirely accurate in conveying the emergency aid patients actually require.27,29 False or missed alarms increase the distrust of caregivers and patients’ families toward IoT devices that monitor health status as well as toward the institution care environment. Therefore, the devices must have a decisive function for judging incident reports. Regarding safety considerations for ensuring the accuracy and immediacy of alarms in the care environment, the optimal effect was achieved by collecting data with relevant devices and using adjustable threshold value settings.
In clinical experiments, criteria for the assessment tools and processes employed in different situations have been established regarding alarm systems that send alarm messages, such as EEMUA-191 and ISA-18.2.30,31 Alarm system performance is assessed using four indexes, namely, the averaged alarm delay, missed alarm rate (MAR), false alarm rate (FAR), and chattering. SPC can be adopted in non-controlling situations to improve alarm system performance. Control charts with set upper and lower control limits are commonly applied in various industries to monitor the transmission of device data. This includes EWMA control charts, which are primarily used to monitor minor changes in the data. To enable the system to effectively change its settings in correspondence with difference situations, the upper and lower control limits of the control chart are adjusted according to historical data. This method is compared with other statistical processes for threshold control as shown in Table 1. Although other methods are also used for threshold adjustment, in this study, the analysis of data from long-term care institutions requires consideration of the effect of the initial threshold and each data is calculated independently, so the weighted moving average method is more appropriate. Freitas et al. 32 used the EWMA control chart to monitor toilet water consumption with different flush buttons, and sought reasons when the warning line was surpassed. Aquino proposed an EWMA-based system to monitor driver fatigue by detecting a vehicle’s lane departure. The system detects vehicle trajectory using acceleration sensors, which operated in coordination with the upper and lower control limits of the alarm value in the control chart to evaluate fatigue. 33 Aparisi and Carlos García-Díaz 34 employed a genetic algorithm to optimize parameter adjustment in EWMA and multivariate EWMA charts and obtain optimal statistical results. Dynamic adjustments of threshold values using such a method are suitable for the institutions of interest in this study, which aim to establish a mechanism for fine-tuning emergency alarm values and acquire optimal settings for different situations.
Adaptive threshold literature comparison table.

Methodology
On the basis of preserving patient life, health, and care quality, several IoT devices were integrated with smart care services in residential institutions to increase the convenience for nursing staff to control patient data and institutional environments. The system context diagram is presented in Figure 1; the user steps are (1) use IoT nodes of different communication methods to measure physiological and the environmental data, then uploaded the data to the gateway; (2) integrate the data of each IoT node through a multiple-communication gateway and use the set alarm threshold to determine whether the data branches was toward an emergency alarm or the cloud service; (3) saving device data in the archive of the cloud server and presenting such data in charts on the health data platform; (4) apply the collected data to adjust the alarm threshold of the environmental device; (5) designate a department to which the alarm is reported to according to the alarm levels set on the device; and (6) remove the reminder window from the data platform after the designated department resolved the incident.

System context diagram.
Application and planning of residential institution care
Although data recording by IoT devices in institutions are relatively complete and transmit detailed information, viewing the data by entering respective systems is inconvenient for these institutions. In addition, the devices are loosely deployed without intention to integrate device data. Therefore, a joint test was conducted on IoT devices conventionally used in institutions, which mainly involve patient physiological measurement and institution environmental monitoring. The data of each wireless communication device was integrated through the cross-domain gateway and longitudinally linked to the health data platform to enable institution nursing staff to manage both patients and the overall environment, achieving the three core concepts of preserving life, health, and quality.
Physiological measurement devices
To effectively protect the health of patients in different beds of the institutions, measurement devices for the long-term recording of personal physiological data were employed, namely, blood pressure monitors and forehead thermometers. By using these devices to record the patient’s data daily and having the data transmitted to the health data platform, professional nursing staff can effectively track the health statuses of older adult patients and regularly perform evaluations to enact preventive care. These devices can be set to detect second-level emergencies in the hierarchy of alarms. The threshold value, which also serves as the alarm activation value of the blood pressure monitor and the forehead thermometer, was referenced from the hypertension standard stipulated by the WHO (systolic blood pressure >140 mmHg, diastolic blood pressure >90 mm Hg, at the same time, we remind the test subject to follow the American Heart Association’s 38 recommended measurement guidelines: (1) remain calm, (2) sit upright and keep the measured hand flat, (3) try to keep the same measurement period each day, (4) measure multiple sets of data at the same time, as a standard procedure) and the standard for fever as stipulated by the Ministry of Health and Welfare, Taiwan (body temperature >37.5°C). In addition, according to Chen, 39 body temperature has become one of the most essential vital signs for clinical diagnosis and daily health care. In the same study, Wunderlich et al. showed that the average axillary temperature measured in 25,000 subjects was 37.0°C. The normal temperature is usually between 36.2°C and 37.5°C.
Environmental monitoring device
The hierarchy of alarm procedures for the environmental monitoring device in this study ranged from “most urgent” to “not urgent” events; temperature, humidity, and air quality were monitored. In a general living environment, air monitoring is mainly based on carbon dioxide, carbon monoxide, natural, and so on. If further data collection is needed, more advanced reception design will be based on the detection of suspended particulates; the more commonly used sensors are Arduino Sensors MQ-135 or MH-Z14A. The threshold value was set in terms of the dynamic threshold; the IoT device could intelligently send signals to the backend to trigger an emergency alarm in instances of an accident, accelerate the reporting of patients, and prevent delays in reporting due to over-panic and physical discomfort, thus preserving patient life and care quality.
Design of edge computing and alarm threshold
In LTC institutions, events that trigger an emergency alarm often endanger patient safety. In an emergency, although a crisis can be resolved by informing the emergency center immediately, medical resources might be wasted if an incident is not urgent. Therefore, reporting should be conducted in phases according to the degree of danger. The degree of danger can be determined using the threshold settings on IoT devices, and the problem of false and missed alarms can be solved with accurate threshold values. However, a single fixed threshold value would yield many false and missed alarms, because some situations may not reach a threshold that requires an alarm. Moreover, a single threshold value cannot be corrected when caregivers respond to actual situations, which would increase the burden on caregivers, the emergency department, and families. Therefore, we used the EWMA method for threshold value adjustment to appropriately address situations in the institution environments and reasonably revise thresholds. This mechanism was used to fine-tune the alarm threshold to match it with actual situations in residential institutions.
Multiple-communication mode of edge computing
In conventional data transmission, messages are sent to a remote server for analysis, and the type of alarm selected is determined by the result. This process wastes transmission time and consumes large amounts of data. The prime priority in residential institutions is to inform caregivers and report incidents to the emergency department as soon as possible. To achieve this goal, this study used the concept of distributed computing to a gateway, which included various wireless communication modes such as Wi-Fi, BLE, and Zigbee. The cross-domain gateway hardware is depicted in Figure 2. Emergency judgment was performed within the gateway though programming, and crisis signals were sent to the emergency department according to the publish/subscribe mechanism of MQTT, which enabled rapid reporting.

Cross-domain gateway.
Edge computing and analysis were first conducted on the device signals. In clinical usage, alarms are sent immediately not only when devices detected emergencies. Rather, alarm levels were judged through communication among multiple devices and analysis of data groups; the degrees of reporting were classified mainly according to “preserving life” (most urgent), “preserving health” (secondary urgent), and “preserving quality” (not urgent). The alarm value of the device was set in accordance with WHO standards. Figure 3 presents the phases of alarm procedures used in this study. The method of reporting was adopted according to the urgency of each incident, and the initial step was selected subsequently. The phases of reporting consisted of the following four steps: (1) a notification appears on the system window; (2) a message is sent to the caregiver or the system manufacturer; (3) a message is sent to institution supervisors; and (4) a report is sent to the emergency center. Situation 4-Fire (the sensor data for temperature, humidity, and air quality all surpassed thresholds) was the most urgent situation (level 3), which required rapid reporting to the emergency center; Situation 3 represented secondary urgent events (level 2) and required the caregiver to make an overall judgment on the numerical physiological values; Situations 2 and 1 were not urgent (level 1), and notifications were mainly used to remind institution staff to pay attention to general protocol or IoT device connections. The reporting of abnormalities was accelerated through the hierarchical alarm procedure. An incident was reported to the next higher level after the system determined whether the incident was solved to ensure that incident alarms were addressed and completely resolved by medical professionals.

Branching diagram for alarms in phases.
Emergency alarm threshold
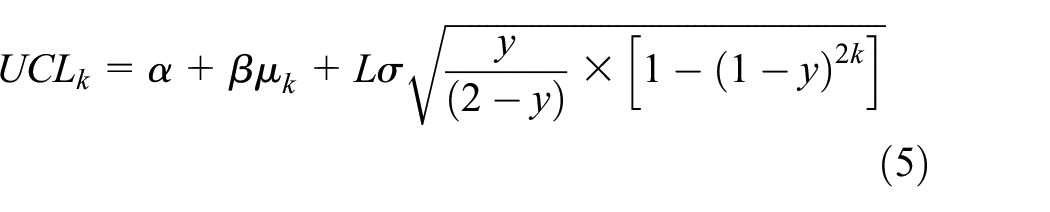
This study used SPC to monitor the transformation of environmental numerical values to remind institution staff to enact corrective measures when a situation was beyond control and to remove the causes of changes, such as fire and excessive carbon monoxide. A control chart mainly comprises the central line, which represents the mean of the data, and the upper and lower control limits, which are used to determine data range limitations. As previously discussed in section “Dynamic threshold adjustment,” EWMA has been calculated independently of the data and does not require the fusion of multiple data, and is influenced by the initial thresholds when calculating the fitness thresholds. We selected the EWMA control chart for its wide applications in industrial control and financial monitoring and because its threshold values are calculated according to historical data, which enable the detection of small changes in a time series. As demonstrated in equation (1),

FAR was defined as a triggered alarm under normal conditions in a particular situation. By contrast, MAR was defined as the absence of an alarm under abnormal conditions. The situations of patient health and institution environment varied according to the clinical contexts of residential institutions. Therefore, the threshold value settings for devices used in different situations should be adjusted accordingly based on the monitoring conditions to make customized judgments.
In the calculation of the center line and the upper and lower control lines, a trial calculation will be carried out according to equations (2)–(4) into the institution’s past month data, where


The threshold value was designed and fine-tuned in accordance with this mode, which reduced the occurrence of false alarms. Appropriate threshold adjustment was critical for residential institutions using IoT devices for monitoring. In the actual test, such a mechanism not only achieved suitable accuracy in automatic monitoring for nursing staff but also ensured resident safety in precise manner and provided an assuring care environment for patients’ families.
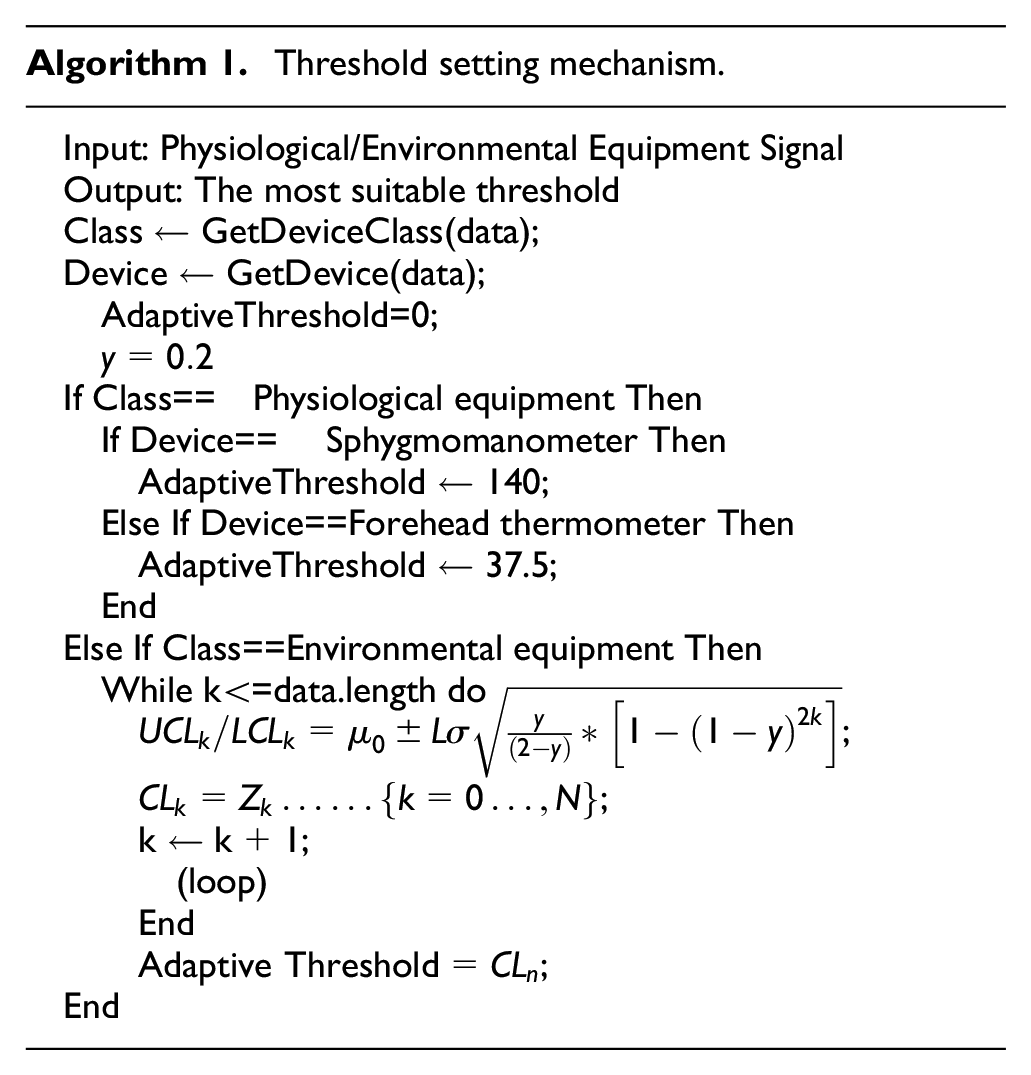
Algorithm 1 represents the mechanism for setting the dynamic threshold using the aforementioned equation. The type of IoT device is input on the first line as the signal source in threshold setting; the fourth line indicates the weight parameters used in the algorithm calculation; the 5th–19th lines are the discriminants that set threshold values according to the IoT device types. The parameters of the physiological devices were set according to international official standards, and the environmental devices were set using exponential weighted average calculations.
Result
This study successfully deployed physiological and environmental monitoring devices in a clinical residential institution for LTC and developed a system that featured a cross-domain gateway for the intelligent integration of environmental sensor signals. The system functions include authority control, patient management, setting device activation times, alarm reminders, and visual data chart presentation. In addition, responsive web design functions were added to ensure that the optimal layout configuration was available in different browsers. The results of deploying monitoring devices in the clinical environment and the dynamic thresholds are discussed subsequently.
Experiment environment
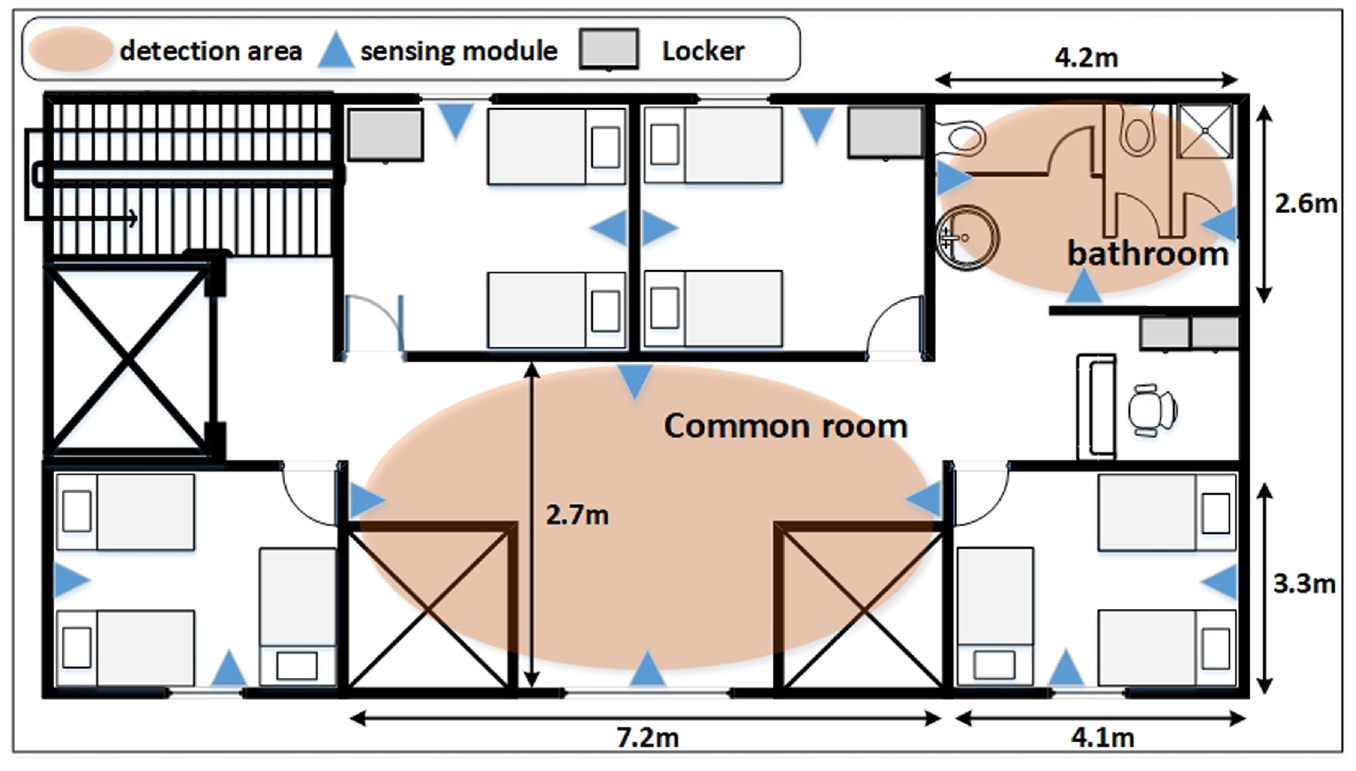
In this study, physiological and environmental monitoring devices were mainly deployed on the ninth and first floors of a clinical residential institution for LTC. Figure 4 presents the overall system design and experiment procedures. First, devices were deployed in two steps: (1) the cross-domain gateway was first linked to mains electricity and connected to the area network, and the flashing indicator light meant a successful connection for transmitting data to the backend and (2) physiological measurement (blood pressure monitor and forehead thermometer) and environmental monitoring devices (sensors for temperature, humidity, and air quality) were deployed on the ninth and first floors to monitor changes in the environmental numerical values. Figure 5 presents the deployment of sensors in each area on the ninth floor, which included four wards (4.1 × 3.3 m2), each of which had two sensor sets; a lobby (7.2 × 2.7 m2) with four sensor sets; and a bathroom (4.2 × 2.6 m2) with three sensor sets. Figure 6 presents the deployment of the three sensor sets in the kitchen (2.2 × 7.6 m2) on the first floor. The number of sensors deployed depended on the dimensions of the area; data authenticity and accuracy during the monitoring of environmental numerical values in an area were ensured by deploying multiple sensors sets. Second, software deployment involved the setting of the cloud server and installation of mobile applications; patients in each bed were recognized through the QR code scanning function in the application, and physiological data from the devices were uploaded to the cross-domain gateway for edge computing. The data were then sent to the cloud archive after they were confirmed to be normal. Third, signals from the environment were collected every 5 min by the deployed sensors; physiological signals were measured in the morning, at noon, and in the evening. Finally, threshold values were adjusted in the cloud server according to the environmental signals collected over the previous month to reduce the FAR and MAR.

Deployment flowchart.
Deployment diagram for the ninth floor.

Deployment diagram for the kitchen on the first floor.
System test results
Because of its implications for personal safety, the alarm thresholds for physiological signals could be altered only after judgment by professional doctors. Therefore, thresholds were set in this study in accordance with international official standards. The numerical values for environmental signals collected by IoT sensors in each area of the LTC institution were different; using the same alarm threshold would cause false and missed alarms. Therefore, the most suitable alarm threshold for each area was adjusted using the EWMA method, thereby enabling professional medical staff to accurately and rapidly identify abnormalities requiring resolution by using the system. The devices mainly recorded the air quality of the lobby, bathroom, and kitchen in the institution; the alarm threshold was adjusted dynamically according to the environmental data from the previous month, and the results of threshold value adjustment by the system were tested.
The equations of the confusion matrix were employed to verify the dynamic threshold adjustment results. When an actual emergency event is correctly identified and assessed, the threshold is true positive (TP), and the system issues a warning. When a normal event is correctly identified and assessed, the threshold is true negative (TN). When a normal event occurs but is assessed as an emergency event, a false positive (FP) occurs; when an emergency event occurs but is assessed to be a normal event, an FN occurs (Table 2).
Confusion matrix for event assessment.

TP: true positive; FP: false positive; FN: false negative; TN: true negative.
Because emergency events are relatively rare in clinical institutions, assessing the threshold on the basis of accuracy only can generate extreme values. Therefore, the F1 score was employed for threshold assessment through the use of precision and recall in value calculation, demonstrated as follows:


Figures 7–9 present the ambient air quality data measured over 1 month in the common room, bathroom, and kitchen, respectively. The x-axis indicates time, and the y-axis indicates the air quality measured during environmental monitoring; four sets of sensors were placed in the common room because of its size, whereas three sets of sensors were placed in the bathroom and kitchen. Fault detection included several simulated incidents of surpassed limits to verify the accuracy of dynamic threshold adjustment.

Detected air quality in the common room.

Detected air quality in the bathroom.

Detected air quality in the kitchen.
The three data charts indicated minor differences in the numerical values obtained by the sensor sets in the same areas, implying the high accuracy of the environmental numerical values. The air quality data chart was adopted as an example of collected signals; the dynamic thresholds for temperature and humidity of the areas were also adjusted according to this method of data averaging, and they served as the source of data that were input in the EWMA method.
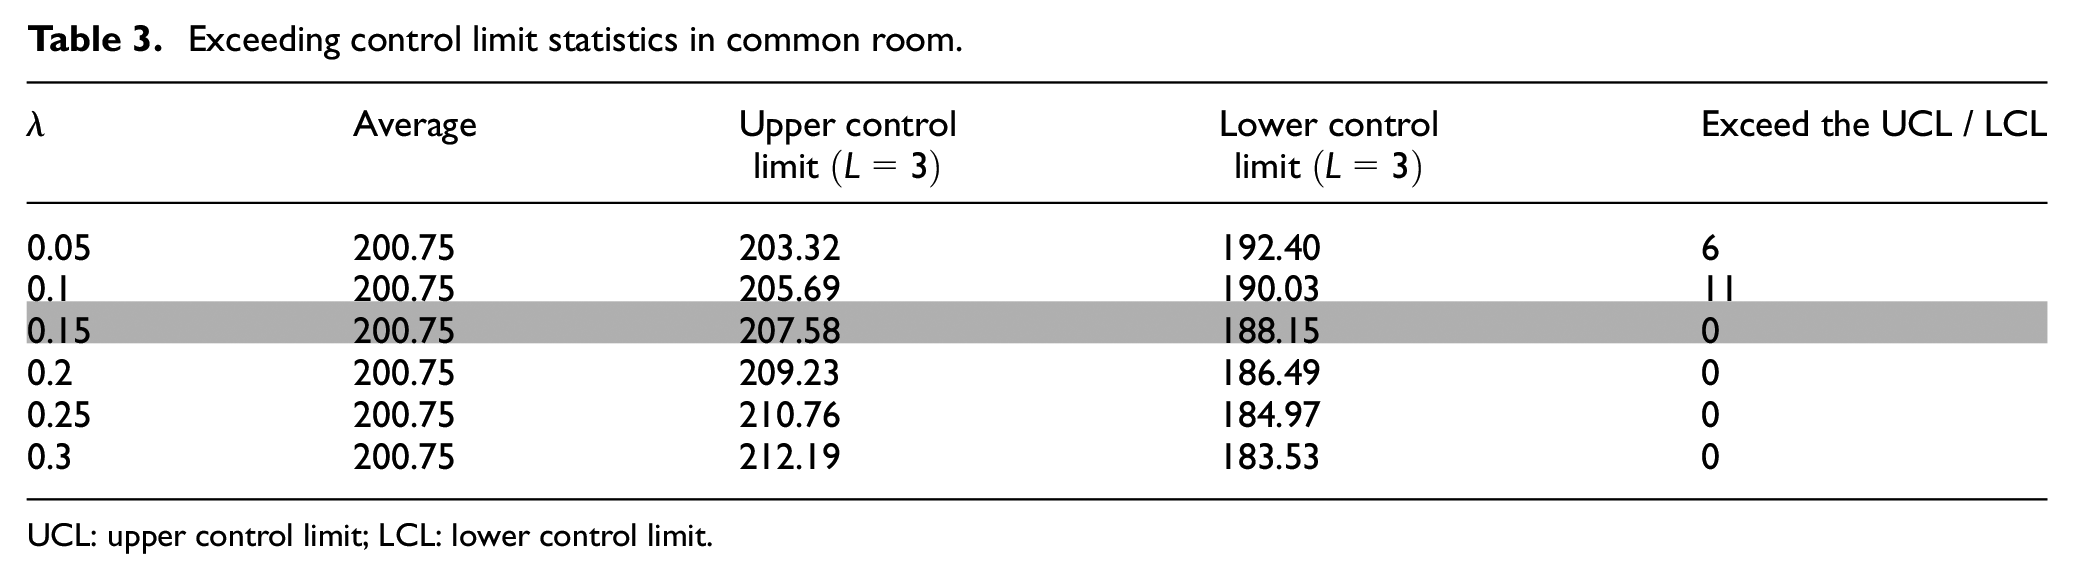
Table 3 presents the upper and lower control limit values calculated with diverse weights by substituting the common room air quality data into equations (2)–(6). As illustrated in Table 3, it can be found that when λ = 0.15, the EWMA value will not exceed the upper and lower limits, and most studies point out that the commonly used weight is 0.2. Therefore, during the planning process, the thresholds of the three fields are adjusted to weight = 0.15 calculation.
Exceeding control limit statistics in common room.
UCL: upper control limit; LCL: lower control limit.
Figures 10–12 present the results of dynamic threshold adjustment for temperature, humidity, and air quality, respectively, in the common room, bathroom, and kitchen. Use lines of different colors to distinguish these three areas. In particular, the solid line represents the data value and the dotted line represents the fixed threshold. The dotted line represents the threshold adjusted based on 1 month’s data. The figures indicate that the dynamic threshold values of the three areas varied by monitored section.

Dynamic temperature threshold adjustment.

Dynamic humidity threshold adjustment.
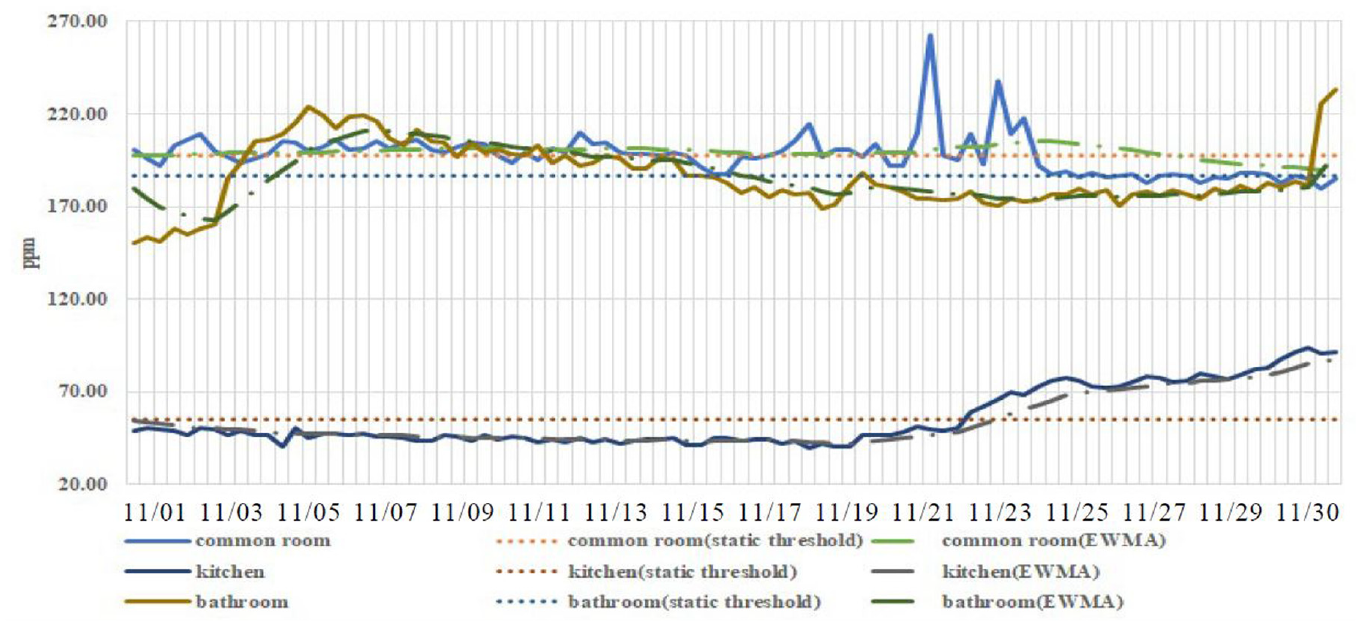
Dynamic air quality threshold adjustment.
Data were gathered for 2 months, and extreme values were observed from the graph. After a discussion with site personnel, we determined at what time there appeared emergencies in the area. Therefore, in the early stages of research, the extreme values were eliminated before data collation and analysis, and the adaptive threshold settings were repeatedly calculated within the intermittent time. Finally, the adaptive threshold values were verified with the fixed threshold values (Figures 10–12). The data were collected from the air quality sensors in the bathroom, kitchen, and common room for 2 months. After the data in the first months were organized, the adaptive threshold settings devised in this study were compared with the fixed threshold values.
Most studies have determined healthy air quality to be 0–50 ppm. In the present study, the mean of the data in bathroom from the first months was adopted as the fixed threshold setting for the second month (186.68 ppm). Because the bathroom remained a highly humid environment for an extended time, the vapor from hot water caused humidity, temperature, and parts per million to rise, and false reports may have resulted from the use of a fixed threshold value. Site personnel confirmed that this was caused by the caregiver providing a hot water bath to the patient outside of the routine showering time, potentially leading to a labor shortage. The method proposed in this study provides reminders to care supervisors not to use the bathroom outside routine showering times.
As demonstrated in Figures 10 and 11, because of the frequent use of cooking devices, water vapor was generated and the humidity and temperature in the kitchen were increased. As shown in the line chart, the value was relatively low before 11/15 but high at other times. Many false and missing alarm warnings were yielded through use of the fixed threshold value, whereas adaptive threshold settings yielded long-term warnings; the adaptive EWMA threshold settings outperformed the fixed threshold values as a warning system.
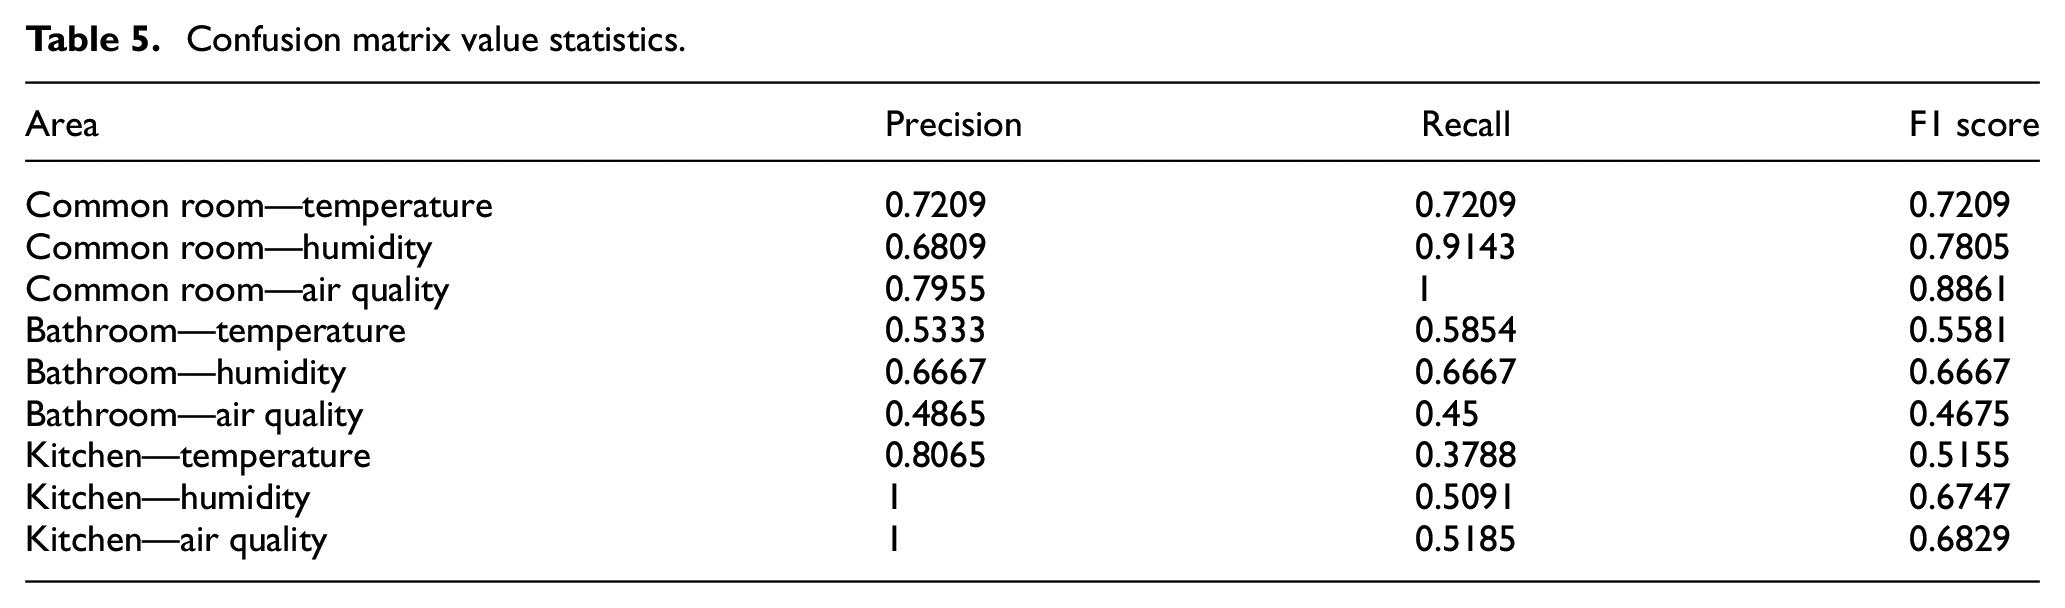
Table 4 presents the FAR and MAR values by substituting the common room, kitchen, and bathroom’s sensor data into equations (7)–(9) to obtain confusion matrix values. As illustrated in Table 5, the F1 score of common room’s EWMA was between 0.72 and 0.88, the F1 score of bathroom’s EWMA was between 0.46 and 0.66, and the F1 score of common room’s EWMA was between 0.51 and 0.68.
MAR/FAR statistics in three areas.

MAR: missed alarm rate; FAR: false alarm rate.
Confusion matrix value statistics.
Conclusion
This study employed the factory adjustment method of false alarm sensitivity in a residential institution. The IoT was applied to create a smart sensor environment providing rapid reports of environmental value changes to institutional personnel in various areas. The system established in this study consisted of IoT equipment for physiological and environmental detection, a mobile device app, a cross-communication gateway, and a cloud sever. Only the threshold values related to the environment were adjusted in this study; we believe that physiological warning thresholds should be set according to the standards formulated by the WHO. By contrast, the range of environmental warning thresholds should be adjusted according to the characteristics of an area. Although unsatisfactory environmental quality does not directly threaten human lives, long-term exposure to hazardous air quality, nevertheless, damages physical and psychological health. Therefore, information and communication technology should be employed to provide prompt warnings regarding abnormal physiological and environmental data to institution personnel and to enable professional caregivers to track patients’ health and site conditions on a long-term basis.
Warning thresholds should change according to the environment. Therefore, in this study, threshold values were automatically adjusted according to historical data through the use of exponentially weighted moving averages, and six distinct weight values were employed to calculate warning accuracy. The results indicated that the accuracy was the highest when the weight equaled 0.15; the weight value thresholds were adjusted to the optimal state. Accordingly, dynamic threshold adjustment enables optimally accurate issuance of warnings. Edge computing was conducted to initiate phased notifications in advance to enable the cloud server to filter redundant data, thereby reducing data travel time, effectively accelerating emergency notifications, improving the quality of care, and gradually expanding the application of decentralized care.
On the basis of the artificial intelligence warning system established for a residential institution in this study, future studies can employ IoT facilities for improving environmental quality (e.g. smart windows and air purifiers) to enable automatic air conversion in abnormal environments, thereby saving time from manual abnormality solution. In addition, the relationship between residents’ physiological data and the weather should be considered, and machine learning can be implemented to predict residents’ physiological responses to the environment to enable the adjustment of air quality to its optimal state. In addition, the monitoring of physiological data of patients and the environmental data of the institution are confidential data. Furthermore, it includes the protection of personal data, the correctness of information transmission, and the inability to be maliciously modified. The security of the transmission process is extremely important. In the current IoT architecture, if data are transmitted wirelessly, special consideration must be given to the important issue of information security. Since there is no consistent method and mechanism to ensure the security of transmission that can be followed by residential organizations, there are still many deficiencies in the security of data transmission, and most of them rely on hardware and software firewalls to establish a basic security and protection mechanism for information data. What we can do now is not only to establish the above security mechanism, but also to train the users on the basic information security concept, and to identify the personal information as much as possible. As a whole, there are still many deficiencies in information security in the IoT environment. In this article, we focus on the actual operation of receiving physiological and environmental signals, and the design of a simulated environment to observe the results. In the future research, we will carefully consider the data security issues in data transmission with reference to other good practices and should provide better solutions in time.
Footnotes
Handling Editor: Francesc Pozo
Declaration of conflicting interests
The author(s) declared no potential conflicts of interest with respect to the research, authorship, and/or publication of this article.
Funding
The author(s) disclosed receipt of the following financial support for the research, authorship, and/or publication of this article: This research is supported by the Ministry of Science and Technology of Taiwan under grants MOST109-2221-E-227-002-MY3 and MOST110-2622-E-227-001-.