
Abstract
Aquaculture is the world’s fastest-growing food production sector, yet it lags behind other industries in adopting upcoming digital technologies. Challenges, such as integrating multimodal data and maintaining reliable network connectivity, have hindered the development of digital twins for monitoring aquaculture systems. This paper addresses these challenges through two main contributions: (i) a novel edge-based architecture for digital twinning that enables distributed, localized monitoring and actuation, reducing dependence on centralized systems and robust networks; and (ii) a three-stage algorithmic approach for mortality monitoring tailored to edge computing environments. This approach enables early detection of rising mortality rates using data fused from diverse sources, including directly monitored environmental parameters (e.g. pH and temperature), and novel optical biosensors that make use of lightweight computer vision and machine learning techniques for the estimation of bacterial concentrations within edge devices. The algorithmic strategy was tested in a real-world recirculating aquaculture system for Solea senegalensis, where bacterial concentration was estimated with an F1-score of 0.83 across five concentration levels using biosensor imagery. Moreover, a multimodal drift detection algorithm successfully identified abnormal data trends aligned with significant changes in input distributions, with preemptive drift signals preceding critical 7-day mortality spikes.
Introduction
Aquaculture is currently the fastest-growing food production industry in the world (Akber et al., 2020), consolidating its place as one of the key sectors of agriculture. Aquaculture’s expansion has been a decades-long process, largely attributed to a stagnation in the capabilities of capture fisheries (Ahmed et al., 2019), combined with a ceaseless populational rise (United Nations, 2022). In fact, with a steady increase in the worldwide consumption of aquatic foods (FAO, 2022), aquaculture assures its place as a crucial component in the guarantee of the world’s food supply. Yet, an even larger adoption of aquaculture practices still faces several challenges. For instance, the environmental impact of aquaculture remains a topic of contention (Ahmad et al., 2021), and even juridical and legislative issues (Young et al., 2019). In reality, aquaculture is highly important in social, economic, and environmental terms (Naylor et al., 2021).
Although evolution in this field has not been universal, with several actors still lagging (Prapti et al., 2022), recent advancements in technological tools such as internet-of-things (IoT), machine learning (ML), or artificial intelligence have enabled the development of more intelligent and refined solutions for aquaculture (Rowan, 2023). IoT, in particular, is frequently identified as one of the main disruptive factors for the digitization of aquaculture, for its ability to monitor several fundamental parameters, providing invaluable insights into final product quality, pathogen, and disease monitoring and detection, and traceability and transportation systems (Bernal-Higuita et al., 2023).
Water quality monitoring, for instance, is one of the main areas of application of IoT in aquaculture. Indeed, several recent examples of work done in this scope can be found, with mathematical techniques such as ML commonly used for the later processing of the large streams of data created by IoT devices (Olmedo and Smith, 2021; Prapti et al., 2022; Singh et al., 2022). The combination of these technologies enables the extraction of relevant, obfuscated information from data that can provide valuable insights into, for example, mortality detection (Costa et al., 2024b; Ranjan et al., 2023). Nonetheless, the application of IoT devices in aquaculture also faces a unique set of challenges. As aquaculture farms are typically located within remote or rural regions, they are thus more susceptible to infrastructure-related challenges, such as unreliable access to both electrical power and steady internet connections (Rastegari et al., 2023).
Networking issues and a compromised internet connection make it so that cloud-based platforms for IoT devices are not a plausible solution to all aquaculture settings. To mitigate these difficulties, the shift toward a computational architecture that places a higher emphasis on edge computing can greatly reduce the dependency on cloud services, enabling the in-situ computation of relevant metrics directly on the sensing devices (Cao et al., 2020).
Although there are obvious advantages to the application of an edge computing paradigm in aquaculture farms with sparse network coverage, the number of solutions that follow this approach remains limited. The intelligent fish farm concept discussed in Wang et al. (2021) integrates edge computing for data and process control. In Tendolkar et al. (2021), an IoT network integrated with a computer vision system can monitor and make autonomous decisions based on sensed parameters in an estuarine aquaculture context. This system maintained appropriate conditions for fish without any human intervention. Within an aquaponics setting, image processing algorithms are deployed on-edge in Wan et al. (2022) to maintain fish and plants under optimal conditions.
Digital twin (DT) representations of systems gained substantial attention, particularly in the context of industrial smart manufacturing, as fundamental tools in achieving the full integration of physical and digital spaces (Tao and Zhang, 2017), for enabling the monitoring, simulation, processing, and optimization of physical systems and processes (Føre et al., 2024; Lu et al., 2020). Moreover, a shift toward edge-computing paradigms proves to be advantageous in building DTs of agricultural processes in a smart farm context (Verdouw et al., 2021). For instance, in Lan et al. (2023), a DT infrastructure is proposed for the remote monitoring of fish farming operations. Regardless, typical DT applications do not account for the scarcity of connections seen in rural aquaculture facilities. The majority of the proposed architectures by design require that there is a high level of synchronization between the sensors collecting the physical data and a main structure for digital twinning that then processes the data locally or in the cloud (Le et al., 2024). Currently, although aquaculture has started to leverage Industry 4.0’s enabling technologies (including DTs), its realization still lags behind other existing industries (Le et al., 2024; Xu et al., 2024).
In opposition to traditional aquaculture systems, recirculating aquaculture systems (RASs) have proven to be the most profitable ones. By using different types of filtration and environmental control agents, RAS can minimize the injection of fresh water in the tanks while maintaining a considerable production of fish. With the reduction in water consumption, the environmental impact is also minimized, reducing habitat destruction, water pollution, and eutrophication. At the same time, production in a controlled environment diminishes the effects of external climatic conditions and assures year-round production while mitigating the risk of disease transmission and parasite outbreaks, adapting to climate change (Ahmed and Turchini, 2021; Lal et al., 2024). Notwithstanding, large fish production raises other concerns, such as the individual’s health and quality of life, the amount of resources needed to maintain it, and the economics of the entire production process. Such aspects are motivation drivers for the application of IoT devices and DTs to support parameter monitoring, fish-feeding management, and process decision-making, to ultimately achieve cost minimization or benefit improvements. As such, implementations as in Teixeira et al. (2022) have been made to introduce DT systems in farms with a focus on anomaly detection that, by using long-range communication methods, allow for synchronous twinning. However, such communication systems present a limited range and are dependent on the physical configurations of each facility.
In this sense, this paper introduces an expansion of the notion of edge computing and distributed (micro) DTs in an aquaculture system, taking into consideration the above-mentioned constraints frequently felt in these settings. To achieve this, the taken approach is two-fold: (i) a discussion of a network-resilient architecture capable of dealing with various operation scenarios while possessing localized monitoring and computation of relevant key performance indicators and alarm-triggering capabilities; and (ii) provide a solution to the multimodal data integration challenge, via the application of edge device-compliant algorithmic techniques that are capable of integrating multi-sensor data (e.g. bacterial biosensors, environmental signals, etc.) and detect shifting parametric values (e.g. mortality). This proposed solution was tested using data provided by Sea Eight, a fish producer specializing in Solea senegalensis, which is raised in RAS under controlled low artificial light conditions. This particular fishery was selected due to the growing importance of S. senegalensis as a diversification option in European markets, which are already saturated with other major aquaculture species such as Sparus aurata and Dicentrarchus labrax (Morais et al., 2016; Silva et al., 2021). An overview of the production stages and lifecycle of S. senegalensis is briefly sketched in Figure 1. Transitions between stages depend on various factors, including time and individual fish weight. Among these stages, some play a particularly critical role, namely, weaning 2 and pre-fattening (PE) (Silva et al., 2021). The weaning 2 phase involves switching the diet from live feed to artificially sourced pellets, whilst the latter represents the stage before the fattening stages. All phases of the fish lifecycle are monitored daily.
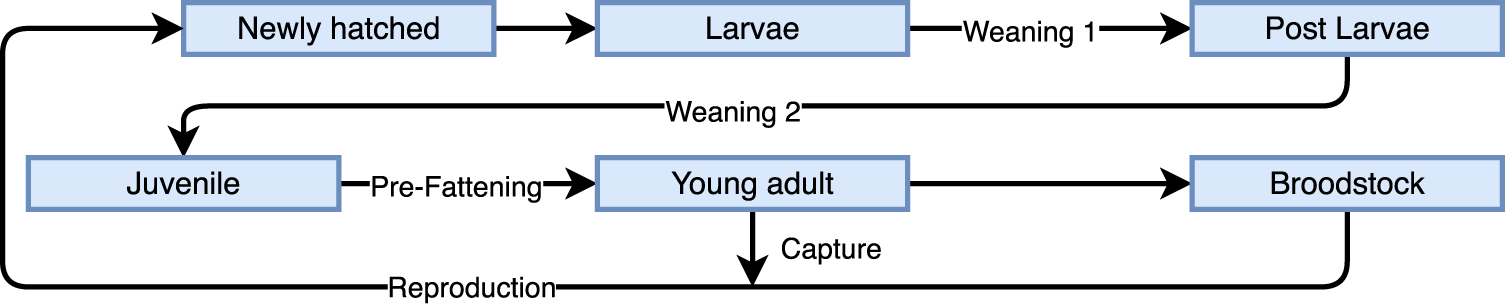
Simplified overview of the production stages and lifecycle of S. senegalensis with the inclusion of critical stages, WE2 and PE. The WE process represents the fish dietary change for artificial food sources, while PE is the period prior to the fattening stage, where fish are developed until an appropriate size and weight fit for consumption. WE2: weaning 2; PE: pre-fattening.
The next section frames the solution architecture against current approaches and presents its main components, the employed resiliency measures, and how it fits within the fish production stages. Section 3 details the developed lightweight algorithmic solutions and the mechanisms for fusing their outputs, through a three-algorithm approach: a monitoring algorithm based on production costs, a bacteria concentration estimator using images generated by an optical biosensor and ML, and a streaming data-drift algorithm for data fusion and process control. Section 4 discusses the results of the algorithmic approach when using real-world RAS datasets. The last section, Section 5, provides some concluding remarks and future research directions.
Although the benefits to aquaculture from the deployment of DT systems have been extensively discussed, their application is not as straightforward as in some other areas of industry (Føre et al., 2024; Le et al., 2024; Xu et al., 2024). A common challenge of systems twining is the high level of synchronicity required to achieve high-quality and reliable representations of the physical realm (Lu et al., 2020), which is further exacerbated in aquaculture facilities where network connections are notoriously deficient. In this sense, works such as was done by Teixeira et al. (2022), making use of LoRaWAN networks to address the connectivity issues of devising DT systems for RAS aquaculture settings, emerge. Although a step in the right direction, these sorts of architectures are still heavily dependent on centralized computing for analytics tasks. The inability to achieve full communication with all edge sensor nodes can lead to quality issues in the final DT. To help mitigate this issue, distributed DT architectures have been proposed, partly trading the capability of providing a real-time representation of a global DT model for the ability to reliably monitor, actuate, and describe systems locally. Such approaches can be found, for instance, in manufacturing scenarios (Villalonga et al., 2020) or even in some fields of agriculture (Moshrefzadeh et al., 2020). Applications of this paradigm in aquaculture (and more specifically, in RAS) settings are extremely scarce. In the extensive survey of Le et al. (2024) or in the work of Føre et al. (2024), there is no mention of distributed systems. In Kruk et al. (2024), a federated environment is proposed, taking on a higher-level view for merging information between different stakeholders, contributing to a more sustainable development. In a more comparable context, Xu et al. (2024) delves into the incorporation of Industry 4.0 technologies and practices taken from other fields of agriculture into aquaponic scenarios. This work emphasizes the need for research and adoption of cloud-fog-edge computing technologies in a practical setting.
Therefore, one of the contributions of this paper is the introduction of a distributed DT system, compatible with the particular limitations of the aquaculture setting. The conceptual architecture for the proposed distributed DT system is shown in Figure 2. Here, on a local level, portions of the aquaculture system are independently digitally represented via a local DT, here named a micro-DT (
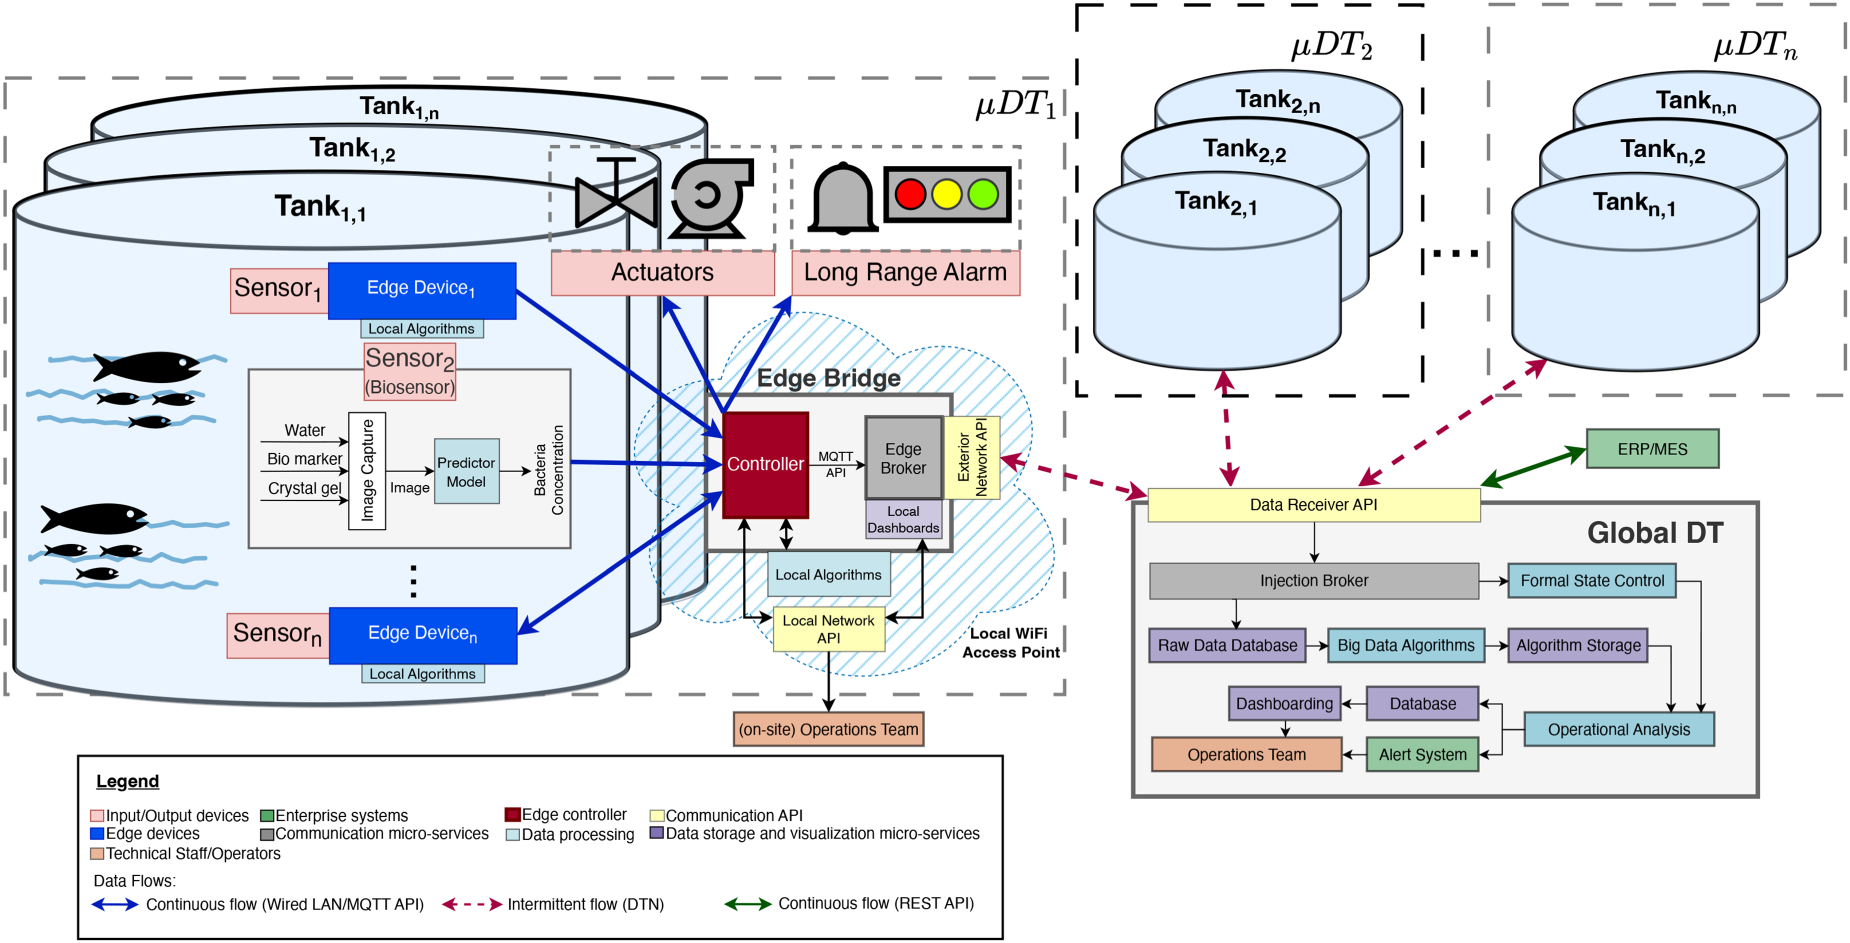
Conceptual schematic for the integration of a distributed DT architecture in an aquaculture application. The system enables localized processing via
The viability of such a system rests on its ability to fulfill two main needs: (i) decision-making processes must occur both on a global and a local level; (ii) unlike a conventional DT, the system must assure some level of resiliency against network-down moments. The introduced architecture tackles the former by largely delegating data pre-processing and preliminary data analysis tasks (e.g. data-drift detection and warning duties) directly to the network’s edge layer. The latter is addressed by entirely dismissing the need for a continuous data flow between
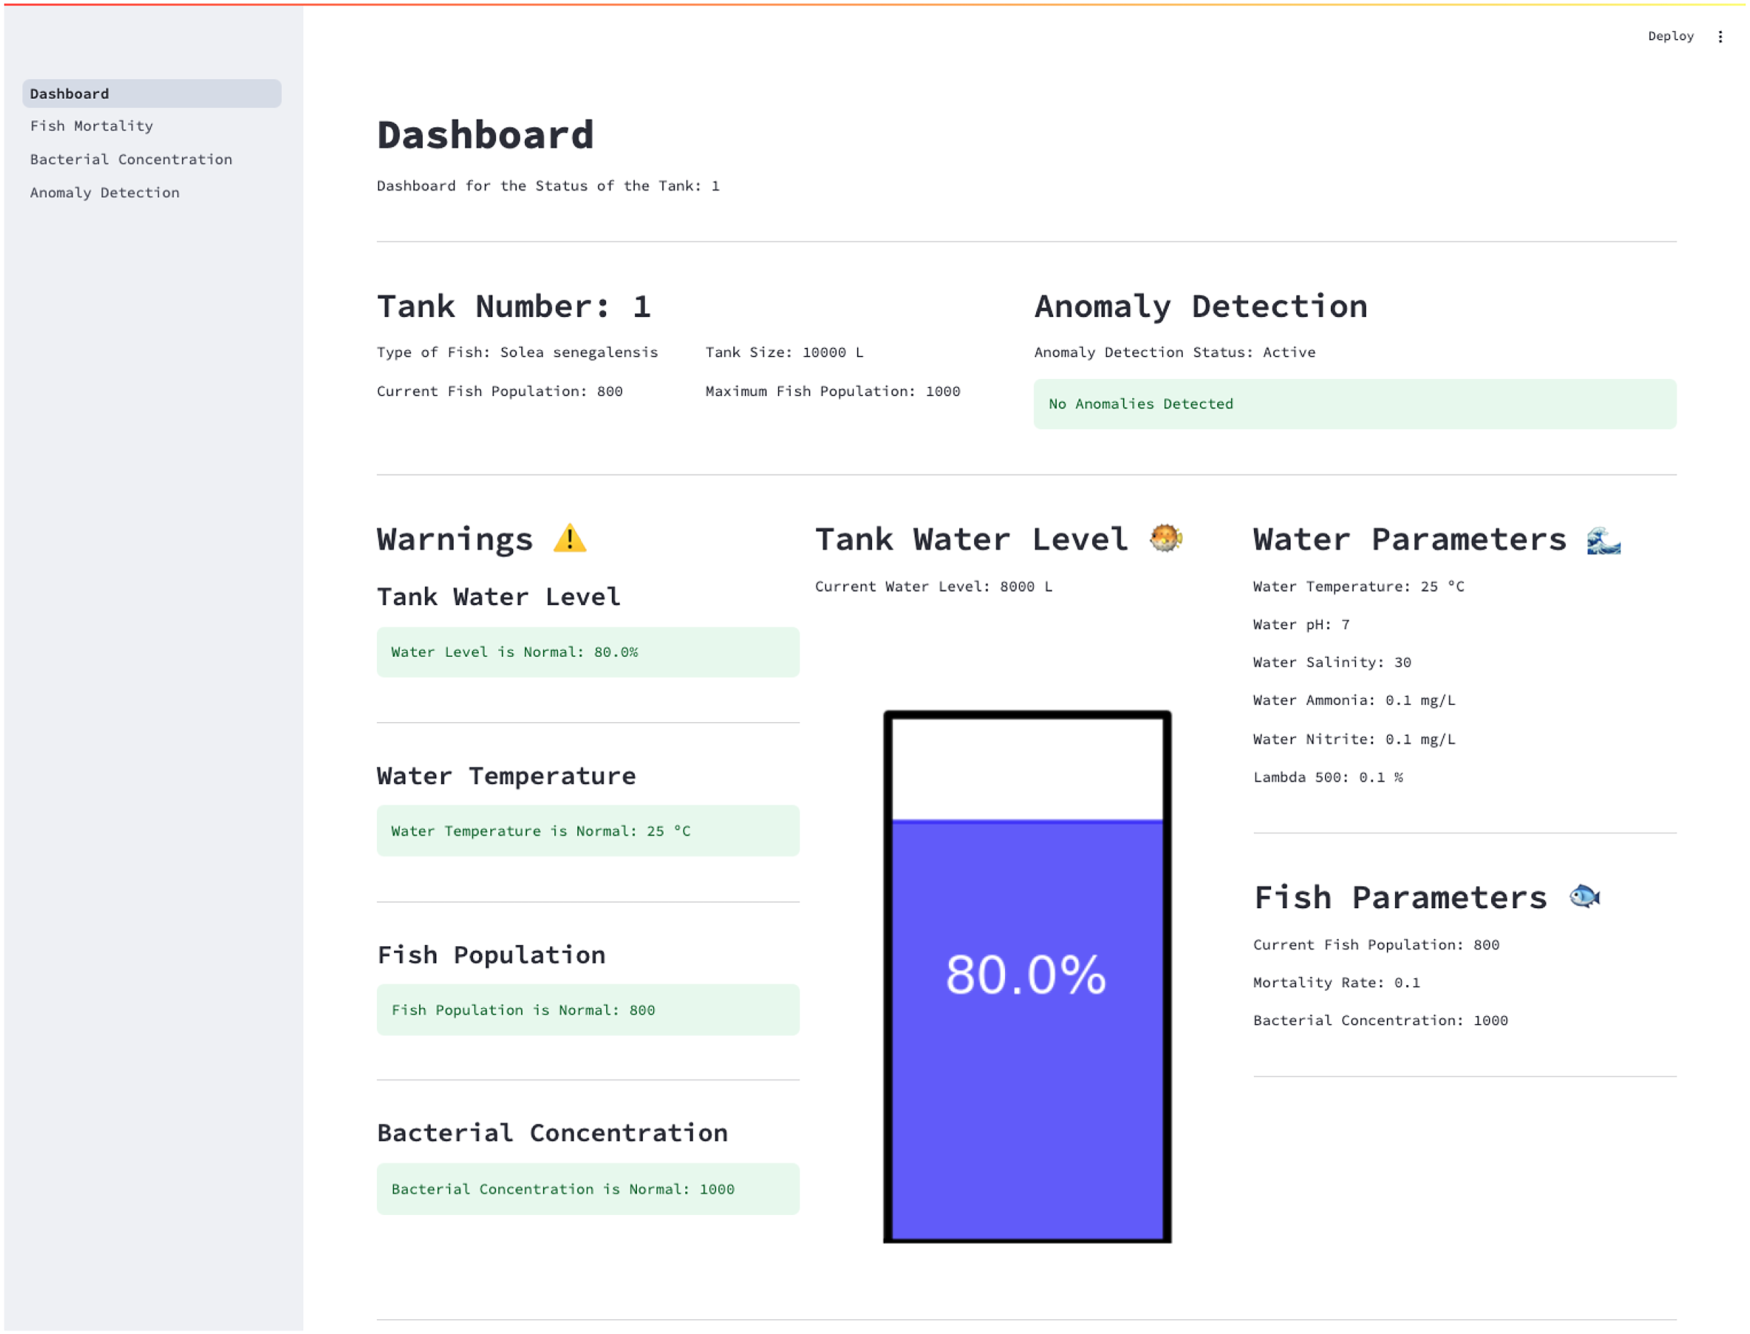
Example of a local dashboard hosted on the Edge Bridge for in-situ operator access. This interface remains accessible even during network outages and allows technical staff to monitor key parameters, view algorithm outputs, and respond to local alerts triggered by the micro digital twin (
Data synchronization is made possible through the implementation of a delay-tolerant network (DTN), where the instance of the Edge Broker running locally on the Edge Bridge ensures the resynchronization between
In the aquaculture context, each set of Edge Bridges and corresponding
To aid in creating DT systems, different focuses ranging from animal monitoring to physical conditions have been proposed (Føre et al., 2024; Le et al., 2024). At the group level, biomass estimation has been conducted with vision systems with both cameras on the surface or submerged to assess swimming activity, size, and feeding activity, with sonar technology also being used to get the density distribution. These technologies also allow for information to be collected at the individual level to a certain degree. As such, other monitoring methods such as biosensors and telemetry produce individual histories of data; however, these require intrusive and disruptive procedures (Føre et al., 2024).
A prototype of the algorithmic component of the proposed distributed DT architecture was tested using a real-world dataset provided by Sea Eight. Three main directions are taken, all featuring lightweight and computationally efficient algorithms for deployment in edge computing. The schematic shown in Figure 4 represents the logical sequence between each algorithmic component. Succinctly, the taken approach is based on: (a) a module responsible for preliminary data analysis, with an emphasis on providing a dynamic cost computation for the acceptable daily mortality value; (b) a biosensor-based system, coupled with a predictive model for the detection of bacterial presence in water; and (c), a drift detection algorithm for monitoring relevant parameters in aquaculture, which further serves as a lightweight multimodal data integration tool. Although the entirety of the showcased pipeline only features lightweight and computationally efficient algorithms, appropriate for deployment in edge computing, for simplicity, consider that a reference output from (a) is provided in an offline manner to the edge device, to serve as a reference value for appropriate system behavior. Fundamentally, the drift detection algorithm facilitates the computation of (c) by providing a manner in which it becomes possible to aggregate data outputs from both (a) and (b). The following subsections will explain each algorithmic component in greater detail.
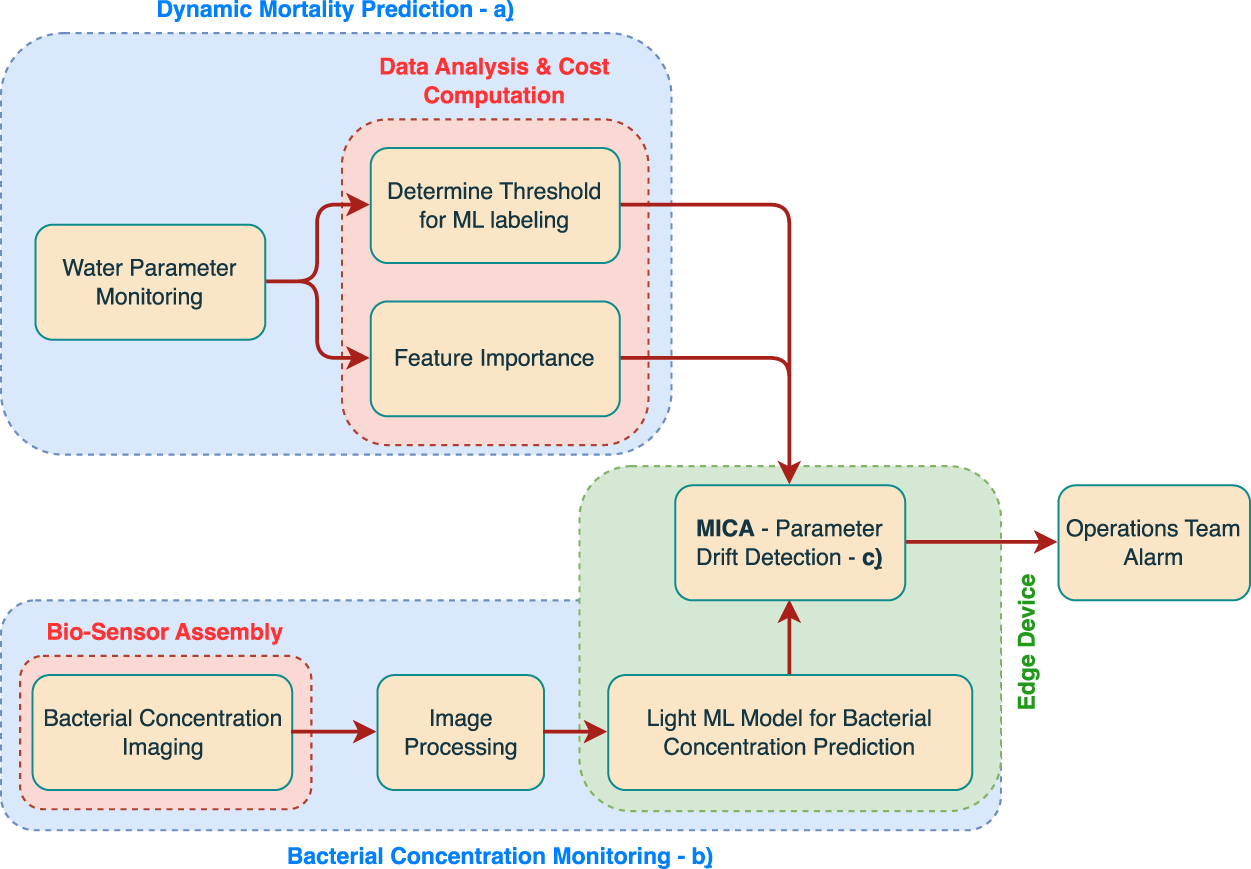
Logical sequence between each one of the three major algorithmic components in the prototype implementation: (a) dynamic mortality prediction using cost-sensitive thresholds; (b) image-based bacterial concentration estimation using a biosensor; and (c) drift detection algorithm responsible for integrating multimodal signals and triggering alarms under abnormal conditions. Although each component is constructed in such a way to make it viable for edge deployment, in this setting, it is being considered that at least one component (a) was computed offline to provide a reference value to the parameter drift detection procedure.
Of the several production costs associated with aquaculture, the largest expenses are usually found in the feeding stages and energy expenditure. The latter of these is particularly concerning in RAS and makes mortality an important aspect to have in consideration, as it is a direct loss of revenue. Despite multiple factors that can influence the daily death value, such as the presence of bacteria, feeding interactions, or pathogen presence, the physical–chemical parameters are also indispensable to monitor as they directly influence the welfare of the species (Zhang et al., 2020).
Through the use of ML models, it is possible to try and predict daily mortality values. By considering that there is a maximum acceptable number of deaths, a cut point can be set and days classified in a binary fashion, if above or below such a threshold value. Naturally, the selection of this threshold is of high importance, but not immediately apparent. For instance, deciding on a too low of mortality threshold would be practically unfeasible, as a minimal number of fish deaths is always expected, and avoiding these would be more costly than the economic expense derived from fish loss. Alternatively, selecting a too high mortality threshold would have the opposite effect, where the number of lost fish would quickly impact any financial gains. In this sense, tree-based models are selected for the classification task, as they typically provide good explainability capabilities and performance. Moreover, they are also capable of providing direct insight into feature importance. For instance, random forest classifiers provide an intrinsic method of performing this based on the mean decrease in impurity (MDI). Additionally, from feature permutation importance, it is also possible to evaluate the individual variable impact on the performance of the classifier model (Costa et al., 2024b).
The robustness of ML methods is seldom studied; however, small variations in input data may lead to very contrasting results. In this application, as the data is susceptible to several measurement errors, it is essential to take them into account when designing a predictive model. The seminal gradient boosting method, XGBoost (Chen and Guestrin, 2016), instead of directly minimizing a cost function to produce a node split, it instead considers the possible effect of random noise on input values. The robustness of this method can be evaluated through the technique introduced in Kantchelian et al. (2016).
Common metrics for ML algorithms (e.g. F1-score, recall, and accuracy) provide a direct interpretation and evaluation of the performance of the models. However, these are not directly understandable and interpretable, specifically in industrial contexts where not everyone is an ML expert. Even for experts, the choice of an appropriate metric is prone to bias and user preference (Akshay et al., 2022). This matter has also been brought to the general public to validate the understanding of the metrics utilized and their fairness (Saha et al., 2020). It is, therefore, relevant to create alternative descriptors of performance with higher real-world interpretability.
As such, an alternative metric is proposed and computed by assessing the number of correctly performed predictions for each distinct cut point, thus enabling the direct quantification of gains/losses due to high mortality. This method takes inspiration from the classical methods of confusion matrix-based cost-sensitive learning (Elkan, 2001), where a true positive (TP) is considered when both the predicted and the actual value are above the cut point, and a true negative (TN) when both are lower. When the model predicts higher or lower than the true value, there is a false positive (FP) or a false negative (FN), respectively. In this setting, the target function was formulated in terms of potential benefit (or Gain) for a given cut point as

Although this procedure enables the creation of higher-quality predictive solutions, it does not, however, provide any additional information regarding factors that led to a spike in mortality. After abnormal situations of extremely high mortality, further research was conducted by an outsourced expert, who concluded that the causes likely resided in the existence of pathogens. Hence, the detection of pathogenic bacteria in fish’s blood or, more precisely, the detection of bacteria in the water tanks was considered of high importance. Rapid detection methods such as flow cytometry and polymerase chain reaction are known in the literature to identify and measure pathogenic bacteria in fish (Cortez et al., 2008). However, the majority of the solutions are measurements of fish blood. Consequently, the need for real-time water biosensors is a clear research aim.
Escherichia coli (E. coli) is a bacterial species naturally present in the intestinal tracts of both humans and animals. While some strains are harmless, others can be pathogenic, particularly when contaminating food or water sources. In aquatic environments, its presence can lead to disease outbreaks among farmed animals, increasing illness and mortality rates. This, in turn, results in production losses and higher operational costs (Onmaz et al., 2020).
Several techniques are available for detecting E. coli in water, including culture-based and molecular approaches. The traditional culture method requires collecting a sample and allowing the bacteria to grow in a laboratory, making it a lengthy process. On the other hand, molecular methods offer quick and accurate detection but come with higher costs and require specialized personnel. While microelectromechanical systems provide high precision, sensitivity, and specificity, they tend to be expensive and complex. Alternatively, liquid crystal sensors leverage their optical and electrical properties to detect environmental changes by measuring variations in the refractive index and birefringence, allowing for the identification and quantification of contaminants in low time, as little as 30 s (Soares et al., 2024).
With the visual representation provided by the liquid crystal biosensor placed near the production tank, it becomes possible to estimate the bacterial concentration in the analyzed sample and, by extension, in the entire tank. This process involves two main stages: (i) the assembly of the biosensor and (ii) the processing of the resulting images for bacterial estimation. The device and its operation can be seamlessly integrated into the DT architecture, as illustrated in Figure 2.
Biosensor assembly
First, the biosensor is assembled following the protocol of Soares et al. (2024). The surface of glass slides is functionalized by first yielding free amine groups to covalently immobilize, in a second step, the biorecognition molecules, that is, anti-E. coli antibodies.
After the functionalization, the glass slides are immersed in a bacterial growth medium with and without E. coli. Afterward, the glass slides are rinsed with deionized water to wash away the growth medium and remove the unbound E. coli. Then, after drying the glass slides, using epoxy glue, the glass slides are overlapped and glued in pairs on the tips to create several sensor cells. Finally, by capillary rise, the liquid crystal is inserted between the two glass slides, filling the entire cell. The schematic representation of the sensor is present in Figure 5. On the left, a negative result, where no bacteria are detected, and the liquid crystal molecules’ orientation is not disrupted (dark image due to the incident light extinction). On the right, a positive result since bacteria are detected, being fixed to the antibody, and efficiently distorts the liquid crystal molecules’ orientation, allowing the incident light to pass through the cross polarizers (bright image). In this way, it is then possible to visually see different levels of colony-forming units (CFUs) of E. coli present in the sample.
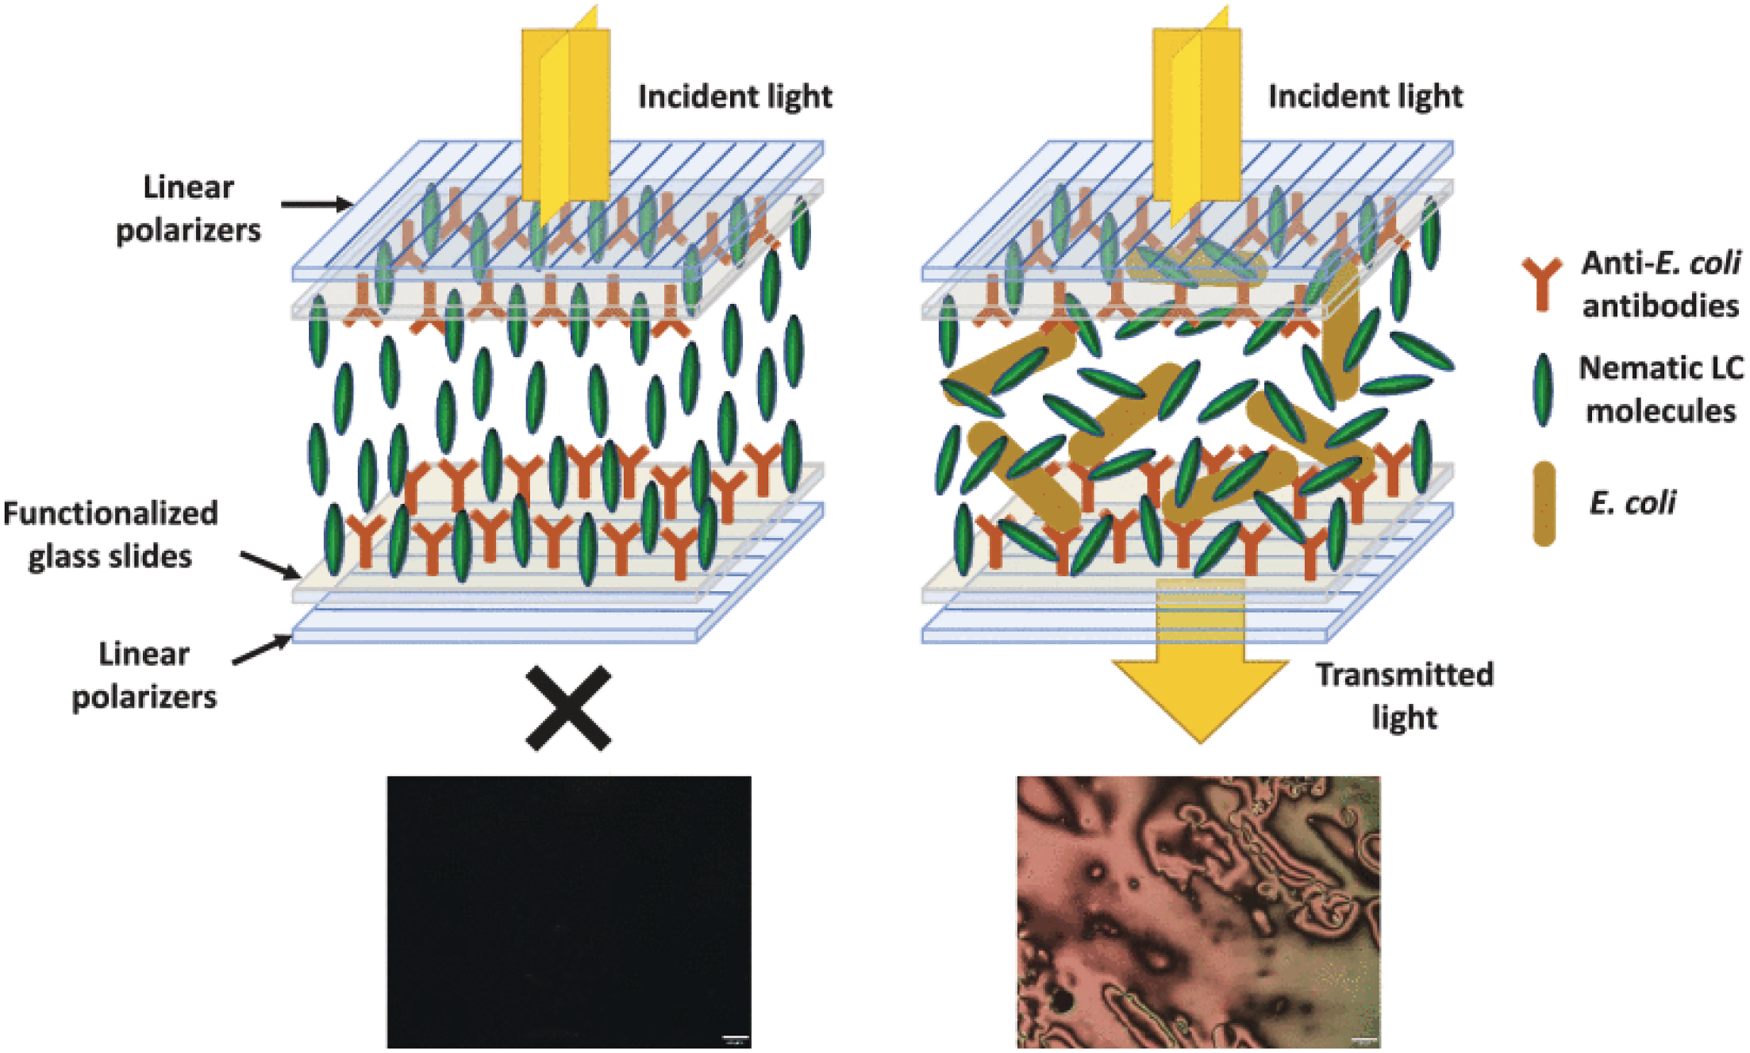
Schematic representation of the sensor assembly and detection mechanism. On the left, a negative result. On the right, a positive result since bacteria are detected. Adapted from Soares et al. (2024).
After the picture collection, the digital frame is first pre-processed with a set of feature extraction procedures. Due to the logarithmic scale at which the concentration values are retrieved, this can be considered a classification task that is done in five classes concerning the exponent value of the concentration. Thanks to the need for computationally and memory-low resource-intensive algorithms, the images are first processed with band-cutting filters applied to their histograms, followed by aggregation functions that are used to generate the ML features. This then allows for the application of edge-focused algorithms to obtain a fast estimation of the values of the CFUs/mL of bacteria as opposed to traditional procedures that present longer response times and need to be conducted elsewhere. This computational procedure can be summarized as shown in Figure 6.
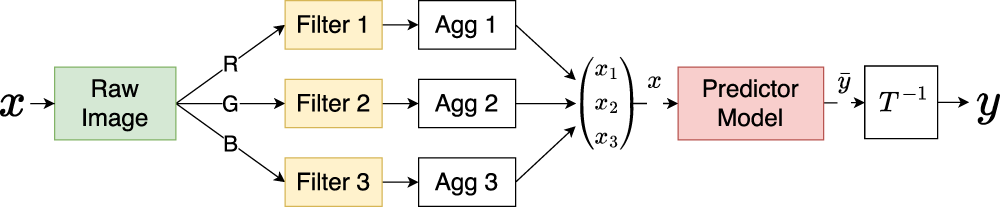
Diagram of the pre-processing stages for the E. coli bacterial concentration predictor algorithm. Here, the images captured through the optical biosensor are first decomposed into the corresponding color channels and filtered on a channel-by-channel basis.
To integrate the multimodal results from the dynamic monitoring of mortality and bacterial concentration, the application of an algorithm capable of measuring the variation in data distribution of the most relevant parameters is proposed. Through this approach, it becomes possible to examine and identify whenever relevant variables are outside a safe range, thus enabling the timely triggering of warning and correcting mechanisms to take place. This process is further useful in scenarios with conflicting sensor data (such as overlapping fish stages), where abnormal changes in data distributions can be detected without relying on strict consistency across signals. For this, multiscale impurity complexity analysis (MICA) is chosen, which is a model-independent supervised algorithm capable of providing a measure of separability for classification problems (Costa et al., 2024a). MICA is based on the analysis of regional impurity for data point elements bounded within the region described by
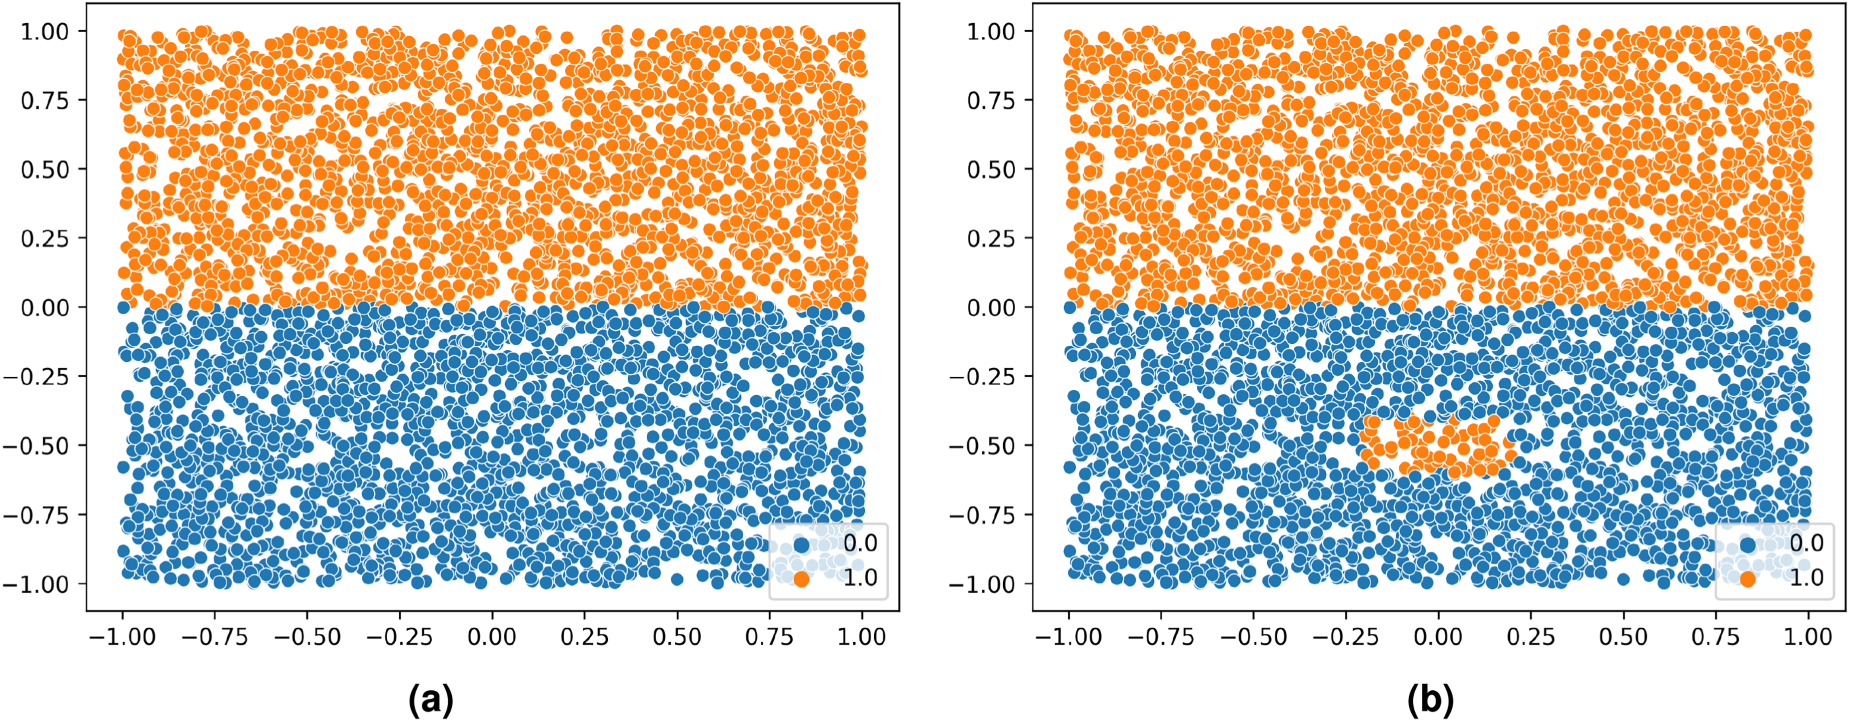
Datasets illustrating the influence of local conditions on the multiscale impurity complexity analysis (MICA) complexity measure. A higher value of MICA is representative of a higher dataset complexity (or a higher difficulty in establishing a classifier’s decision boundary). Adapted from Costa et al. (2024a). (a)
Fundamentally, it works by creating
To validate the edge-based algorithmic approach toward aquaculture, a real-world dataset provided by Sea Eight was used. The purveyed data is representative of the production of S. senegalensis, a species of eastern Atlantic and Mediterranean flatfish, in an indoor RAS with a controlled and stable water environment. The weaning room operates under a low-light setting, while the PE area utilizes artificial blue lighting. The collected data represents a two-year period, for both the weaning and PE phases, corresponding to a total of 741 days for each phase. In this setting, the operation is made under the assumption that each
To assess the feasibility of estimating concentration values from biosensor images, 42 images were collected and analyzed. An external source determined the CFU values, and the results were categorized into five classes representing different possible scenarios.
Mortality monitoring
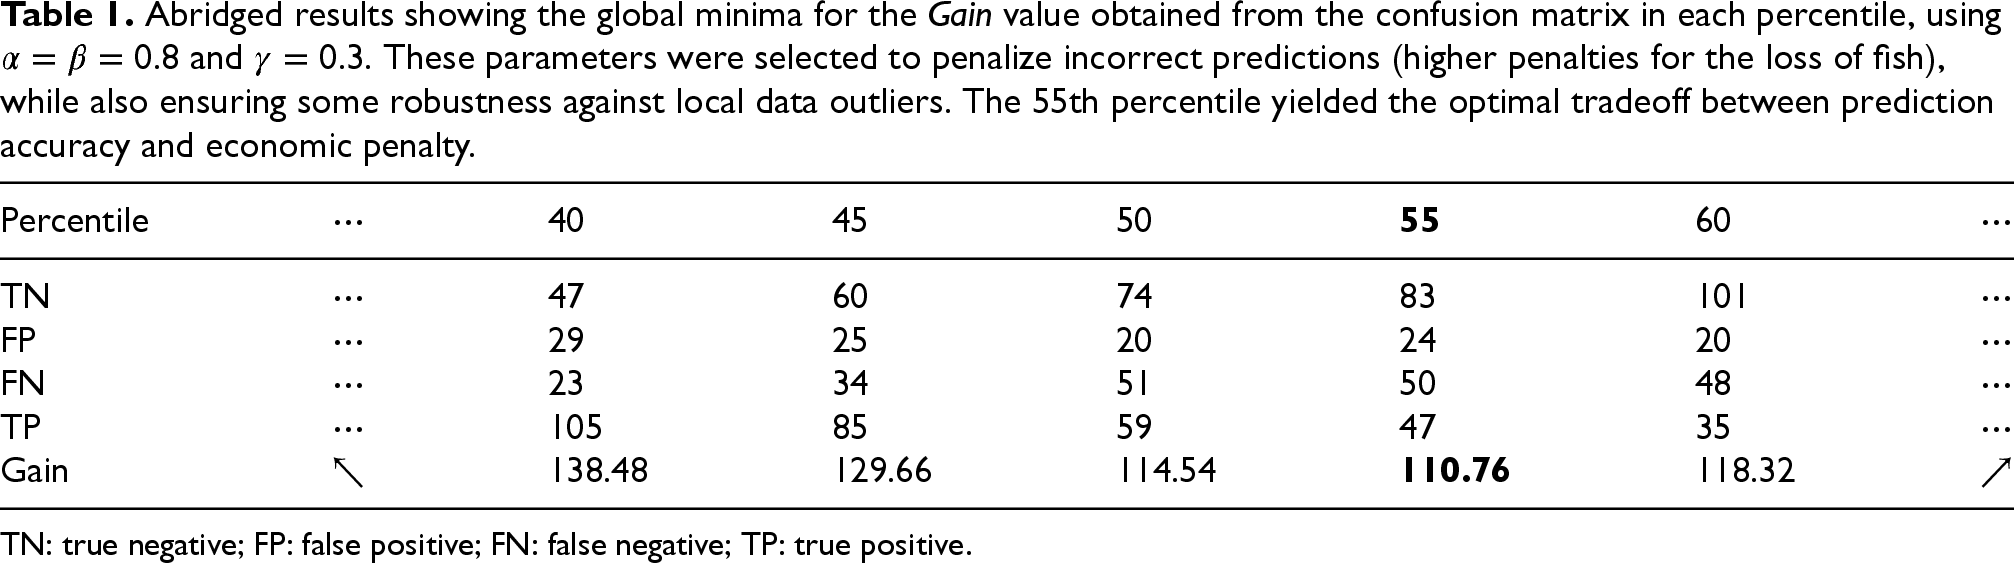
To determine the optimal mortality threshold for the subsequent parameter monitoring algorithms, a cost-sensitive Gain function (1) was applied across mortality percentiles ranging from the 40th to the 60th. Table 1 presents the abridged results, highlighting the confusion matrix values and corresponding Gain scores at each percentile. The 55th percentile was found to yield the minimum Gain value, signifying the most balanced tradeoff between prediction accuracy and economic penalty. This threshold minimizes the financial impact of FPs and FNs, while also accounting for the potential benefits of early interventions. The selected value was validated through expert-defined parameters (
Abridged results showing the global minima for the
value obtained from the confusion matrix in each percentile, using
and
. These parameters were selected to penalize incorrect predictions (higher penalties for the loss of fish), while also ensuring some robustness against local data outliers. The 55th percentile yielded the optimal tradeoff between prediction accuracy and economic penalty.
Abridged results showing the global minima for the
TN: true negative; FP: false positive; FN: false negative; TP: true positive.
When performing feature importance with both the previously mentioned techniques, pH levels, and the different measured nitrates, NO
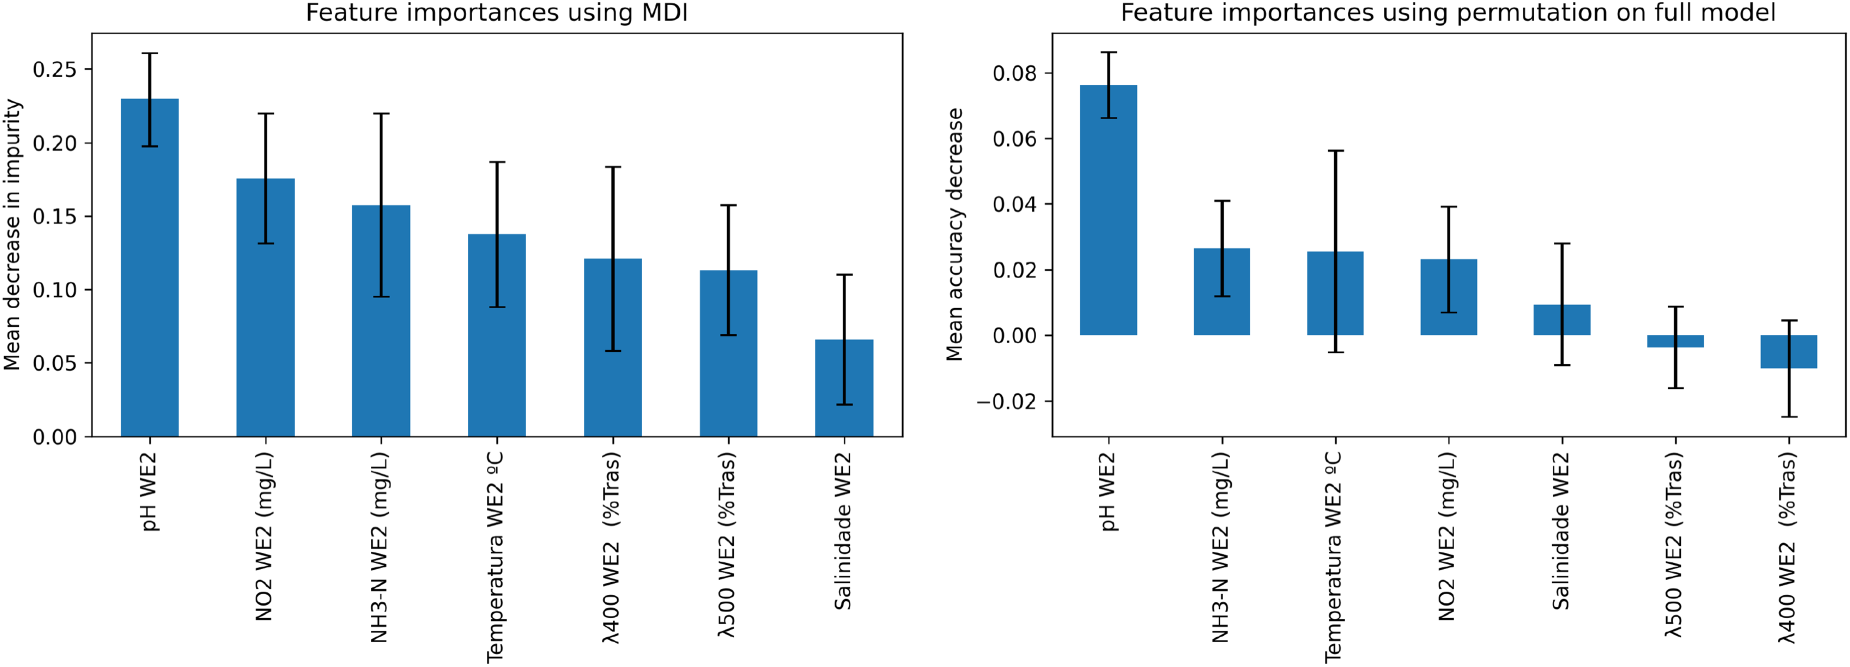
Feature importance results for the best-cut point from the cost function, on the left through mean decrease in impurity (MDI), and on the right through feature permutation.
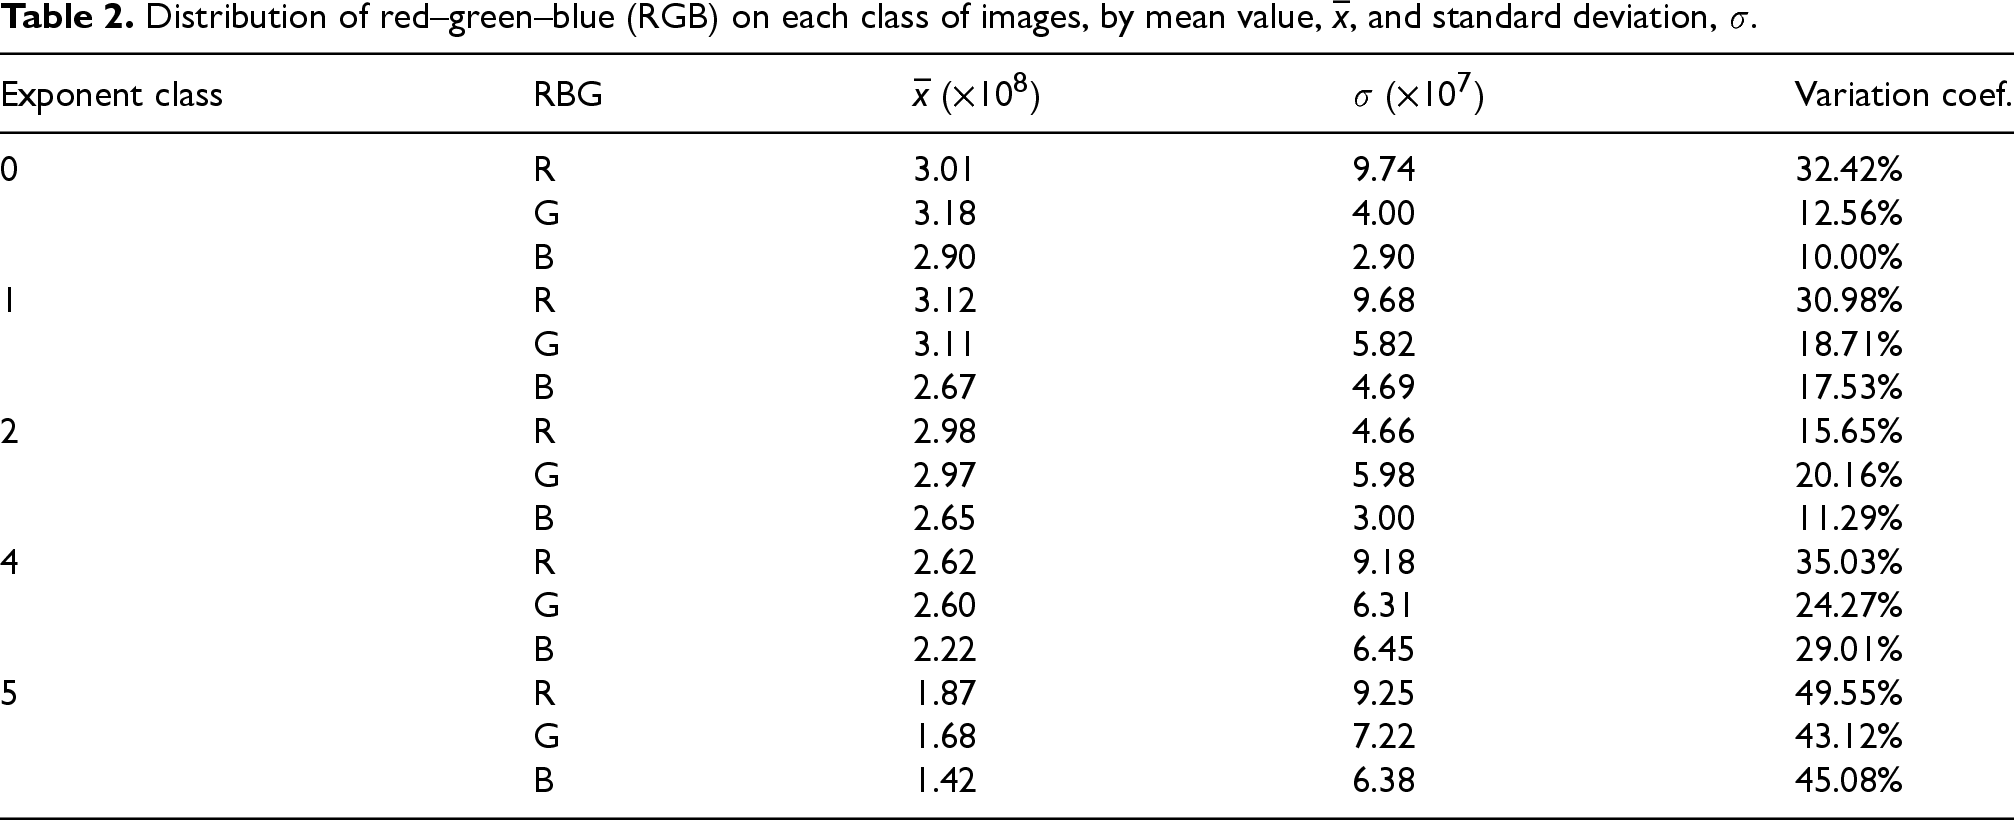
From the biosensor, 42 distinct image/concentration-value pairs were retrieved and considered. Figure 9 displays sample biosensor images corresponding to different levels of E. coli bacterial concentration, expressed in CFUs/mL. Here, the difference between the different levels of concentration is clear. With lower concentration values, Figures 9(c) and 9(d) present darker colors. Yet, for higher concentration values, despite presenting the same class concentration, Figures 9(a) and 9(b) are brighter but still very distinct from each other. The distribution of the color values is worth noting, as it is present in Table 2 for the different classes considered. These visual patterns are processed by the edge-deployed algorithm to classify concentrations into five discrete levels. The visual differences between the classes support the feasibility of using lightweight image features for accurate on-site bacterial detection.
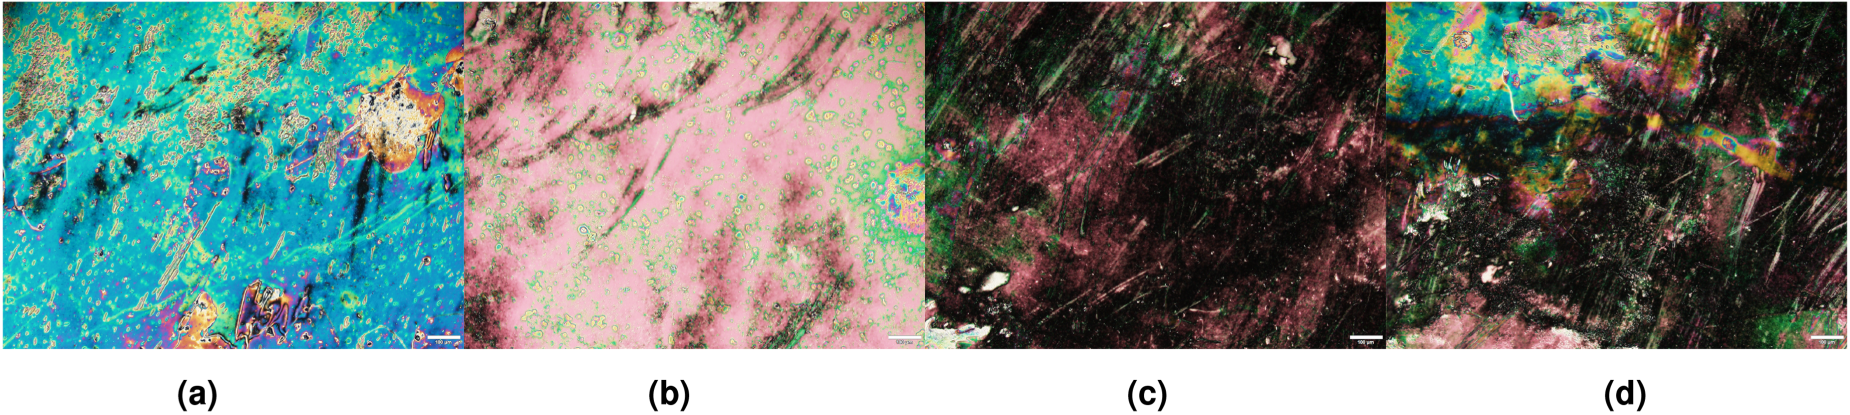
Exemplification of the images captured by the optical biosensor. The concentration of E. coli bacteria is shown in colony-forming units/mL ( CFUs/mL). (a)
Distribution of red–green–blue (RGB) on each class of images, by mean value,
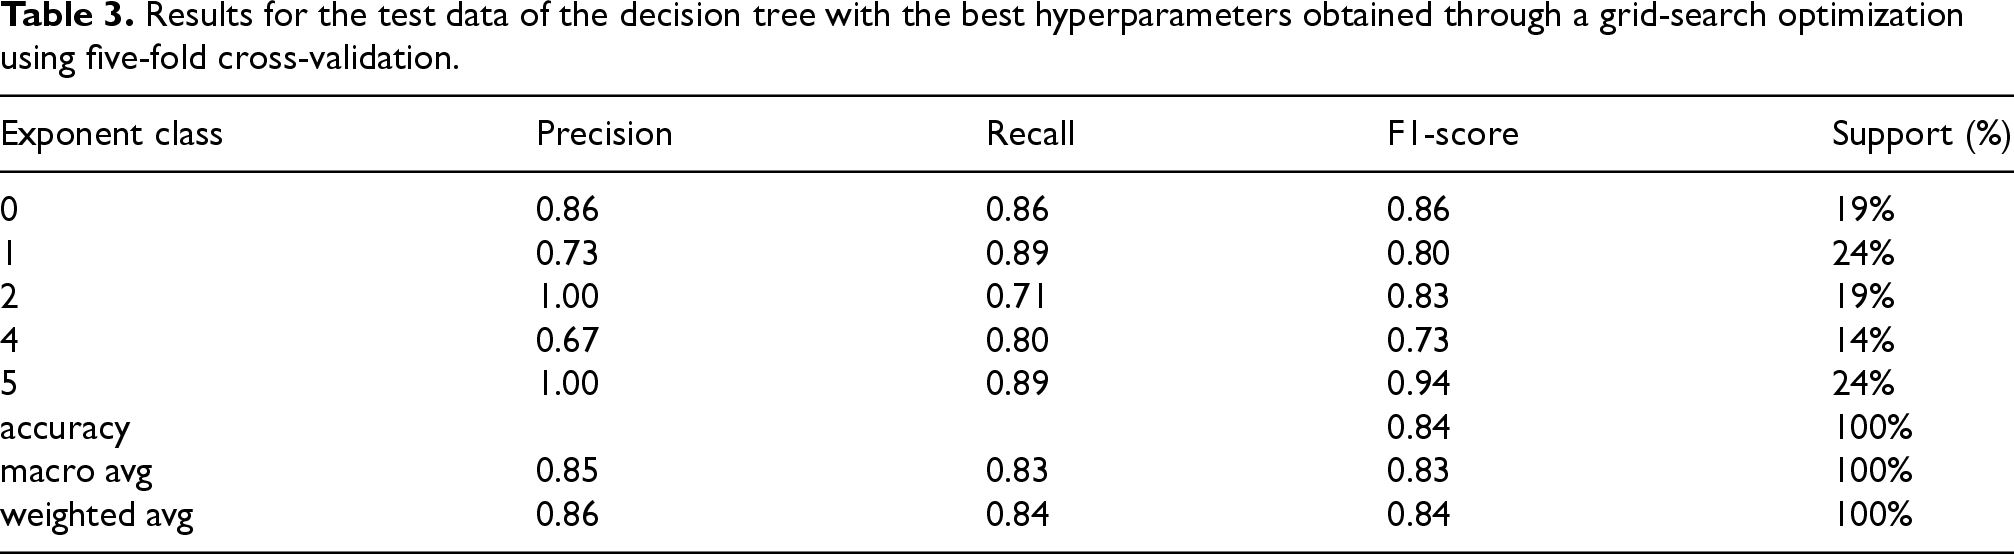
With a focus on edge-centric algorithms, the decision tree was selected for testing. The dataset was split in a stratified manner with 85% for training and 15% for testing. On the training data, an extensive hyperparameter grid search was conducted with five k-fold cross-validation. With the best hyperparameters obtained, the model was trained on the whole training dataset. The performance metrics of the best model on the test data are presented in Table 3. An evaluation of the model on the training data was also conducted, which led to F1-scores and accuracy values between 0.90 and 1.00, for the five k-folds. Through this method, it is possible to reliably and quickly obtain an estimation for the CFU value, indicative of bacterial concentration. Referring back to Figure 4, these estimations together with the findings obtained through the mortality analysis are combined as multimodal data inputs for a complete monitoring of mortality factors, through the concept drift detection algorithm.
Results for the test data of the decision tree with the best hyperparameters obtained through a grid-search optimization using five-fold cross-validation.
Building upon what was discussed in Sections 3.1 and 3.2, MICA was applied in the three-dimensional analysis of pH levels and NH
The results are shown in Figure 10. This graph shows the computed value for IS, where the region in light blue corresponds to the reference set, used for training the algorithm, and the region in light green is the hold-out validation set. To facilitate interpretation, and seeing that real-world data drift is difficult to evaluate, as what constitutes a drift may not be immediately clear, the 7-day mortality rolling average is also displayed. Furthermore, the selected mortality threshold is also plotted.
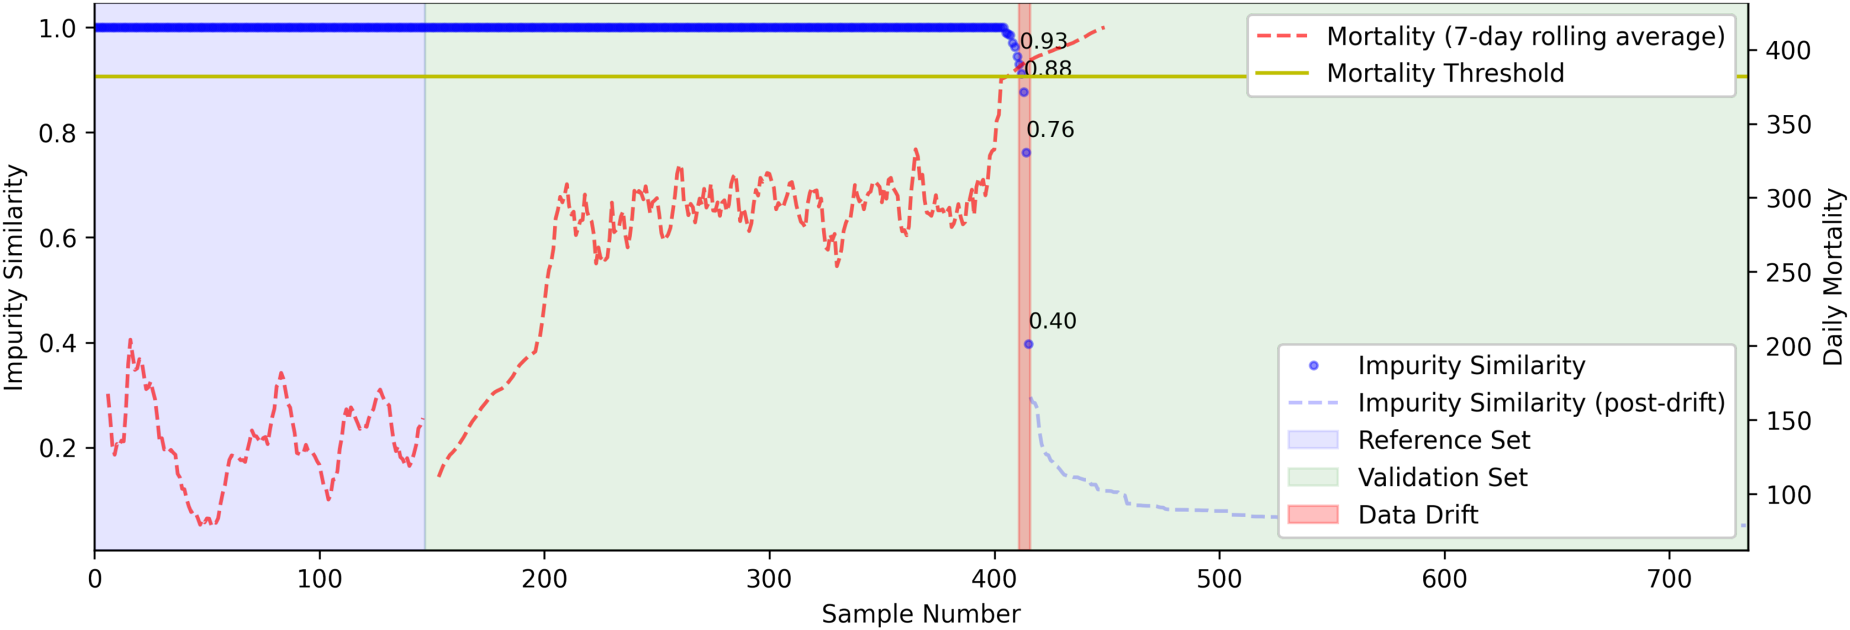
Results for the MICA algorithm on the identification of data drift in the aquaculture dataset. Depicted (in blue) is the IS value computed by MICA, quantifying the similarity between the reference (train) set and the streamed input (hold-out/test) set. To aid interpretation, the 7-day rolling average for mortality is plotted (in dashed red). In this analysis, MICA was capable of detecting a drift in input parameters prior to the large spike in rolling average mortality (right before the 400th sample), with a rapidly decreasing IS value. Further note that the spike around the 200th sample was not significant enough to decrease IS, and MICA only detected drift near the point where the mortality threshold was previously computed. MICA: multiscale impurity complexity analysis; IS: impurity similarity.
It is possible to see that a sharp decline in the IS index precedes a substantial rise in the 7-day rolling mortality average (dashed red), demonstrating MICA’s ability to accurately detect changes in the distributions of input features, providing early warnings of anomalous system behavior. Crucially, smaller mortality fluctuations earlier in the validation period do not trigger false alarms, showcasing the algorithm’s robustness to benign variability. Only when the input parameters deviate significantly, coinciding with a sharp and sustained increase in mortality, does MICA detect drift (highlighted region in red). This selective sensitivity is particularly valuable in operational aquaculture settings, where FPs could lead to unnecessary interventions, and missed anomalies could be costly. Furthermore, note that performance could be improved by iterative tuning of the value of the error threshold IS.
Aquaculture has become an essential component of global food security, providing a sustainable solution to meet the increasing demand for seafood. As wild fish stocks decline due to overfishing and environmental challenges, aquaculture offers a viable alternative to ensure a stable and efficient supply of aquatic products. The rise of IoT devices has further revolutionized the industry, enhancing productivity, sustainability, and resource management. Smart sensors, automated feeding systems, and real-time water quality monitoring have enabled farmers to optimize conditions, reduce waste, and improve yields. As technology continues to advance, the integration of IoT in aquaculture will play a crucial role in addressing global food challenges, making the industry more efficient, sustainable, and resilient in the face of climate change and population growth. The integration of these enabling technologies is still limited in the aquaculture setting due to a multitude of challenges, such as limited networking capabilities. In this sense, the proposed distributed DT architecture aims to bridge some of these difficulties, enabling a wider application of IoT technologies.
This work introduces and tests a multicomponent algorithmic strategy for fusing multimodal data in a way that is compatible with the edge computing paradigm on real-world data. A three-stage approach is taken: (i) a dynamic mortality monitoring algorithm, determining the most relevant features for mortality detection, and the lowest-cost acceptable mortality; (ii) a biosensor in combination with a lightweight computer-vision approach for fast estimation of bacteria such as E. coli, enabling the detection of abnormal or dangerous concentration levels; and, (iii) a concept drift algorithm, here adapted to the fusion of the inputs given by (i) and (ii) in edge devices, for in-situ monitoring of changes in data distribution, indicative of an impending increase of mortality. Combined with the local alarm-triggering capabilities of the introduced architecture, this approach can provide early warnings to operators, enabling them to take mortality-mitigating actions preventively.
The algorithmic strategy was tested using the real-world data from the indoor controlled production in RAS of S. senegalensis of Sea Eight, which allowed for the individual and merged testing of the algorithmic components. From the dynamic mortality prediction, conclusions are two-fold: (i) the most relevant variables for mortality detection are identified; and (ii) the optimum cut point is computed based on the proposed cost function. This cut point is selected such that the maximum allowed mortality value is the lowest possible, whilst being resilient to some outlier events. Furthermore, the estimation of E. coli bacterial concentration was also contemplated through the use of an optical biosensor and ML image processing techniques. This method showed suitable performance; however, a larger number of collections is still necessary to further validate real-world performance. Lastly, all the outputs derived from these algorithmic systems are merged through the MICA algorithm, which was then able to timely detect the emergence of concept drift in the input data, indicating an abnormal increase in mortality.
For future work, it would be of particular interest for this monitoring of parameters to occur based on each particular phase of the fish lifecycle. In this way, it would be possible to understand issues along stages such as growth outliers, pathogen contamination, or factors for fish stress peaks. Moreover, the introduced computational architecture is still open to real-world validation, besides just the algorithmic performance. In this validation, parameters such as communication latency, fault tolerance, synchronization abilities, and energy usage must also be monitored. Nonetheless, the integration of IoT technology in aquaculture not only shapes the future of seafood production, but also ensures smarter, more efficient, and more resilient food systems for generations to come.
Footnotes
Author contributions
Funding
The authors disclosed receipt of the following financial support for the research, authorship, and/or publication of this article: This work was developed within the scope of FCT projects: CICECO (Nos. LA/P/0006/2020, UIDB/50011/2020, and UIDP/50011/2020) and DigiAqua Project No. PTDC/EEI-EEE/0415/2021. The work was also supported by the Center for Research and Development in Mathematics and Applications (CIDMA) through the Portuguese Foundation for Science and Technology, Project No. UIDP/04106/2020. The first and second authors were partially supported by the Center for Research and Development in Mathematics and Applications (CIDMA) through the Portuguese Foundation for Science and Technology (FCT—Fundação para a Ciência e a Tecnologia), reference nos. UIDB/04106/2020 and UIDP/04106/2020. An additional note of appreciation to SeaEight and associates, Safiestela and Aquacria Piscicolas, S.A., for generously sharing their data with the team.
Declaration of conflicting interests
The authors declared no potential conflicts of interest with respect to the research, authorship, and/or publication of this article.
Data availability
The data used in this work is the property of the aquaculture company; hence, it is not publicly available.