
Abstract
The fault diagnosis approaches based on k-nearest neighbor rule have been widely researched for industrial processes and achieve excellent performance. However, for quality-related fault diagnosis, the approaches using k-nearest neighbor rule have been still not sufficiently studied. To tackle this problem, in this article, we propose a novel quality-related fault diagnosis framework, which is made up of two parts: fault detection and fault isolation. In the fault detection stage, we innovatively propose a novel non-linear quality-related fault detection method called kernel partial least squares-k-nearest neighbor rule, which organically incorporates k-nearest neighbor rule with kernel partial least squares. Specifically, we first employ kernel partial least squares to establish a non-linear regression model between quality variables and process variables. After that, the statistics and thresholds corresponding to process space and predicted quality space are appropriately designed by adopting k-nearest neighbor rule. In the fault isolation stage, in order to match our proposed non-linear quality-related fault detection method kernel partial least squares-k-nearest neighbor seamlessly, we propose a modified variable contributions by k-nearest neighbor (VCkNN) fault isolation method called modified variable contributions by k-nearest neighbor (MVCkNN), which elaborately introduces the idea of the accumulative relative contribution rate into VC k-nearest neighbor, such that the smearing effect caused by the normal distribution hypothesis of VC k-nearest neighbor can be mitigated effectively. Finally, a widely used numerical example and the Tennessee Eastman process are employed to verify the effectiveness of our proposed approach.
Introduction
With the rapid development of industry, modern industrial systems are expanding toward the direction of large scale and complexity. To ensure safety and reliability in industrial production, multivariate statistical process monitoring (MSPM) as a kind of data-driven approach has been extensively studied and successfully applied to actual industrial processes.1–3 In MSPM, process-related fault detection is a popular research task, of which the mainstream method is principal component analysis (PCA). 4 Many researchers have improved PCA for better application in fault detection. For example, Xiu et al. 5 proposed a novel Laplacian regularized robust PCA method that can effectively capture the intrinsic non-linear geometric information. Other process-related fault detection methods have canonical correlation analysis (CCA), 6 non-negative matrix factorization (NMF),7,8 and so on. Another particularly important research direction for MSPM is quality-related fault diagnosis,9–11 in which quality-related fault detection and fault isolation are two key tasks. Quality-related fault detection belongs to a supervised learning task in machine learning area, 12 and it aims to detect whether a fault that affects product quality occurs in the industrial system. When a fault detection algorithm indicates some faults exist in the system, fault isolation attempts to locate the faulty sensors. By the diagnosis of quality-related faults, unnecessary downtime and cost brought by the quality-unrelated faults can be greatly reduced, and the risky faulty sensors can also be located as quickly as possible. Therefore, quality-related fault diagnosis has been a research hotspot recently.13–15
Compared with process samples in real industry, quality samples usually have a large time lag to collect and a relatively rare quantity. Hence, the direct use of quality samples cannot meet the requirement of real-time online monitoring. To tackle this situation, the commonly adopted idea is to first establish a regression model between process variables and quality variables, and then extract the quality-related features from process variables, which will replace quality variables to realize quality-related online fault detection. Currently, two mainstream frameworks based on this idea are least squares (LS)–based and partial least squares (PLS)–based approaches. Zhou et al. 16 comprehensively analyzed the defect of PLS 17 for quality-related fault detection and proposed a total projection to latent structures (TPLS) model. 18 Yin et al.19,20 performed singular value decomposition (SVD) method on coefficient matrix of LS and PLS separately, and presented modified partial least squares (MPLS) and improved partial least squares (IPLS). Since all above are linear methods which are unsuitable for non-linear processes, the kernel trick has been widely adopted for non-linear fault detection. Its main idea is to map the original process variables into Reproducing Kernel Hilbert Space (RKHS) through some kernel function, thus making the process variables linearly separable in such kernel space. 21 By introducing the kernel trick, many linear methods can be transformed into non-linear versions.14,22,23 However, all of the above methods design statistics without considering the local characteristics among samples.
k-Nearest neighbor (k-NN) rule is a classical machine learning method, which is usually adopted as a classifier.24,25 Because it is capable of mining local characteristics between near neighbors, 26 k-NN rule has been modified to propose a fault detection method based on the k-NN rule, namely, FD-k-NN. 27 It provides a promising direction for the solution of the above problems to some extent. The statistics of FD-k-NN are designed by fully considering the Euclidean distance measurement among local neighbor samples. Due to its excellent performance, k-NN-based fault detection methods have been studied extensively.28–30 Although these methods have been employed into various tasks, such as multirate sampling process 31 and multimode process, 32 quality-related fault detection methods based on k-NN rule have still not been well-established so far.
Fault isolation is a successor task of fault detection, which is utilized to locate fault sensor variables. Many classical fault isolation approaches have been proposed. Contribution plot and reconstruction-based contribution (RBC) are two most commonly used isolation methods, but they have relatively obvious smearing effect. To deal with this problem, many other fault isolation techniques have been addressed in previous works.33–36 Unfortunately, these methods fail to be used in k-NN-based fault detection. To handle the problem, Zhou et al. 37 proposed a novel fault isolation method based on k-NN rule, VCk-NN, which makes it possible to determine the failed sensors after detecting faults using FD-k-NN. Compared with previous methods, VCk-NN suffers from less effect of fault smearing. Nevertheless, VCk-NN assumes that the process samples follow a multivariate normal distribution, which greatly restricts its effect of fault isolation.
In this article, we propose a novel quality-related fault diagnosis framework, which is made up of two parts: non-linear quality-related fault detection and fault isolation. For quality-related fault detection task, the motivation of proposing kernel partial least squares (KPLS) by combining KPLS with k-NN rule is that (1) KPLS can effectively utilize process variables to obtain predictive quality variables, which will replace the actual quality variables that cannot get in real time, and (2) k-NN rule can mine information between a test sample and the nearest template samples for a better detection effect compared with only using a single test sample. For fault isolation task, the motivation to improve VCk-NN to MVCk-NN is that the hypothesis is sometimes not satisfied, and in this case, VCk-NN still has a smearing effect, so MVCk-NN is presented to deal with this problem by mitigating the influence of faulty variables on faultless variables. The main contributions of this article are summarized as follows:
We propose a new quality-related non-linear fault diagnosis framework based on k-NN rule, including a new quality-related non-linear fault detection method KPLS-k-NN and a new fault isolation method modified VCk-NN.
KPLS-k-NN is proposed by combining KPLS with k-NN rule. Quality-related statistics of KPLS-k-NN take into full consideration the local neighbor information among predicted quality samples, which greatly improve the detection rate (DR) for quality-related faulty samples.
Modified VCk-NN is established by introducing the idea of the relative variable contributions of accumulative relative contribution rate (ARCR) into VCk-NN, which does not need the assumption that the process samples obey a multivariate normal distribution and has more precise isolation results in identifying latent fault root cause than VCk-NN.
The rest of this article is arranged as follows: first, give some relevant preliminaries. Afterward, the k-NN scheme for quality-related non-linear fault diagnosis is proposed in a detailed presentation. Then, the simulation results are provided and discussed. Finally, we conclude the article and present our future work.
Preliminaries
Let the non-linear process contain an input data matrix


where
The implementation of KPLS method is divided into two steps as follows. First, kernel trick
21
is introduced into KPLS model to effectively deal with the non-linear relationship among variables. Given a kernel function

As a necessary step,


where

where

where

Second, PLS model is established between

where
The iterative calculation algorithm of KPLS has been elaborated in Jiao et al.,
14
in which we can get the score matrix


Obviously, the score vector

Methodology
FD-k-NN as a popular fault detection approach has ability in determining whether a fault has occurred in the process, but it cannot estimate whether the fault occurred will have an impact on the production quality.
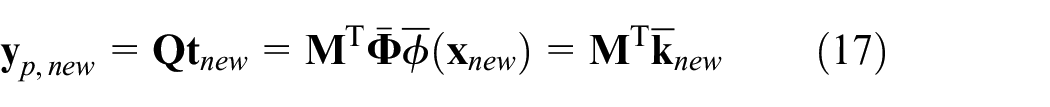
Therefore, in this section, we propose k-NN-based fault diagnosis scheme. Its fault detection scheme KPLS-k-NN is designed as follows: first, FD-k-NN is employed to monitor the process space. Then, KPLS is adopted to obtain the predicted quality samples
The proposed KPLS-k-NN for fault detection
Fault detection in process space
FD-k-NN is designed through following the principle: any normal samples should be close to other normal samples to some extent, while for a faulty sample, it should deviate from normal samples. Usually, the degree of deviation is measured by k-NN distance, which is defined as the average square distance between the test sample and its k-NNs from the training normal samples. When the k-NN distance of a sample exceeds the threshold, it is considered as a faulty sample, otherwise, it is judged as a normal sample. The details of the algorithm are as follows.
Model building
Given the training samples
1. Find the k-NNs for each sample

where
2. Calculate the k-NN distance of

3. Determine the threshold
Fault detection
For a new incoming test sample
Find
Compute
Compare
If
Fault detection in predicted quality space
Given the training process samples

According to the calculation of equations (10) and (11), the predictive output

Similar to process space, we call the space where
At this point, FD-k-NN is employed to perform the detection of quality-related faults in predicted quality space. We need to find the k-NNs for each sample
Different from the threshold in Zhou et al.,
37
in this article, kernel density estimation (KDE)
42
, as a non-parameter probability density estimation method of random variable, is utilized to determine the threshold for two monitoring spaces, which can be referred in detail in Parzen.
38
Thus, corresponding to
For a new incoming test sample
To determine whether
Finally, detection logic is performed by comparing
The whole scheme of KPLS-k-NN
By combining fault detection in process space as well as in predicted quality space, our proposed the whole KPLS-k-NN non-linear quality-related fault detection scheme is summarized as follows:
Offline modeling
Normalize the training process sample
Obtain the coefficient matrix
Calculate
Online detection
For a new incoming test sample
Obtain
Compute the statistics
Detection logic
If
If
If
Notice that our KPLS-k-NN is essentially a supervised quality-related fault detection method, which is designed by combining KPLS with FD-k-NN. The above seems to be a simple combination, but FD-k-NN as an unsupervised method is successfully applied to complete a supervised fault detection task.
The proposed MVCk-NN for fault isolation
The KPLS-k-NN-based fault detection approach has been presented in the above section, which can effectively judge whether there are some faults in the process and whether the faults are related to product quality. Next, when KPLS-k-NN indicates the system exists some faults, a fault isolation method matched with KPLS-k-NN will be needed to locate faulty variables. Here, we propose a new fault isolation method MVCk-NN in detail.
In general, the sensor fault as a kind of system faults is classified as the additive fault. Hence, a process sample

where
To locate which sensors cause the statistics

Then, define the contribution from ith variable of

Obviously, by equations (19) and (20),
Next, we discuss the influence of the fault magnitude on variable contributions. Set

By equations (20) and (21), we have

According to neighborhood relationship, a reasonable hypothesis is given 37 as follows.
Hypothesis 1
Any variable’s fault magnitude is much larger than the Euclidean distance between the variable and its neighbors on the same dimension, that

where
Due to
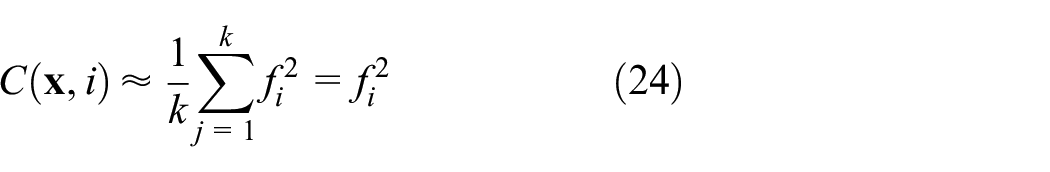
It indicates that the contribution of each fault variable to the statistics is approximately equal to the square of the fault magnitude, and this method hardly suffers from smearing effect when the Hypothesis 1 is satisfied.
The above are VCk-NN-based variable contributions, but there exists a drawback that Hypothesis 1 sometimes cannot be enough satisfied, which causes that the contribution of fault variables may not be significantly different from that of normal variables, so as to increase the smearing effect.
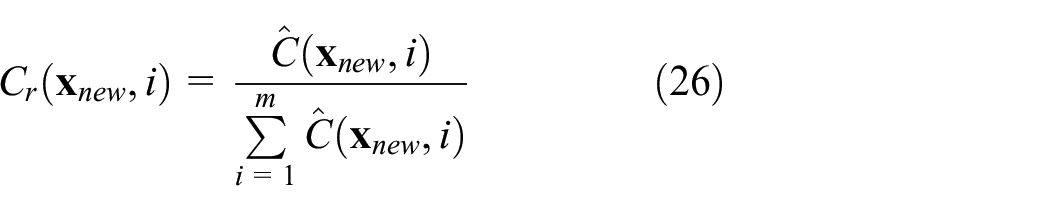
Therefore, our proposed MVCk-NN introduces the idea of ARCR 35 into VCk-NN to obtain the relative variable contributions instead of absolute ones, so that the smearing effect is further eliminated. The detailed steps are illustrated as follows:
1. For a new sample
2. Normalize each

3. To eliminate the smearing effect,
4. The recommended experience threshold is given in Peng et al. 35

where
5. If
Through the above derivation, the flow chart of the proposed k-NN-based quality-related non-linear fault diagnosis scheme is summarized in Figure 1.

The quality-related non-linear fault diagnosis framework of k-NN.
Case study
This section applies a widely typical numerical and a real industrial Tennessee Eastman (TE) process benchmark to validate the effectiveness of our proposed method. Two fault evaluation indexes are adopted for performance evaluation. In the fault detection stage, our method KPLS-k-NN will be compared with the state-of-the-art approach total kernel projection to latent structures (TKPLS)
22
and the most recent SVD-based non-linear method modified kernel least squares (MKLS)
23
to show its superiorities. In the fault isolation stage, our MVCk-NN will be compared with VCk-NN. Besides, in the experiment, the confidence level
Evaluation index
Two evaluation indexes—that is, the fault DR and the false alarm rate (FAR)—are used in our experiments, which are defined as follows


where an effective alarm represents a quality-related faulty sample is detected, while a false alarm represents a quality-unrelated faulty sample is detected. For performance evaluation, when a quality-related fault occurs, DR is adopted as the key indicator, while when a quality-unrelated fault happens, then FAR is used as the key indicator. More details on DR and FAR can be referred to Wang and Jiao. 23
Typical numerical example
The following numerical example introduced in Peng et al. 22 is applied

where
From the above equation, we can see that
Fault 1: step bias occurs in
Fault 2: ramp change occurs in
Fault 3: step bias occurs in
Fault 4: ramp change occurs in
The model parameters are
The results of quality-related faults
Fault detection
The detection results for Fault 1 and Fault 2 of KPLS-k-NN, MKLS, and TKPLS are displayed in Table 1. As shown in Table 1, the DRs of three methods to detect Fault 1 are all
Detection results of KPLS-k-NN, MKLS, and TKPLS for quality-related Fault 1 and Fault 2 (%).
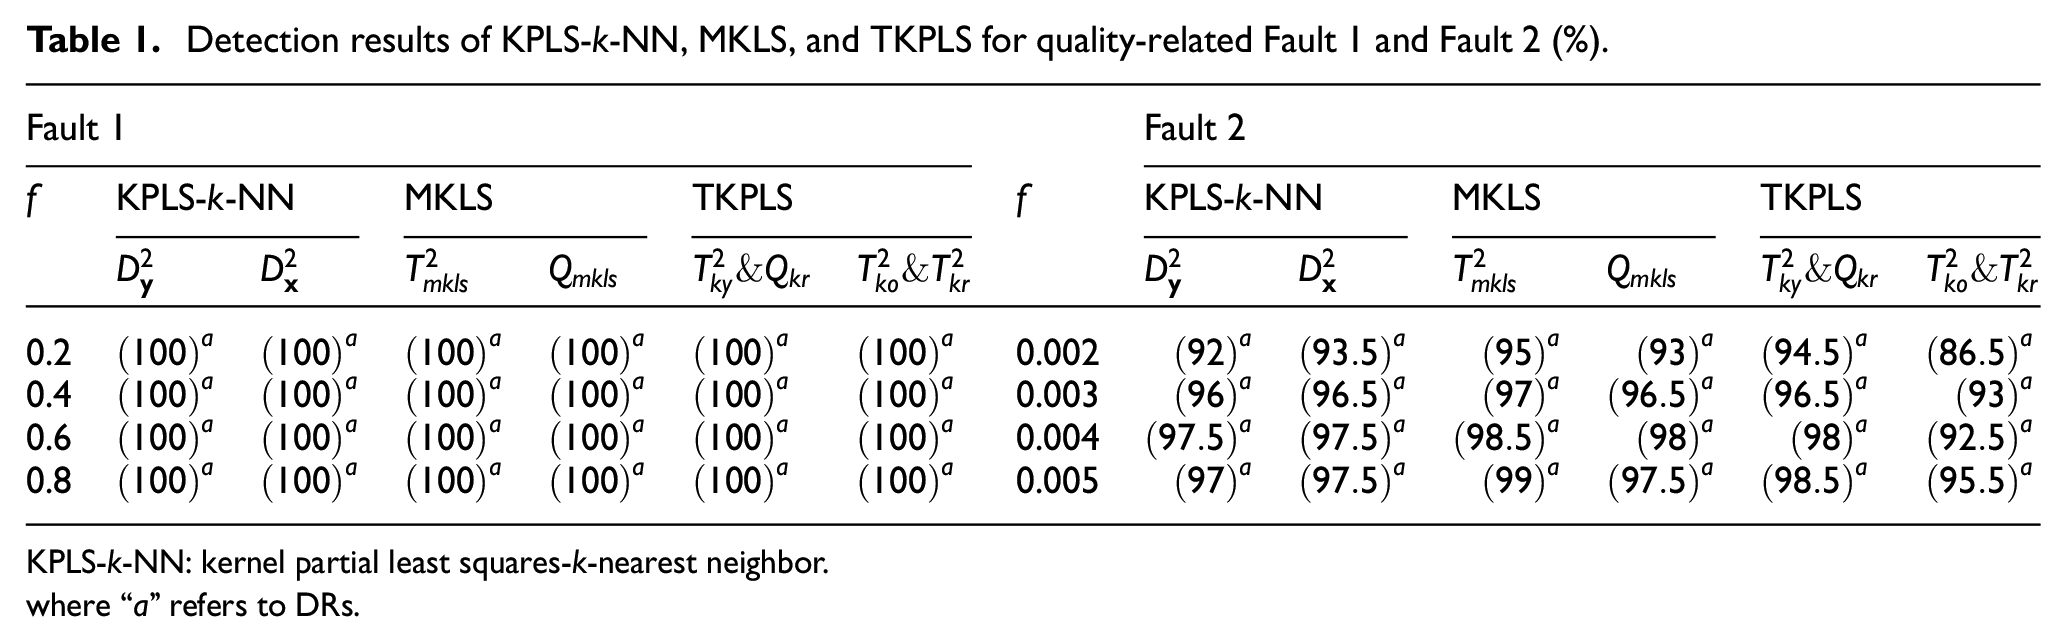
KPLS-k-NN: kernel partial least squares-k-nearest neighbor.
where “a” refers to DRs.
Furthermore, without loss of generally, we set
Detection results of quality-related Fault 1 with
Fault isolation
When

Isolation results of quality-related Fault 1 with
The results of quality-unrelated faults
Fault detection
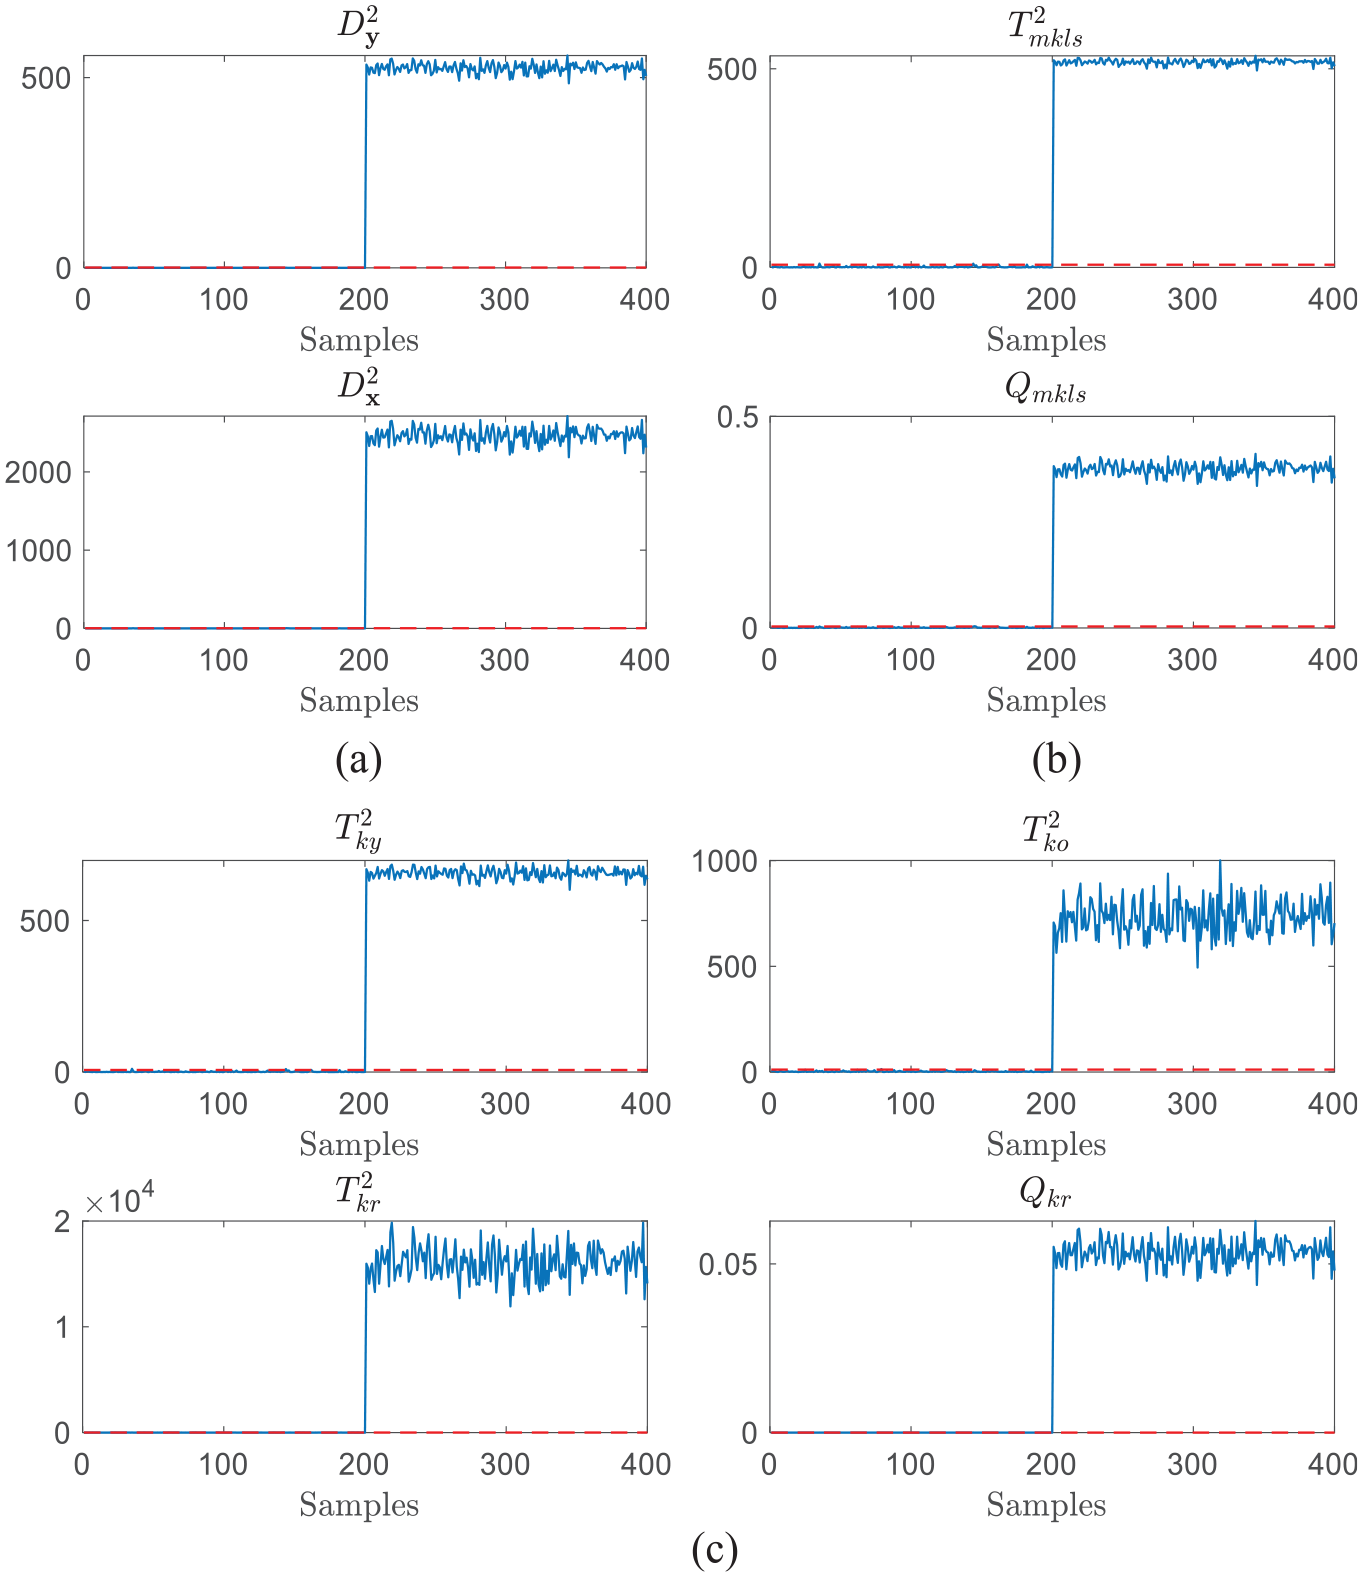
The results to detect Fault 3 and Fault 4 using three methods are shown in Table 2. Because the quality-unrelated statistics of these three approaches are all over
Detection results of KPLS-k-NN, MKLS, and TKPLS for quality-unrelated Fault 3 and Fault 4 (%).
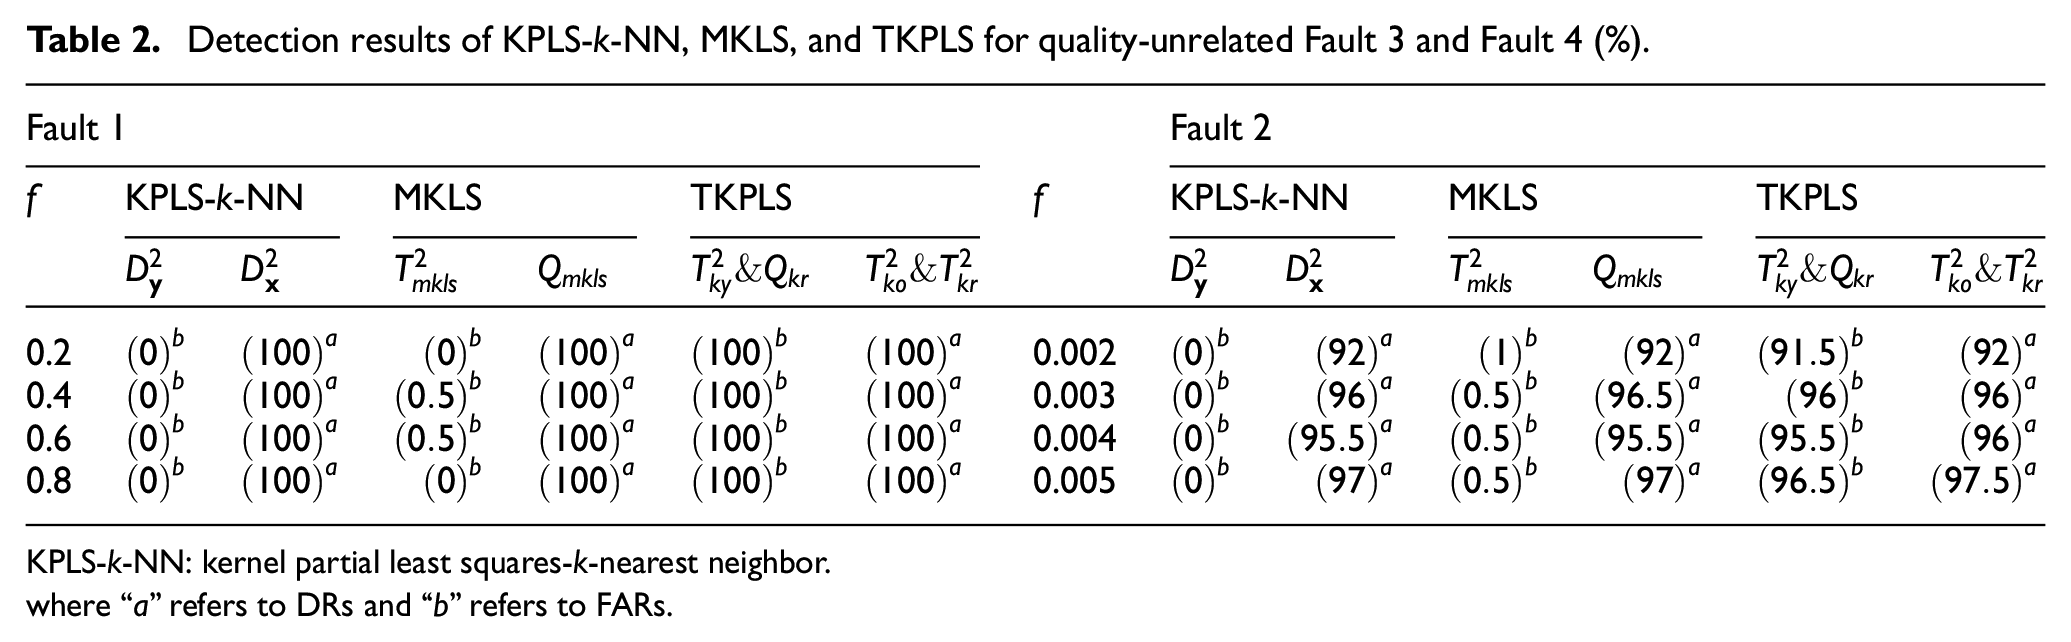
KPLS-k-NN: kernel partial least squares-k-nearest neighbor.
where “a” refers to DRs and “b” refers to FARs.
We set

Detection results of quality-unrelated Fault 2 with
Fault isolation
When
Isolation results of quality-related Fault 2 with
Through the above analysis of the experimental results, our method KPLS-k-NN does a much excellent job for quality-related fault detection task than other comparison methods. Besides, when KPLS-k-NN indicates some faults happen, our proposed MVCk-NN has high accuracy in fault root cause diagnosis and has prominent advantages over VCk-NN.
TE benchmark
TE process is a real simulation benchmark of industrial process, which has been widely utilized for the simulation and verification of various control and MSPM approaches,
39
and its structure flowchart is shown in Figure 6. The variables in this process contain two blocks of variables: the XMV block of 11 manipulated variables and the XMEAS block of 41 measured variables which include 22 process and 19 analysis variables. In this simulation, 22 process variables (XMEAS (1–22)) and 11 manipulated variables (XMV (1–11)) are chosen to be process input

The structure flowchart of the TE process.
The training data set and validation data set contain 500 and 960 fault-free data samples, respectively. For the test data set, it is composed of 21 different fault sets, each of which includes 960 data samples and they are displayed in Table 3. The fault categories can be roughly divided into the following ones: step faults, random variation faults, slow drift faults, sticking faults, constant position faults, and some unknown faults. The detailed fault information is described in Downs and Vogel 40 and the website (http://depts.washington.edu/control/LARRY/TE/download.html).
Fault types in the TE process.
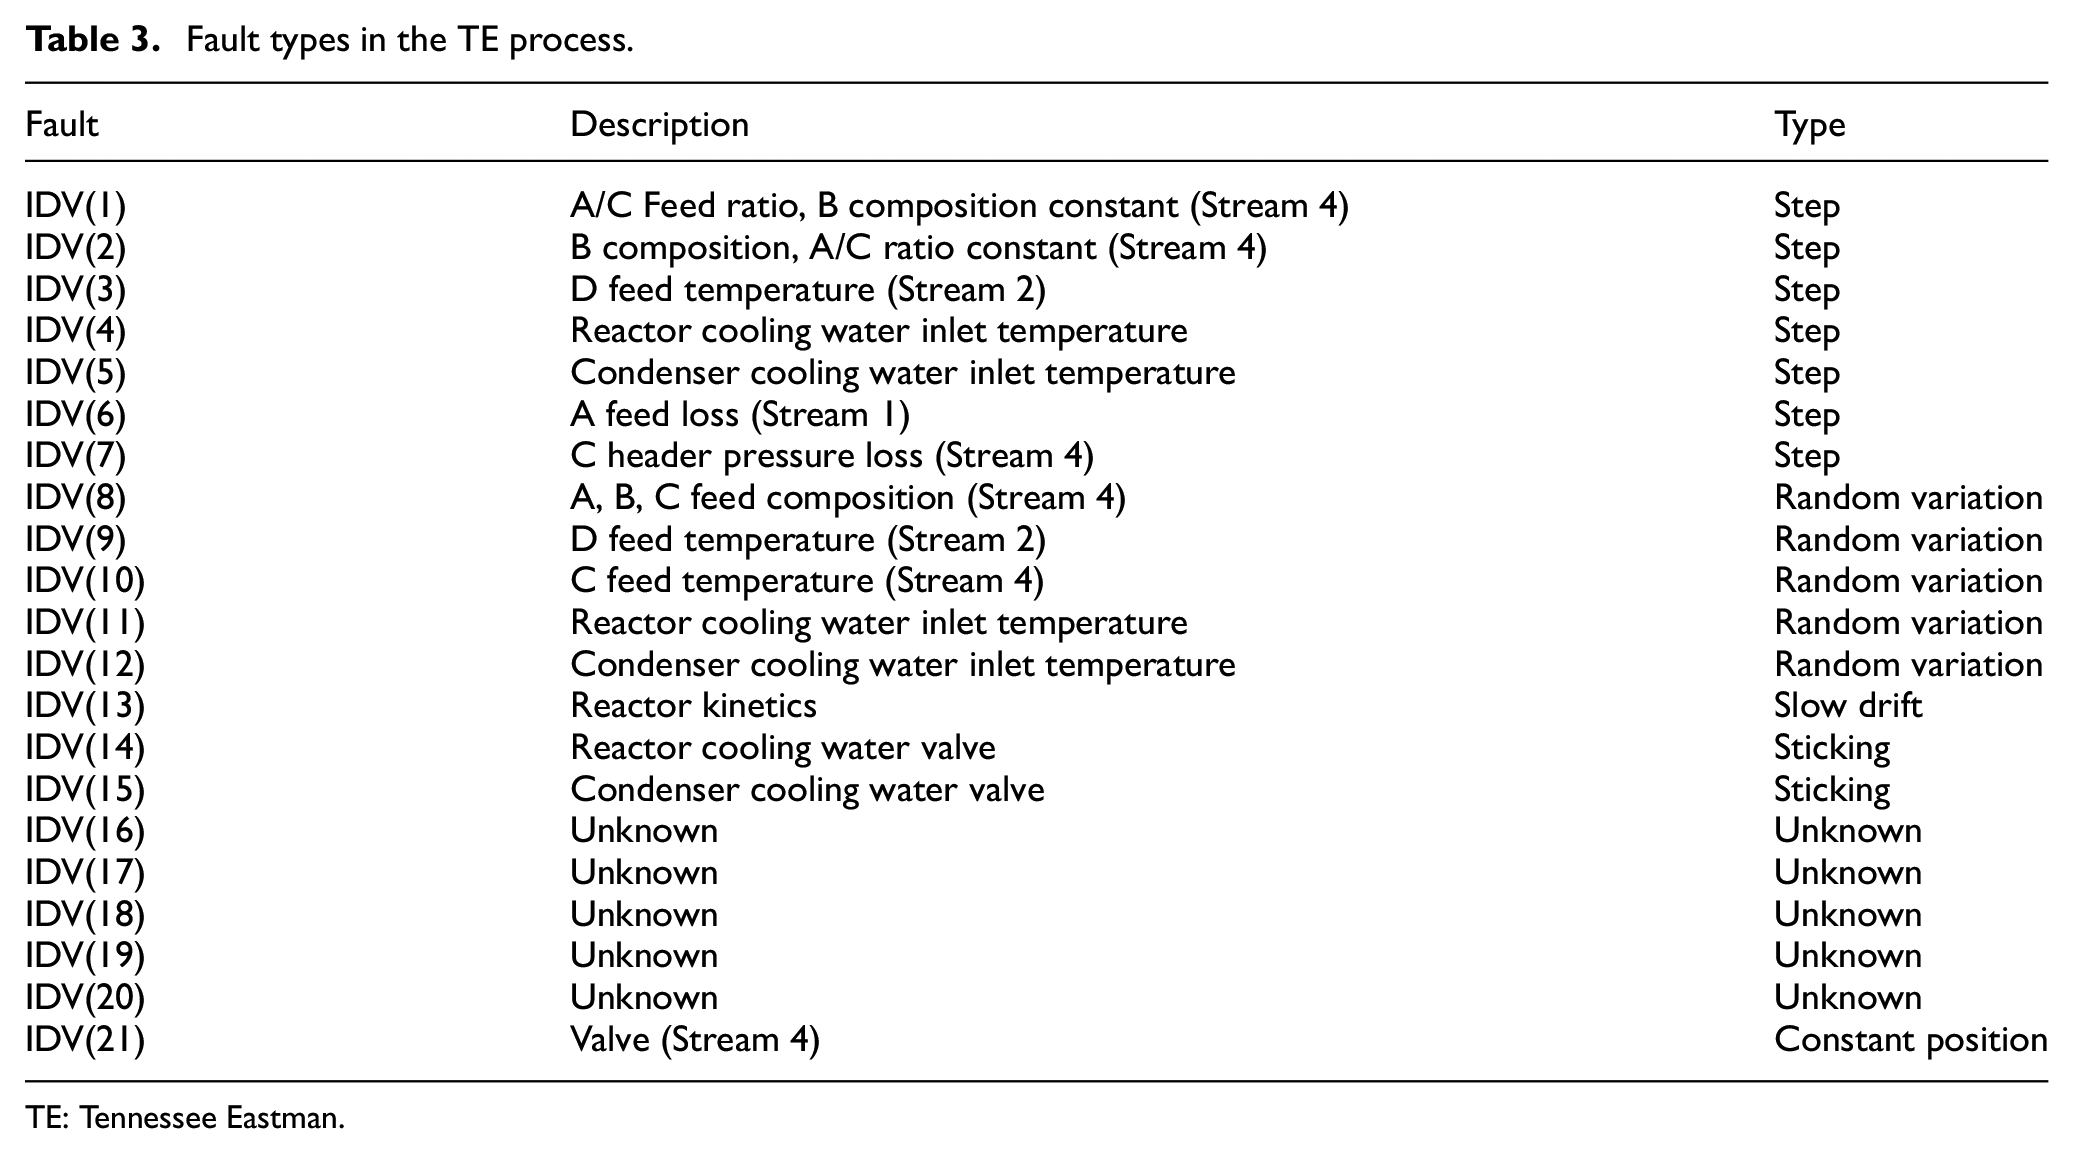
TE: Tennessee Eastman.
To classify the process faults into the category of affecting
The results of fault detection
For the quality-related faults, detection results of KPLS-k-NN, MKLS and TKPLS are presented in Table 4. We can see that TKPLS performs better than KPLS-k-NN and MKLS since all its FDRs are higher than the corresponding ones of the other methods. However, KPLS-k-NN and MKLS still provide satisfactory results, with most of their statistics above being
Detection results of KPLS-k-NN, MKLS, and TKPLS for quality-related faults in the TE process (%).

KPLS-k-NN: kernel partial least squares-k-nearest neighbor.
where “a” refers to DRs.
For the quality-unrelated faults, Table 5 gives the detection results. We can see the corresponding statistics
Detection results of KPLS-k-NN, MKLS, and TKPLS for quality-unrelated faults in the TE process (%).

KPLS-k-NN: kernel partial least squares-k-nearest neighbor.
where “a” refers to DRs and “b” refers to FARs.
The results of fault isolation
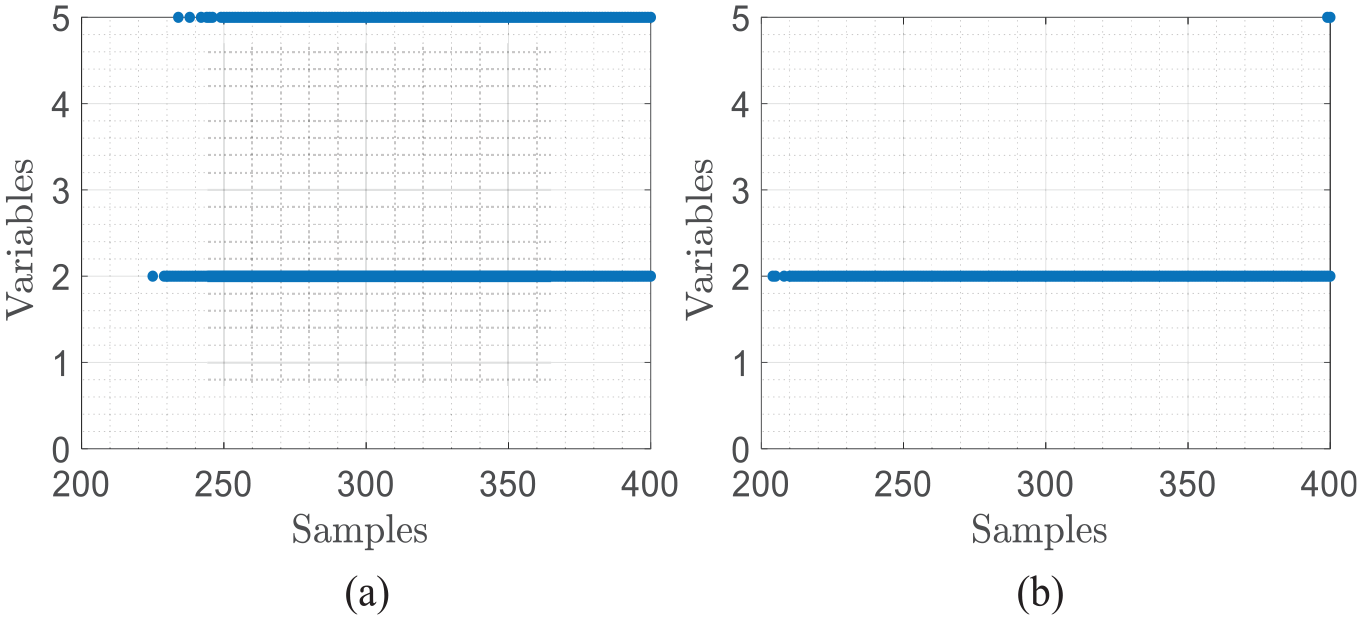
We select IDV(1) to verify the fault isolation effect of MVCk-NN by compared with VCk-NN. IDV(1) is a step fault which represents the change of A/C feed ration. The root cause of IDV(1) is the variable of
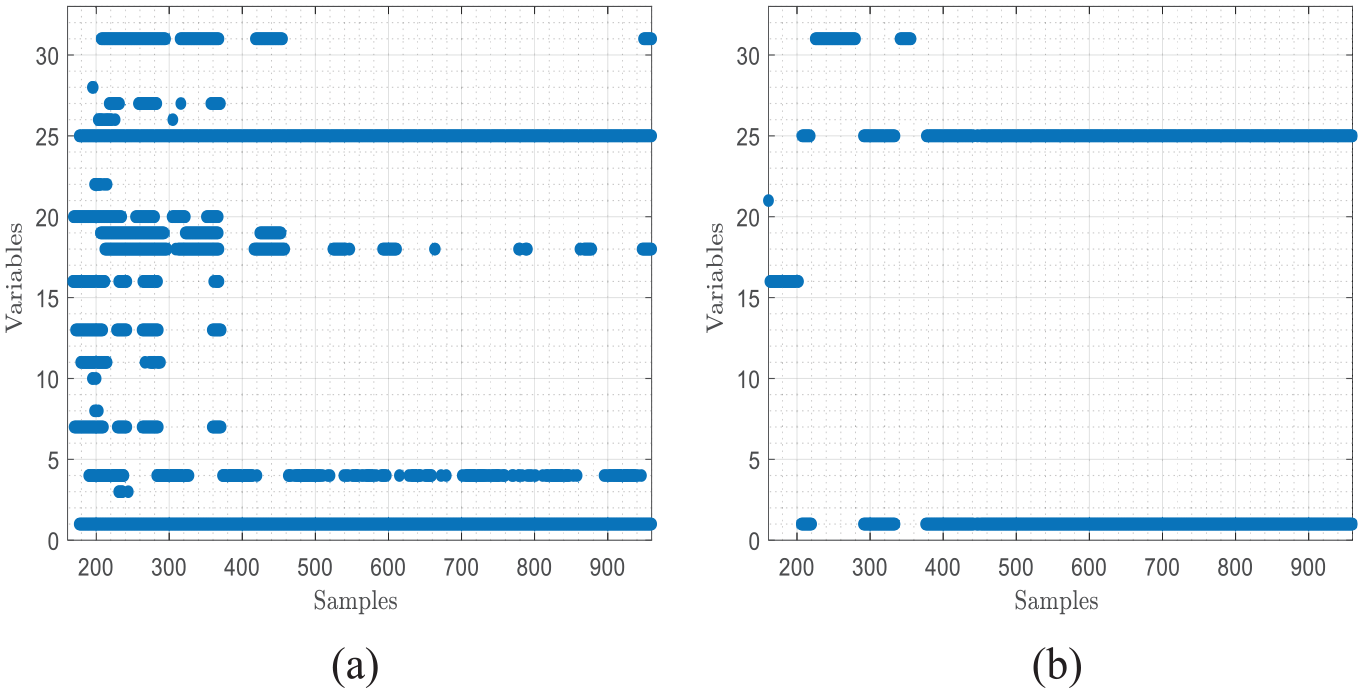
Fault isolation results for IDV(1) by (a) MVCk-NN and (b) VCk-NN.
According to the above results, we can conclude that the proposed method is effective in quality-related non-linear fault diagnosis and has prominent advantages over traditional methods. Compared with the SVD-based methods, KPLS-k-NN directly utilizes the relationship among the predicted quality samples to design the statistics, which considers the information of the nearest neighbor structure. Besides, KPLS-k-NN directly detects the process space, avoiding the problem that the residual statistics may have a large component of variance, such as MKLS. Moreover, compared with VCk-NN, the proposed MVCk-NN has advantages in both variable contribution and threshold setting.
Conclusion
In this article, we present a novel quality-related non-linear fault diagnosis method based on k-NN, which is especially suitable for non-linear industrial processes with relatively small training samples. It consists of a new quality-related fault detection method KPLS-k-NN and a new fault isolation method MVCk-NN. First, KPLS is applied to establish a regression model between process variables and quality variables in order to obtain predictive quality samples. Then, FD-k-NN method is used to design two corresponding statistics, that is,
Footnotes
Handling Editor: Yanjiao Chen
Declaration of conflicting interests
The author(s) declared no potential conflicts of interest with respect to the research, authorship, and/or publication of this article.
Funding
The author(s) disclosed receipt of the following financial support for the research, authorship, and/or publication of this article: This work was supported by the National Natural Science Foundation of China (No. 61976213, No. 61772525 and No. 61906191).